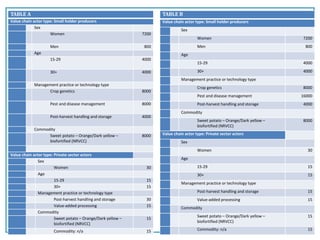
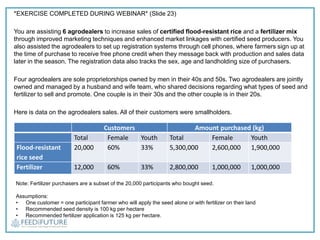
Here is how I would report this data in the new indicators:
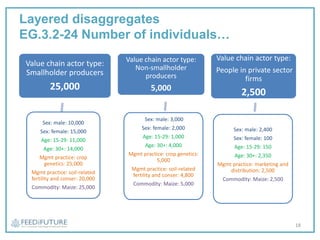
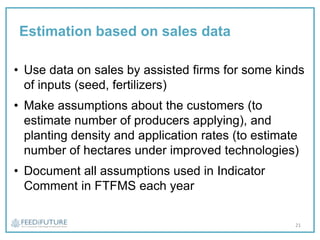
EG.3.2-24 Number of individuals in the agriculture system who have applied improved management practices or technologies with USG assistance [IM-level]
Value chain actor type: Smallholder producers
Sex: Female 12,000
Sex: Male 8,000
Age: 15-29 6,600
Age: 30+ 13,400
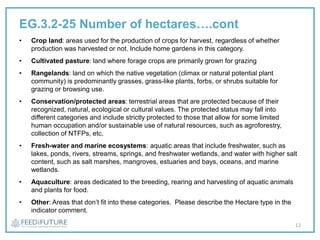
Management practice/technology type: Crop genetics 20,000
Management practice/technology type: Soil fertility 12,000
Commodity: Rice 20,000
Value chain actor type: Private sector actors
Sex: Male 4
Sex: Female 2
Age: 15-29


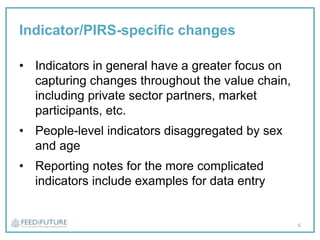
![Webinar objectives
• Key points of definitions, disaggregations and data
collection approaches to enable better data collection
and reporting for:
– EG.3.2-24 Number of individuals in the agriculture system who
have applied improved management practices or technologies
with USG assistance [IM-level]
– EG.3.2-25 Number of hectares under improved management
practices or technologies with USG assistance [IM-level]
– EG.3.2-28 Number of hectares under improved management
practices or technologies that promote improved climate risk
reduction and/or natural resources management with USG
assistance [IM-level]
4](https://image.slidesharecdn.com/ftfmelwebinarseriesapplicationtechnologies06132018final-240208153139-180d86b2/85/ftf_mel_webinar_series_application_technologies_06132018_final-pptx-4-320.jpg)
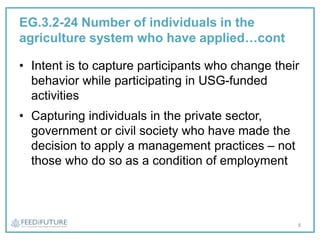
![EG.3.2-24 Number of individuals in the agriculture
system who have applied improved management
practices or technologies with USG assistance [IM-level]
• Expanded due to greater focus on capturing
results throughout the value chain
• Not just producers! Individuals in the private
sector, government, and civil society
• A participant is defined as “individuals,
enterprises, organizations and other entities that
participate in Feed the Future projects, including
those reached directly, those reached as part of
a deliberate service delivery strategy, and those
participating in the market we strengthen.”
7](https://image.slidesharecdn.com/ftfmelwebinarseriesapplicationtechnologies06132018final-240208153139-180d86b2/85/ftf_mel_webinar_series_application_technologies_06132018_final-pptx-7-320.jpg)
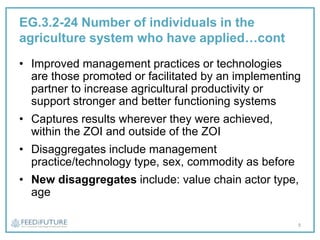
![EG.3.2-25 Number of hectares under improved
practices or technologies with USG assistance [IM-
level]
• Land or marine areas cultivated by producers
• Expanded to include aquaculture and fisheries
production areas
• Management practices are agriculture-related,
land- or water-based management practices and
technologies promoted as a way to increase
producer’s productivity directly or to support
stronger and better functioning systems.
• Captures results wherever they were achieved,
within the ZOI and outside of the ZOI
10](https://image.slidesharecdn.com/ftfmelwebinarseriesapplicationtechnologies06132018final-240208153139-180d86b2/85/ftf_mel_webinar_series_application_technologies_06132018_final-pptx-10-320.jpg)
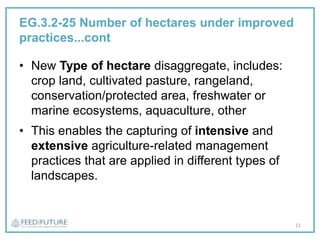
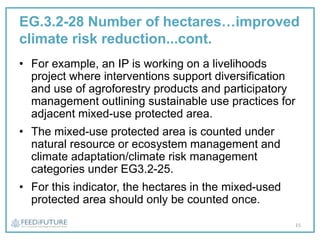
![EG.3.2-28 Number of hectares under improved management
practices or technologies that promote improved climate risk
reduction and/or natural resources management with USG
assistance [IM-level]
• Reports on the unique number of hectares from
a subset of three of indicator EG.3.2-25
management practice category disaggregates
– Natural resource or ecosystem management
– Climate mitigation
– Climate adaptation/climate risk management
• Since it is possible that the same hectare can be
counted under different management practice
types, IPs will need to eliminate double counting
across the 3 management practice types
14](https://image.slidesharecdn.com/ftfmelwebinarseriesapplicationtechnologies06132018final-240208153139-180d86b2/85/ftf_mel_webinar_series_application_technologies_06132018_final-pptx-14-320.jpg)