Downloaded 36 times


![Moldflow Analysis ReportMoldflow Analysis Report
Reported by: Tom
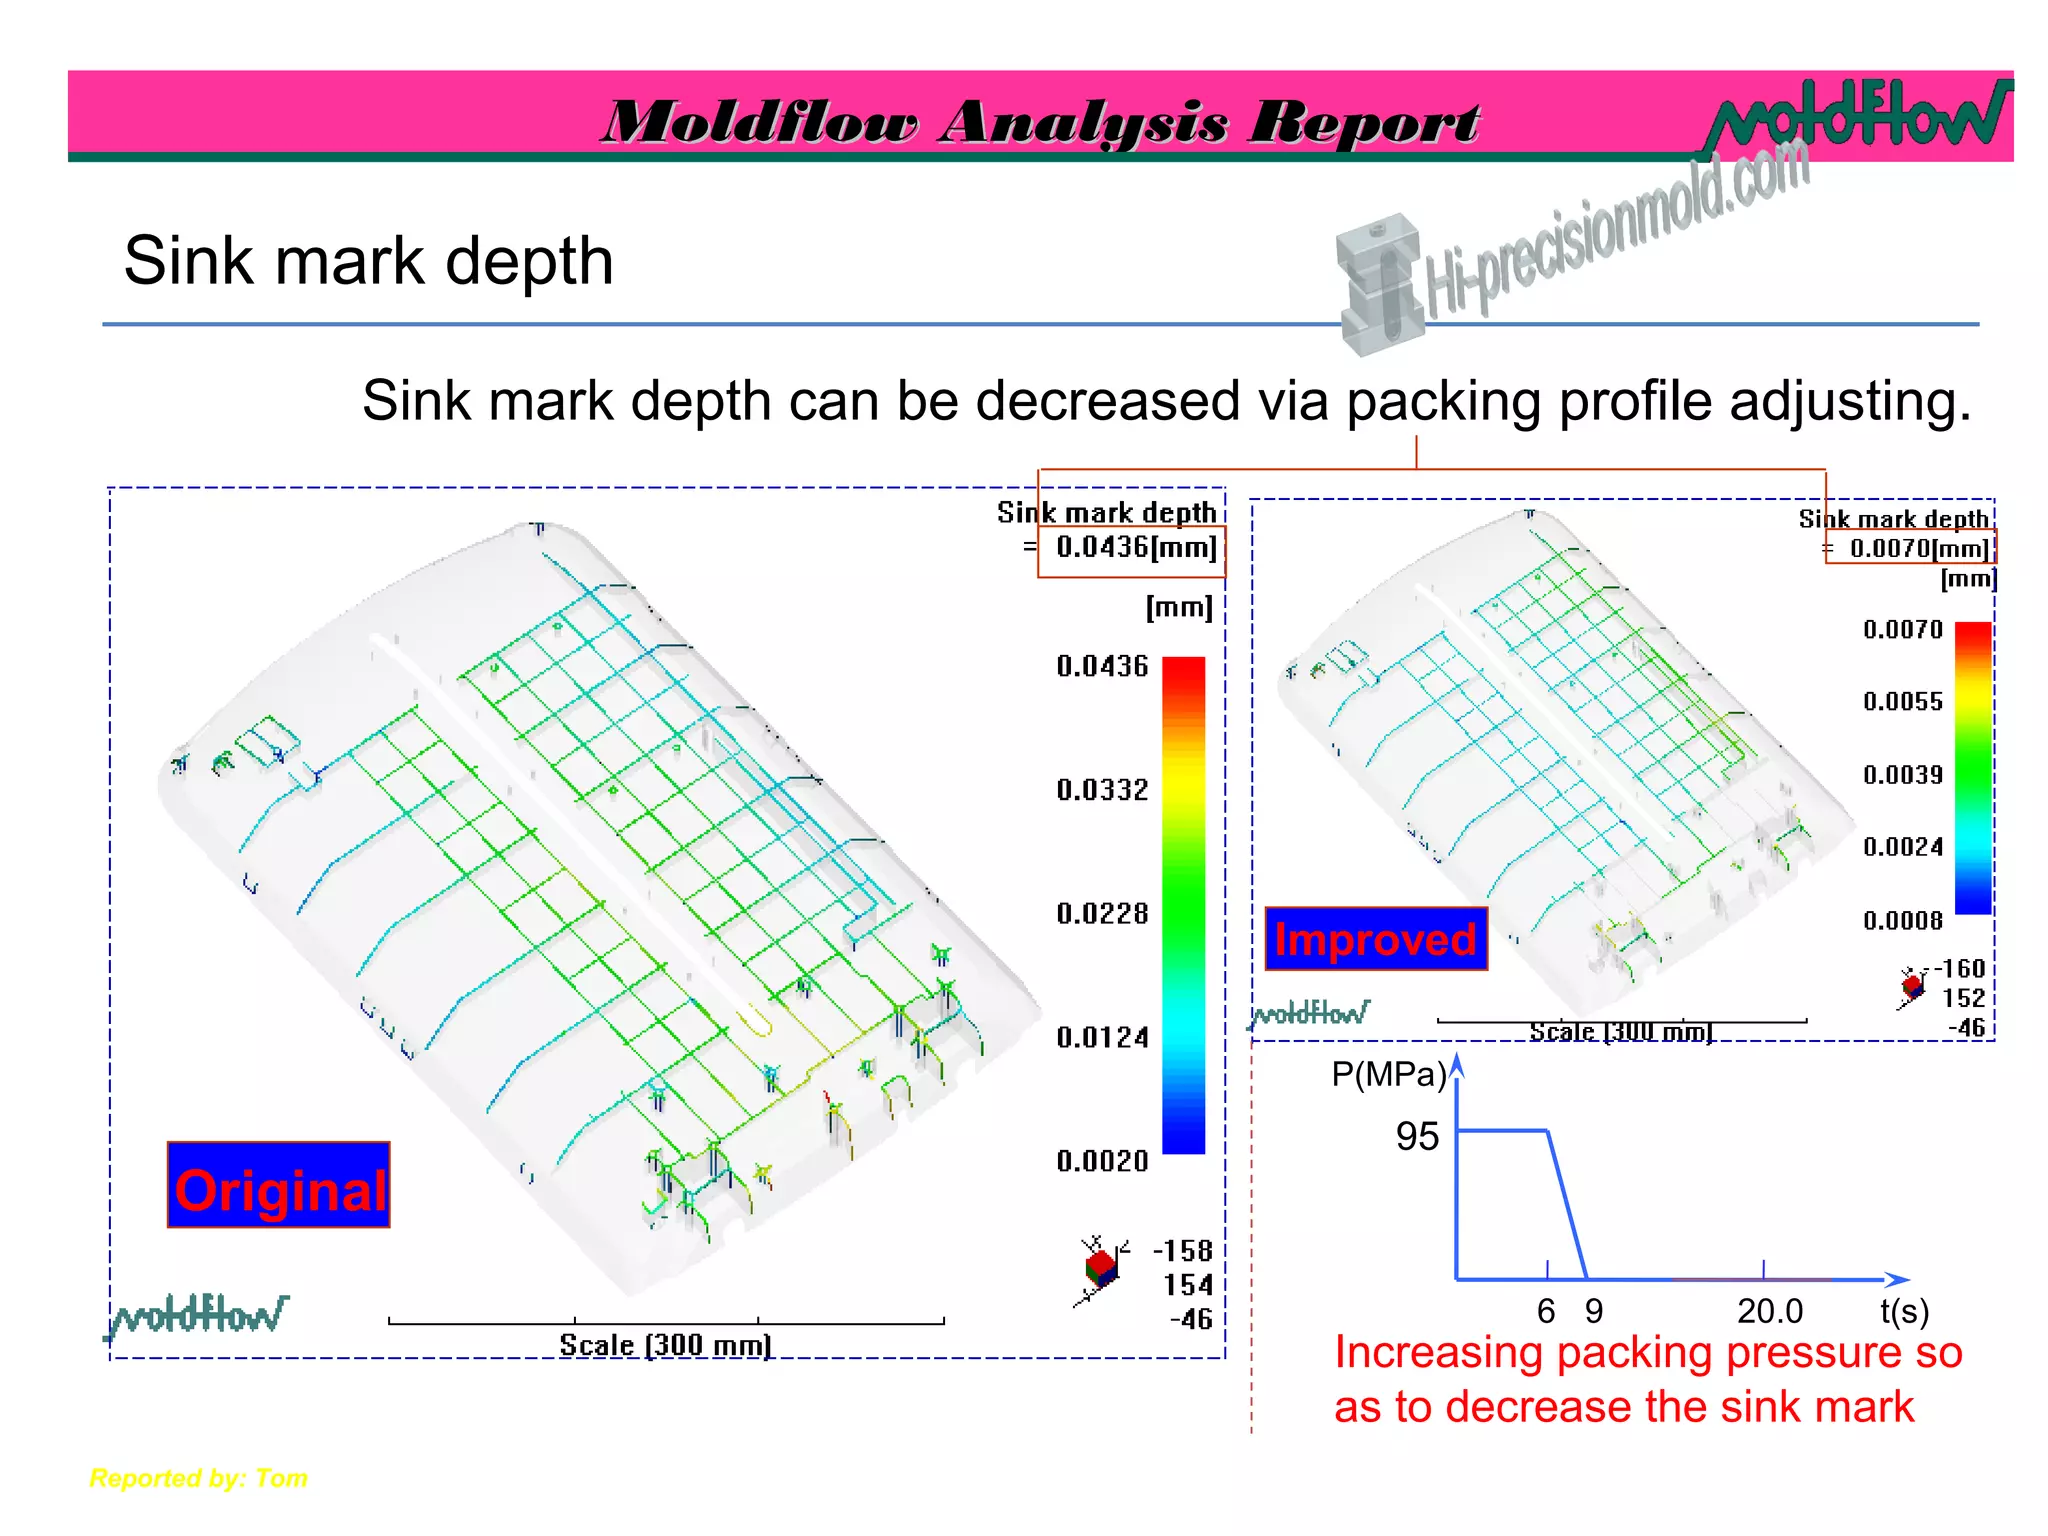
9 20.0 t(s)
P(MPa
)
84.5
Processing conditions
Filling Conditions :
Mold temperature : 44.00 deg.C
Melt temperature : 235.00 deg.C
Injection time : 2.2 sec
Cooling Conditions:
Coolant Temperature(Cavity) 34 deg.C
Coolant Temperature(Core) 34 deg.C PRESSURE[MPa] STEP DURATION [sec]
84.5 0.0
84.5 9
Packing is 80% max
injection pressure
Packing profile :](https://image.slidesharecdn.com/moldflowfromhi-precision-160730052156/75/Mold-flow-from-hi-precision-7-2048.jpg)
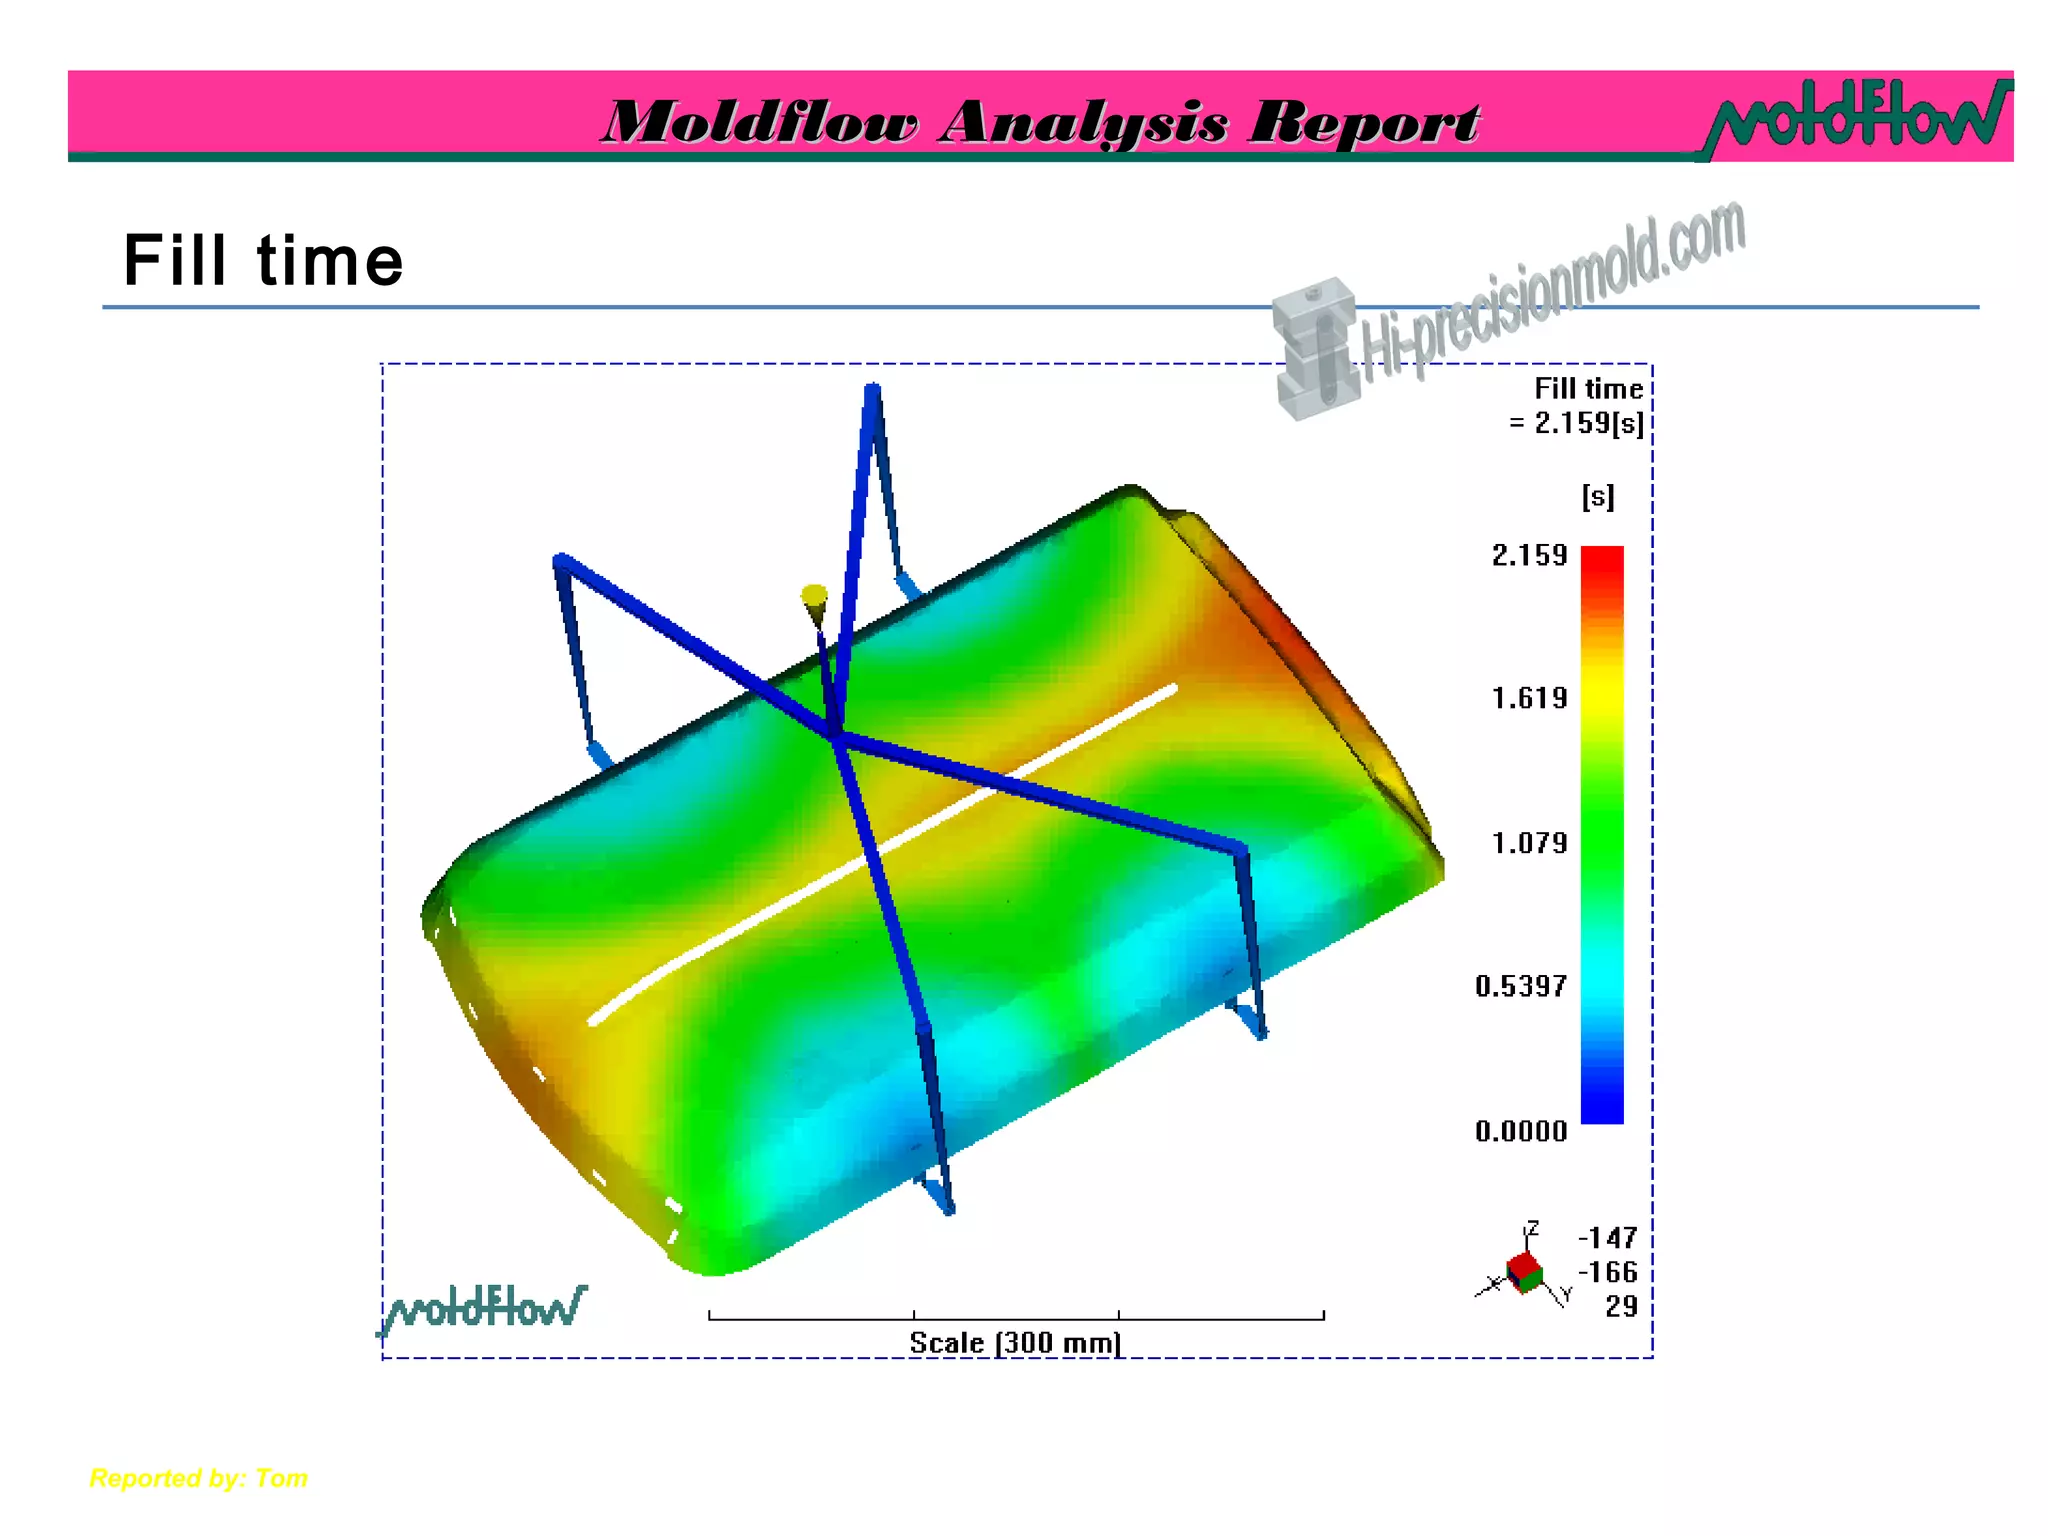
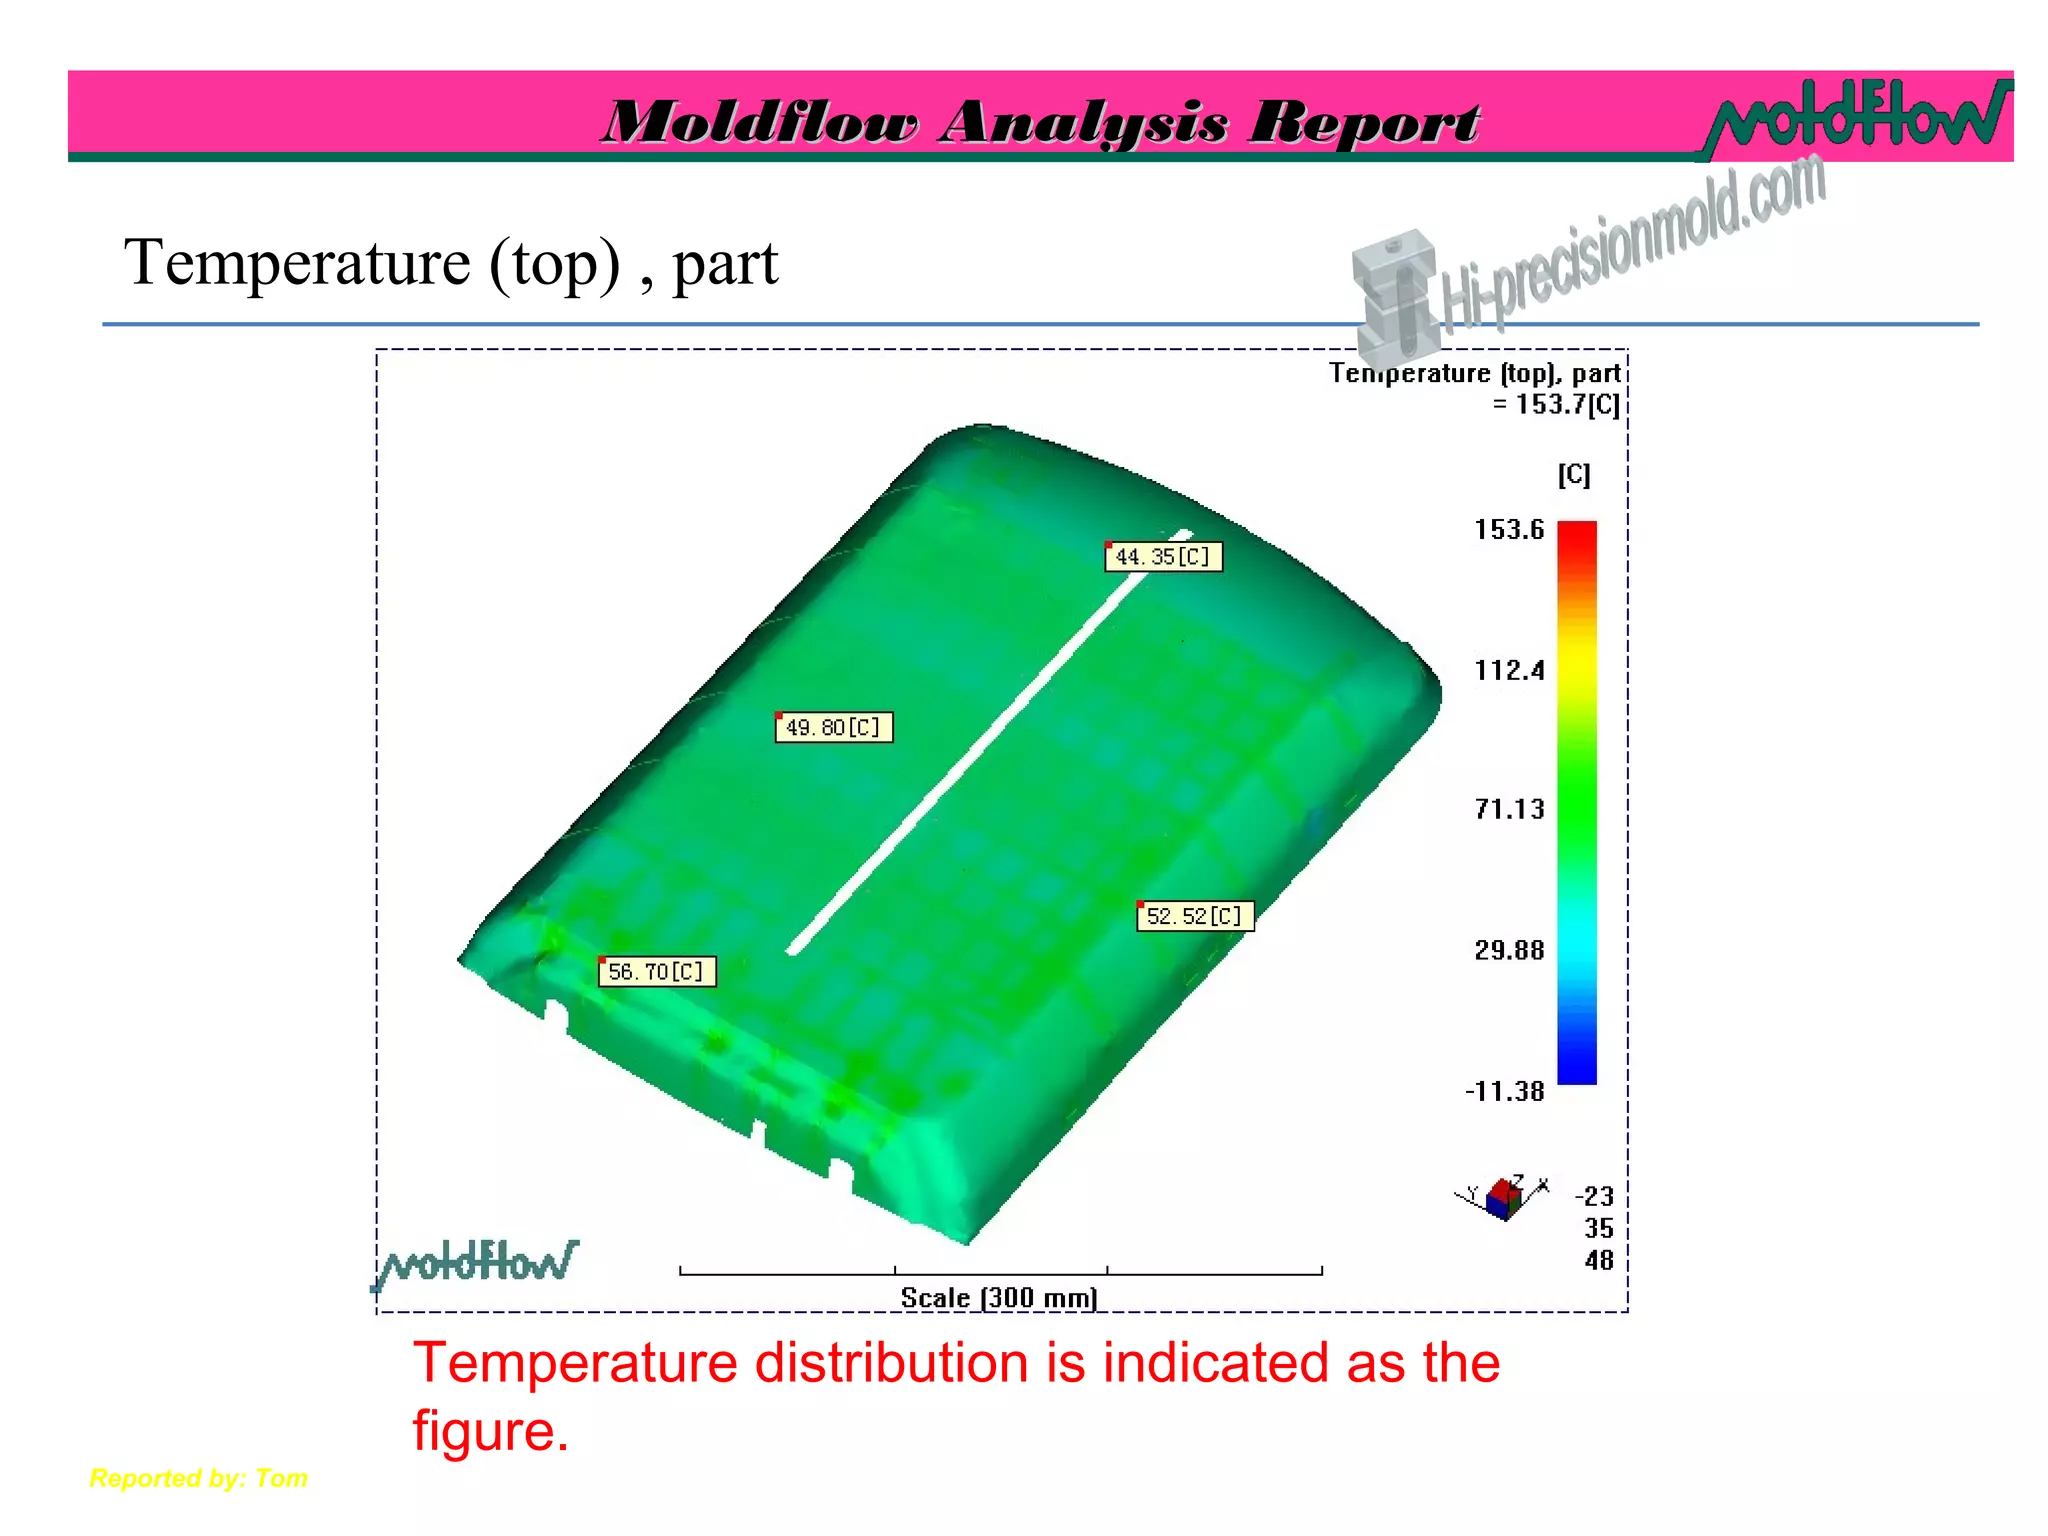
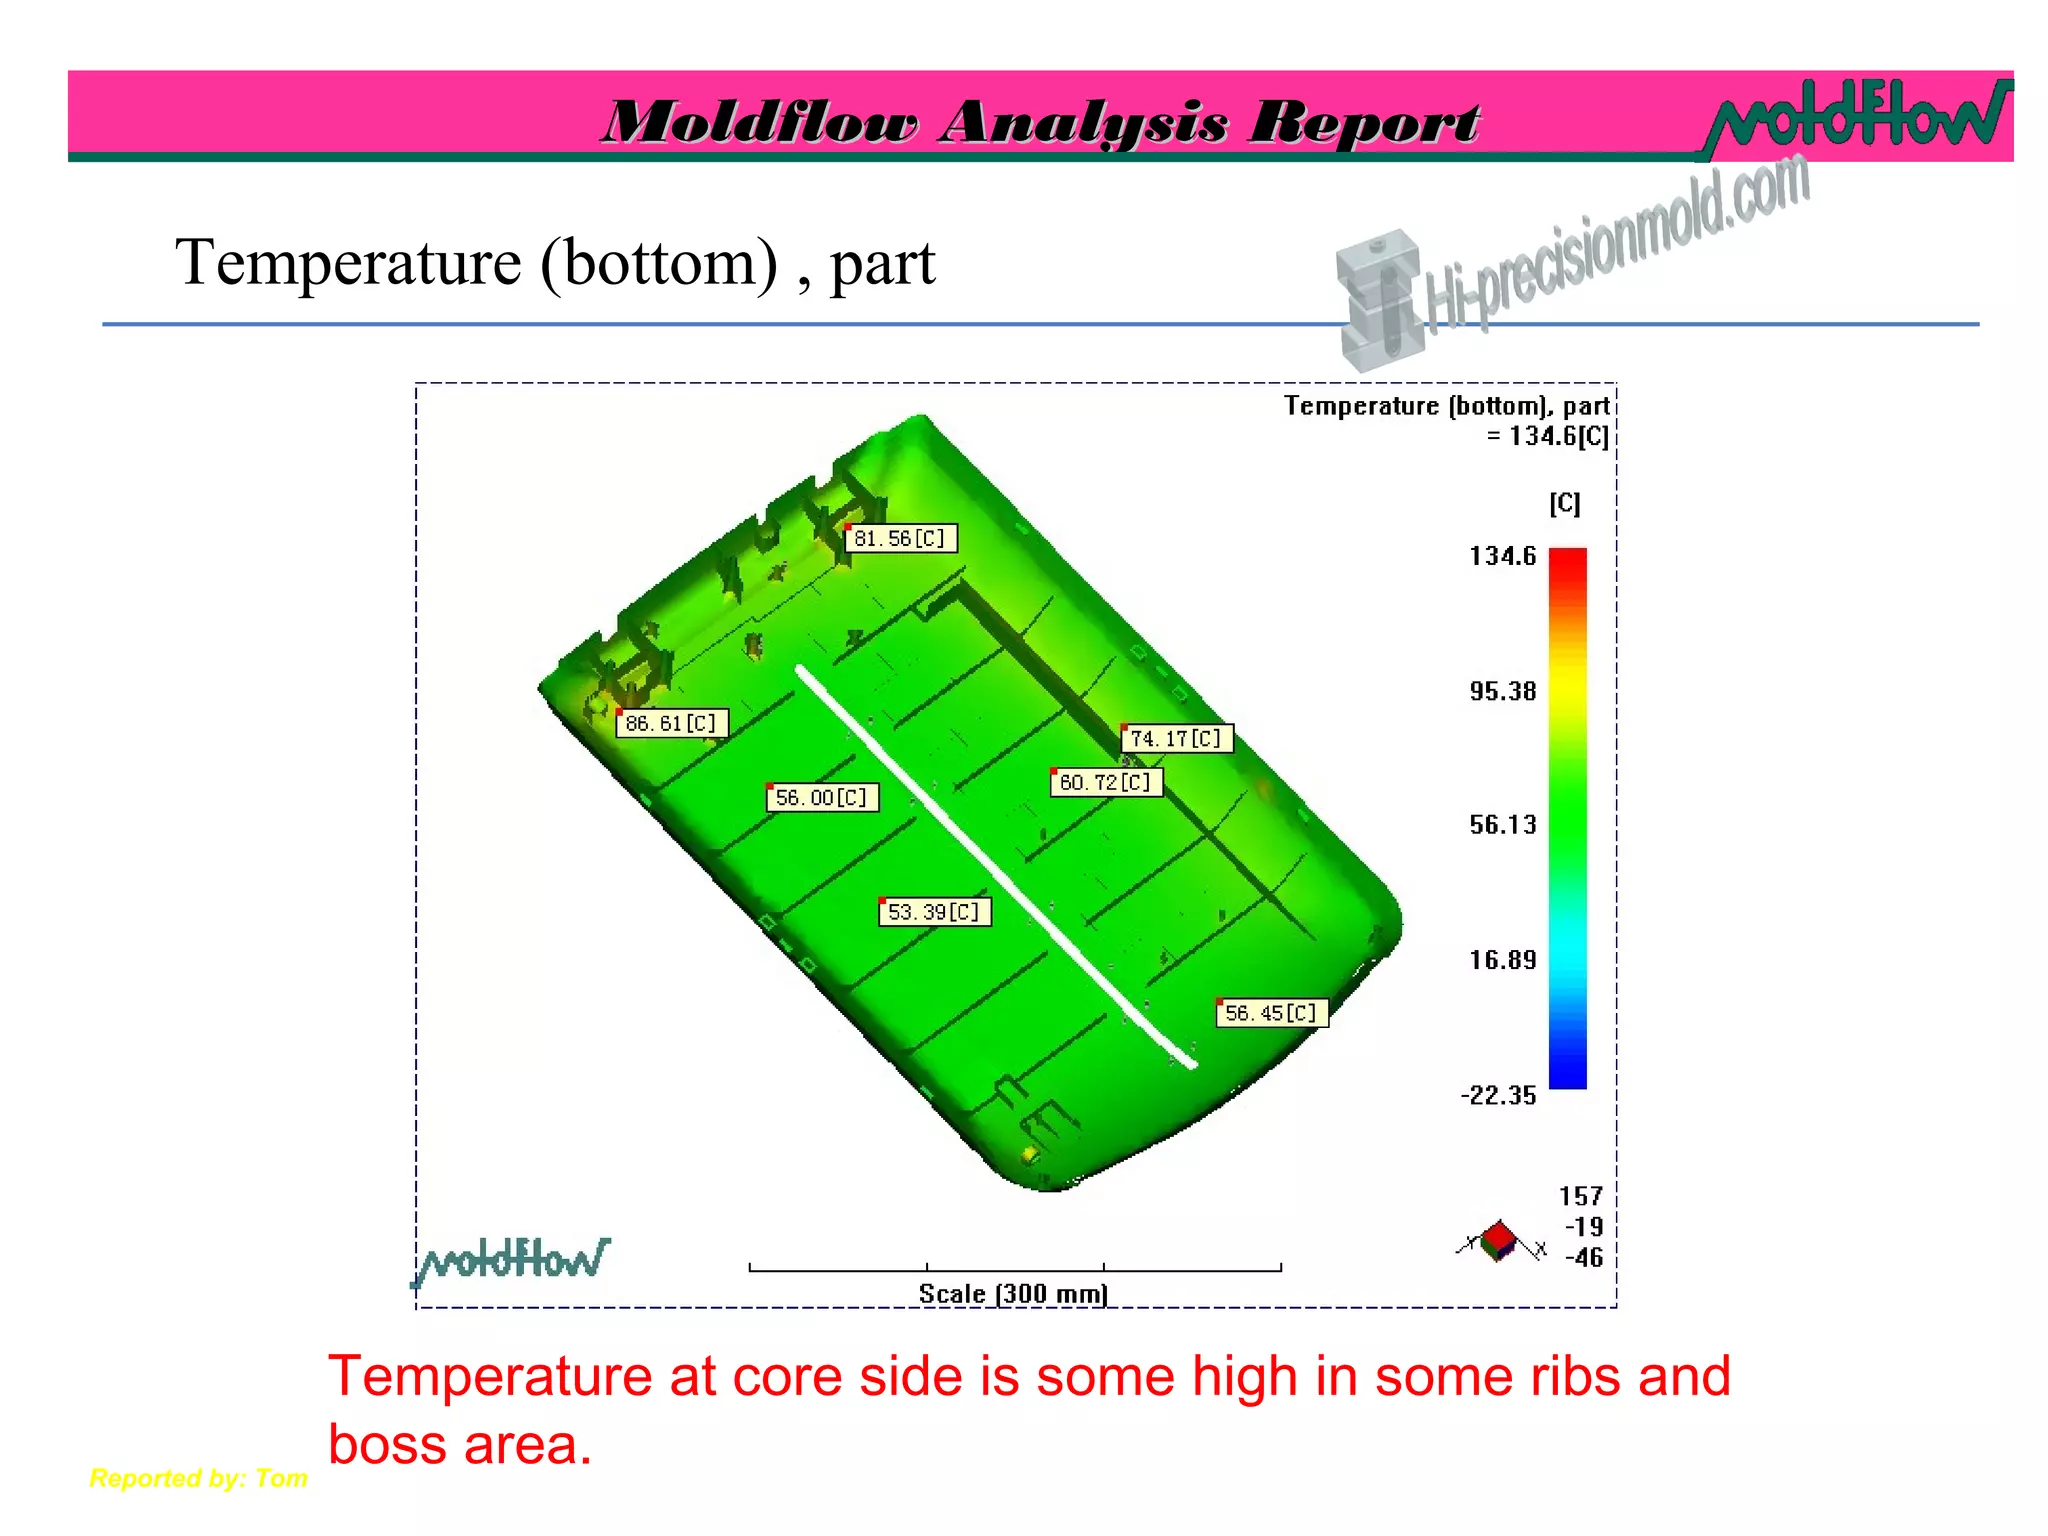
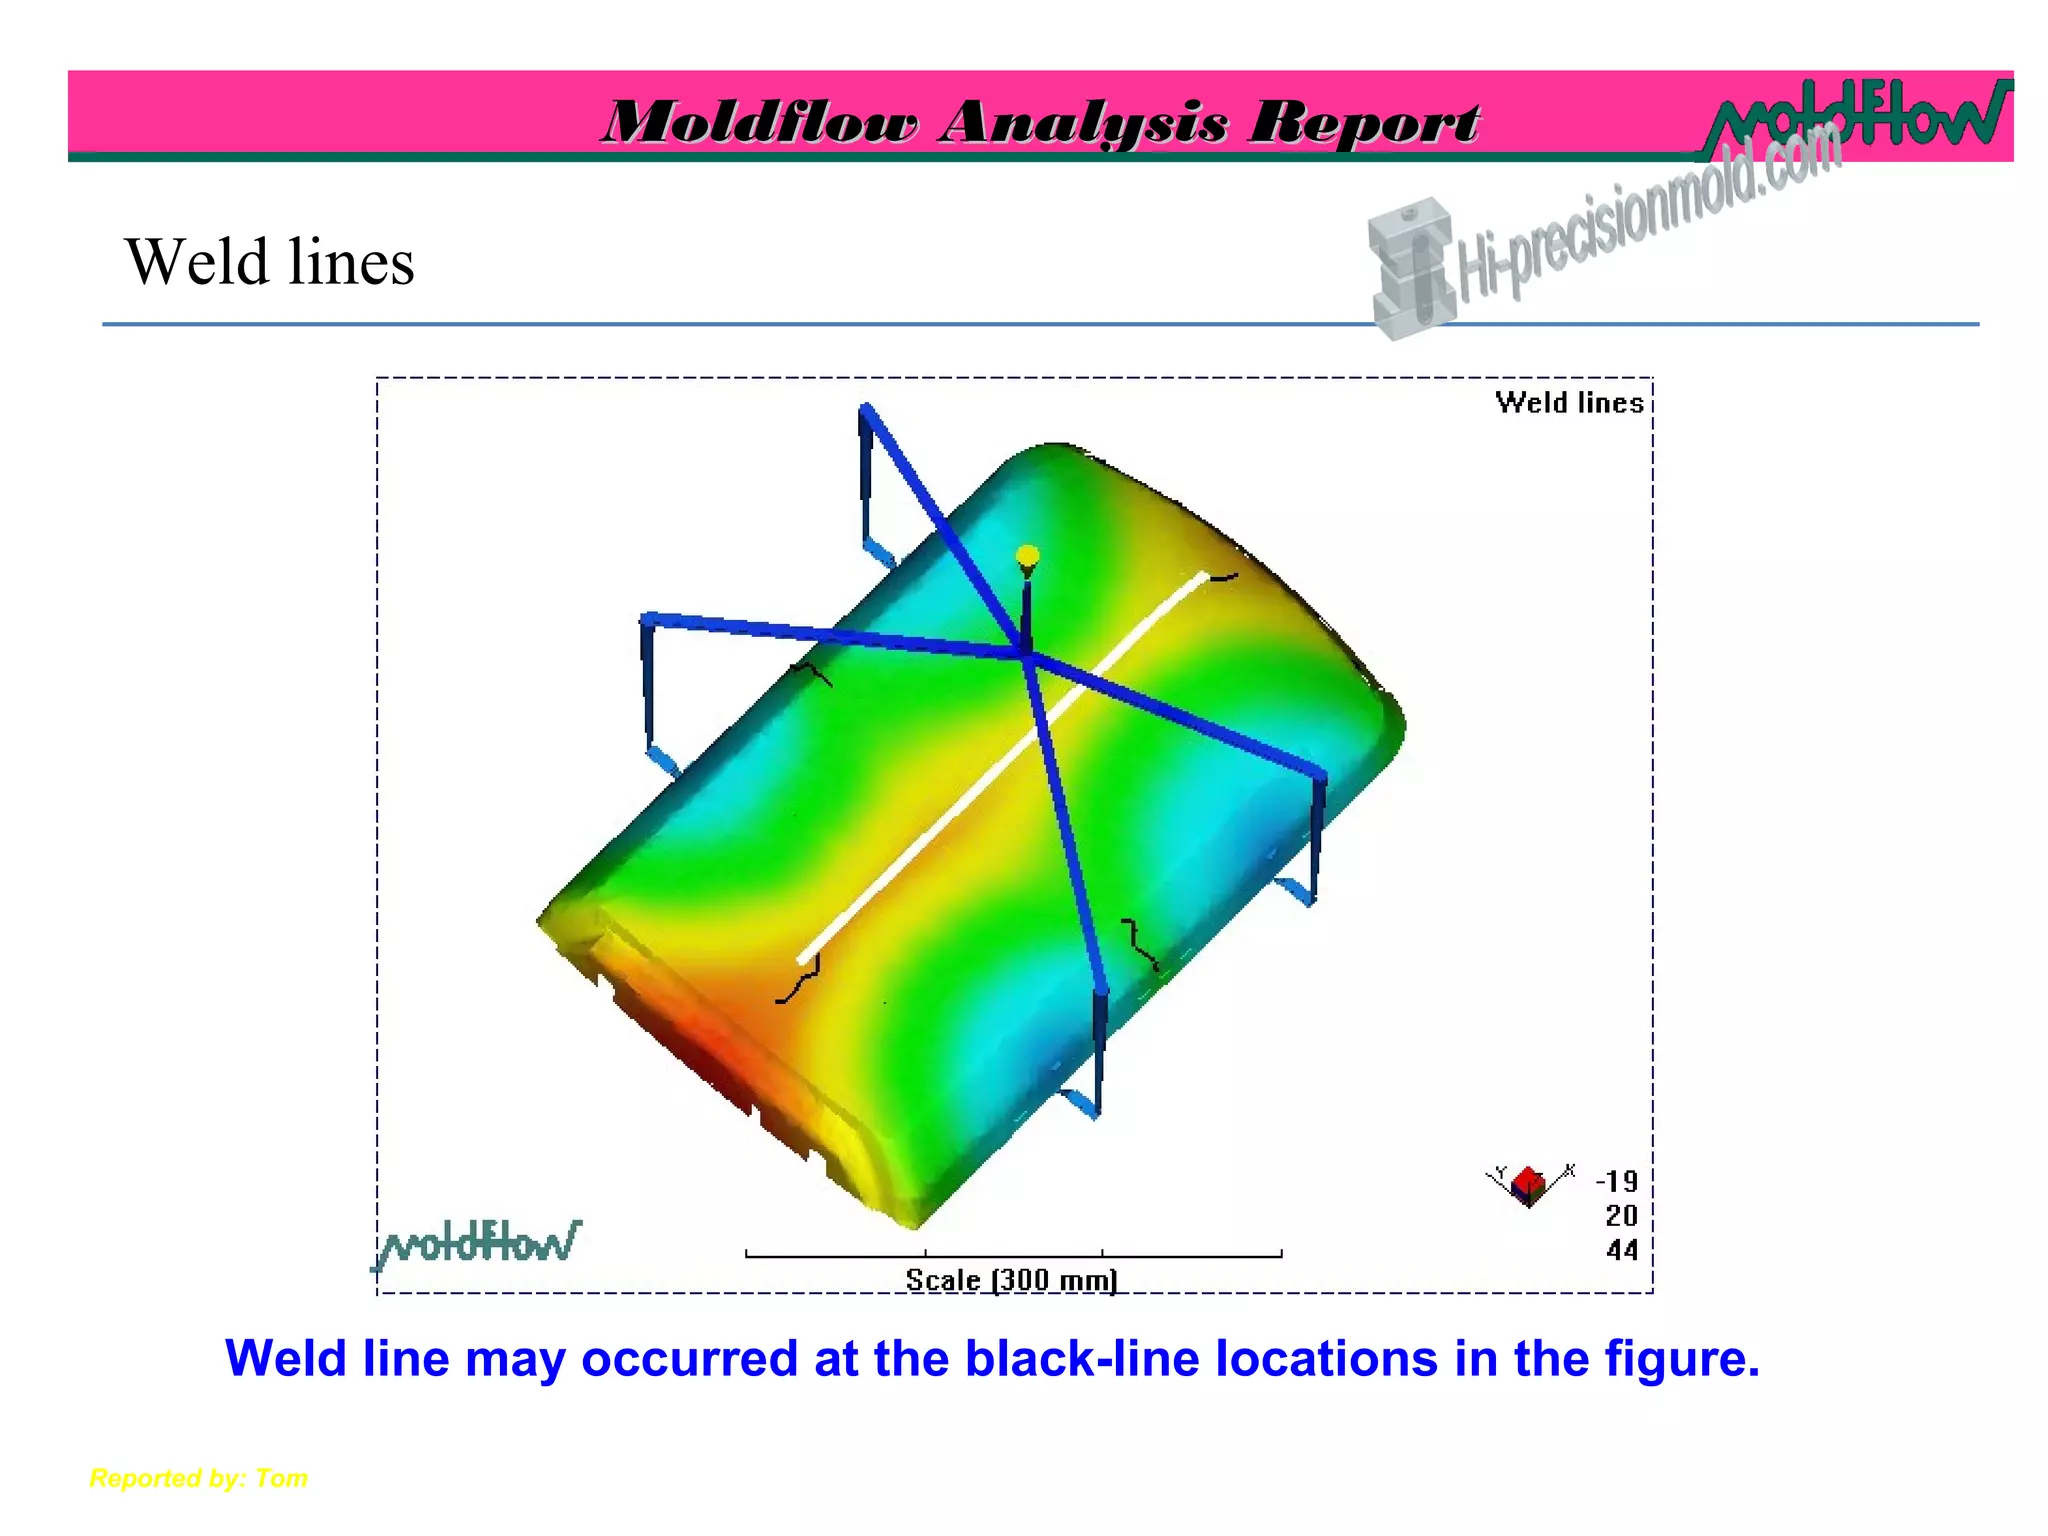
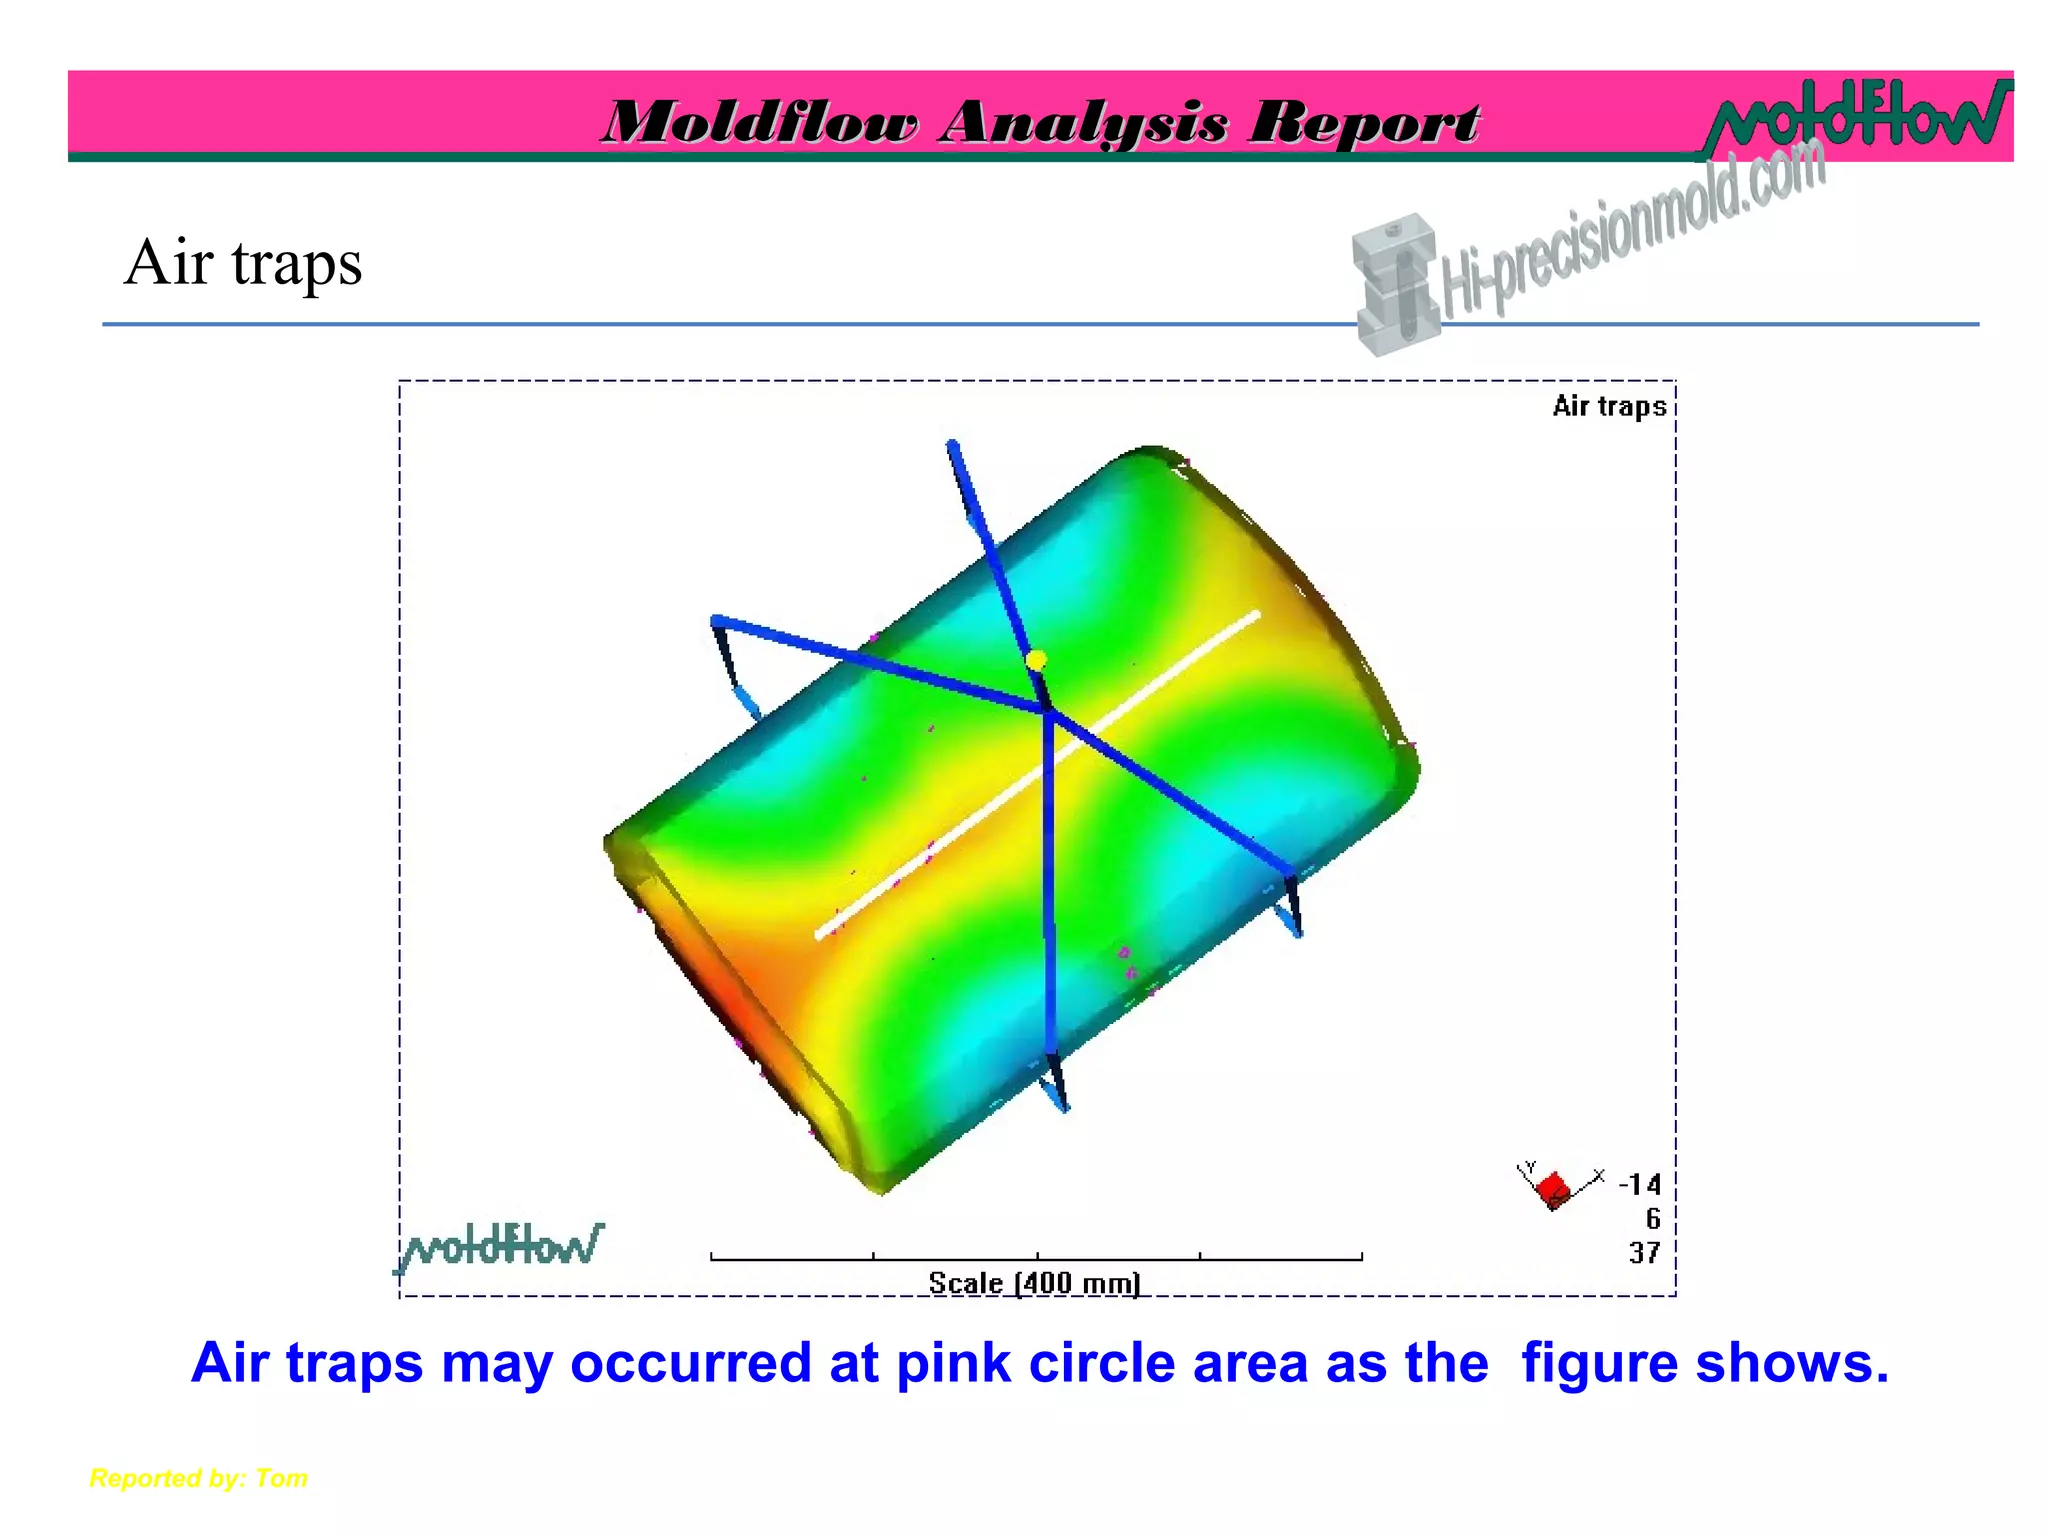
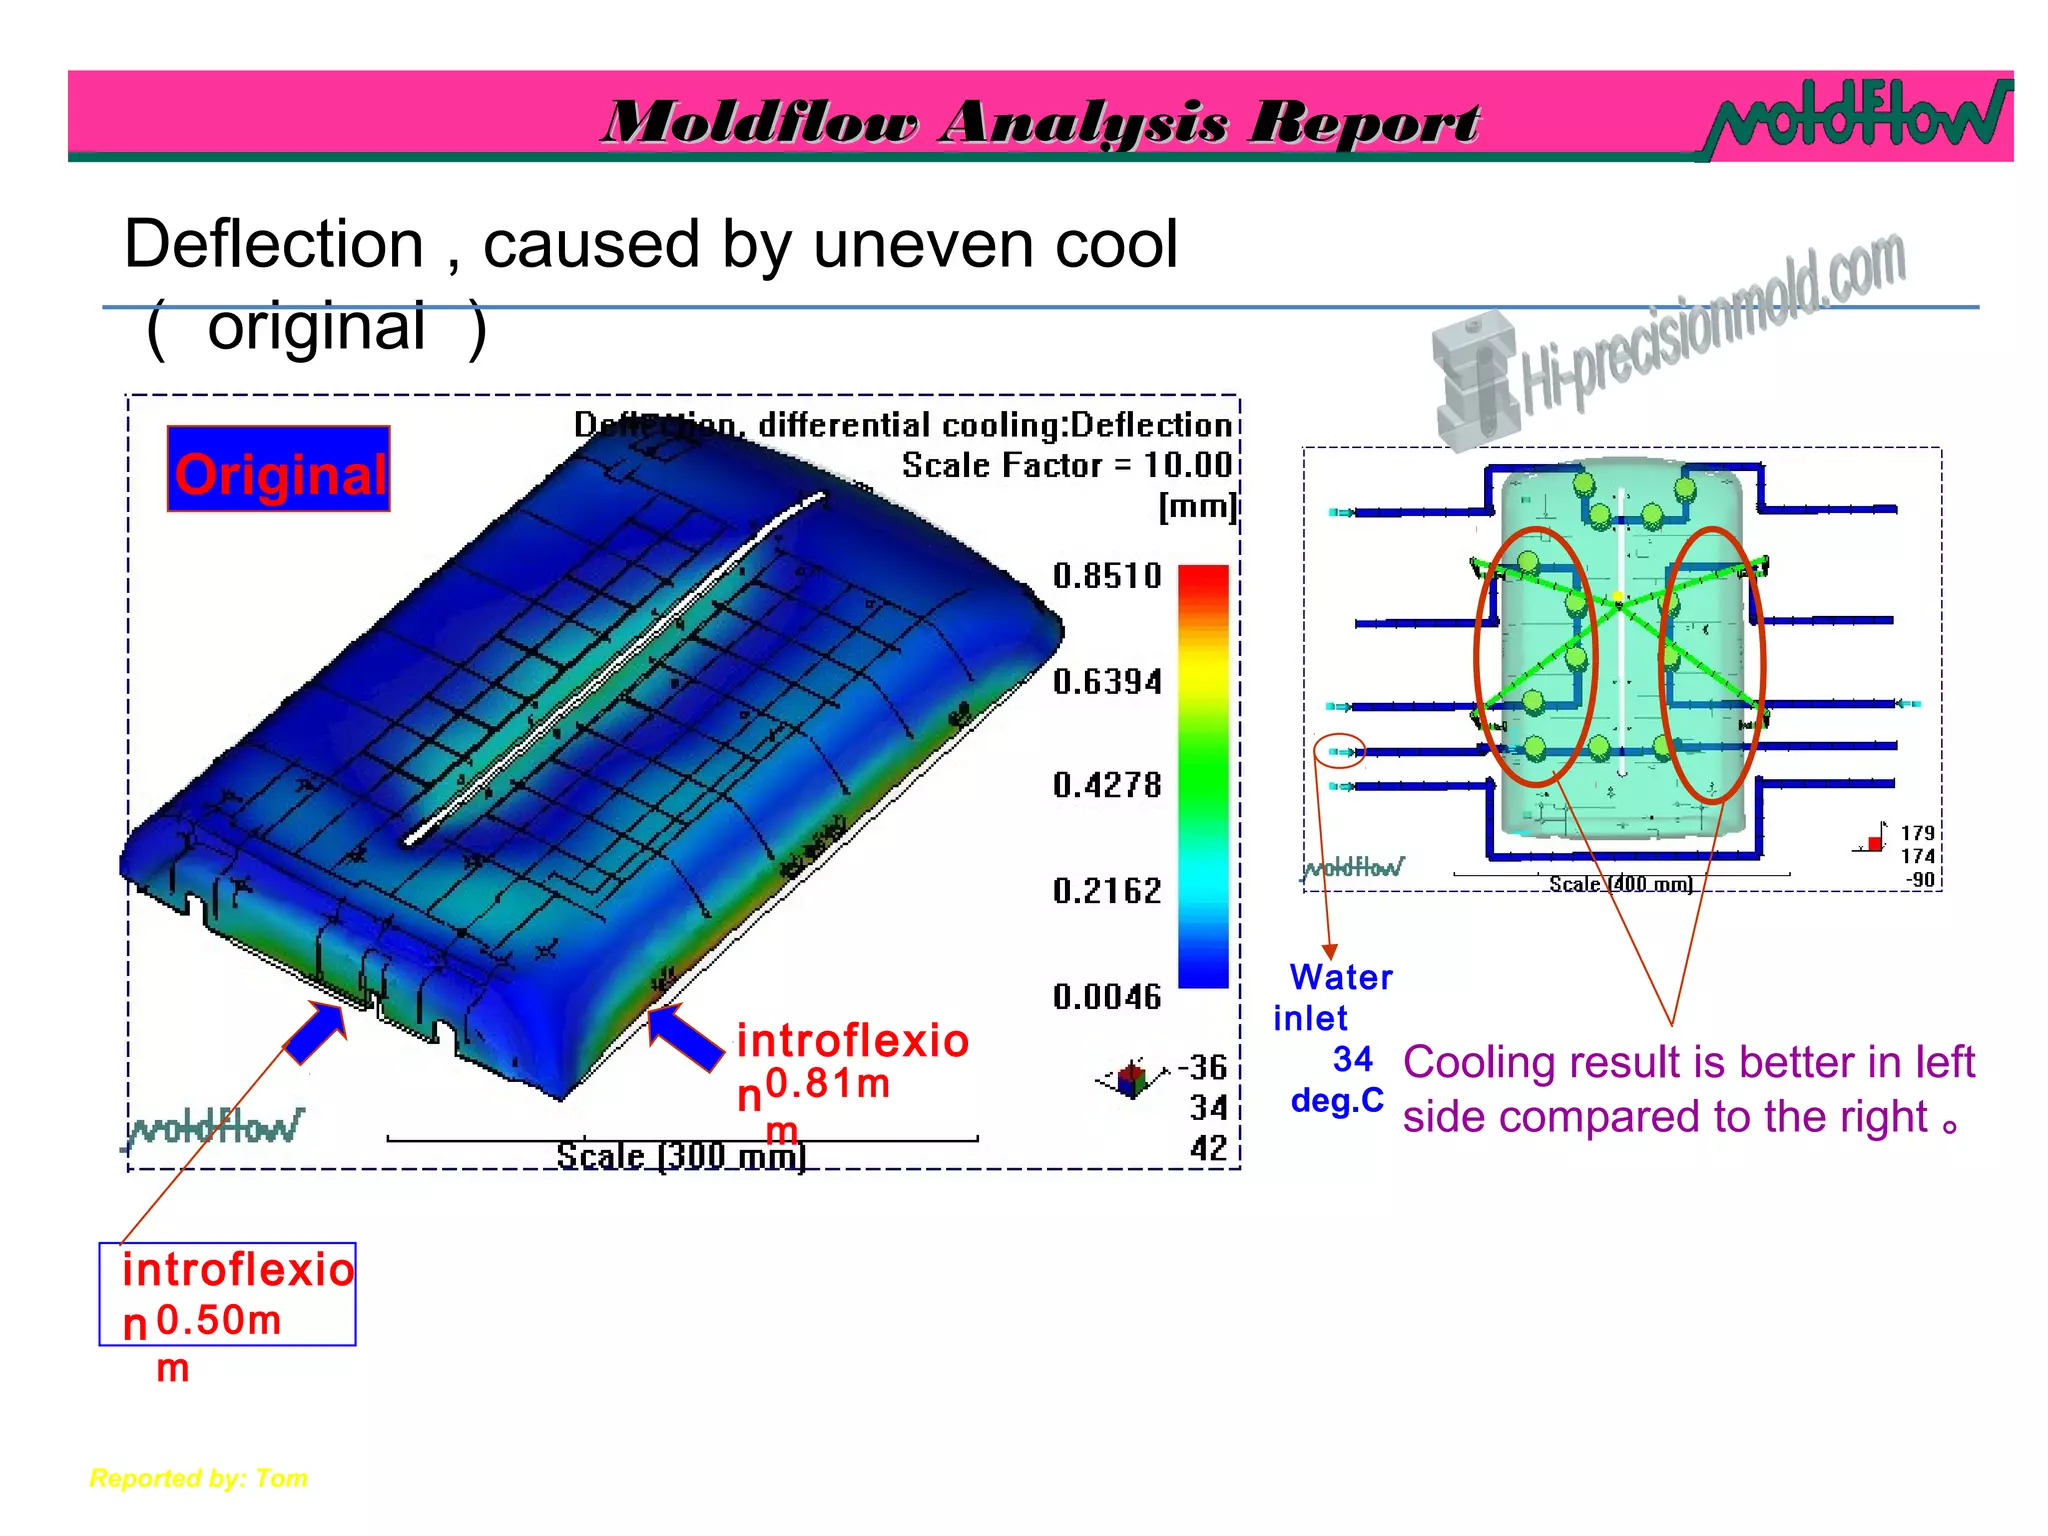
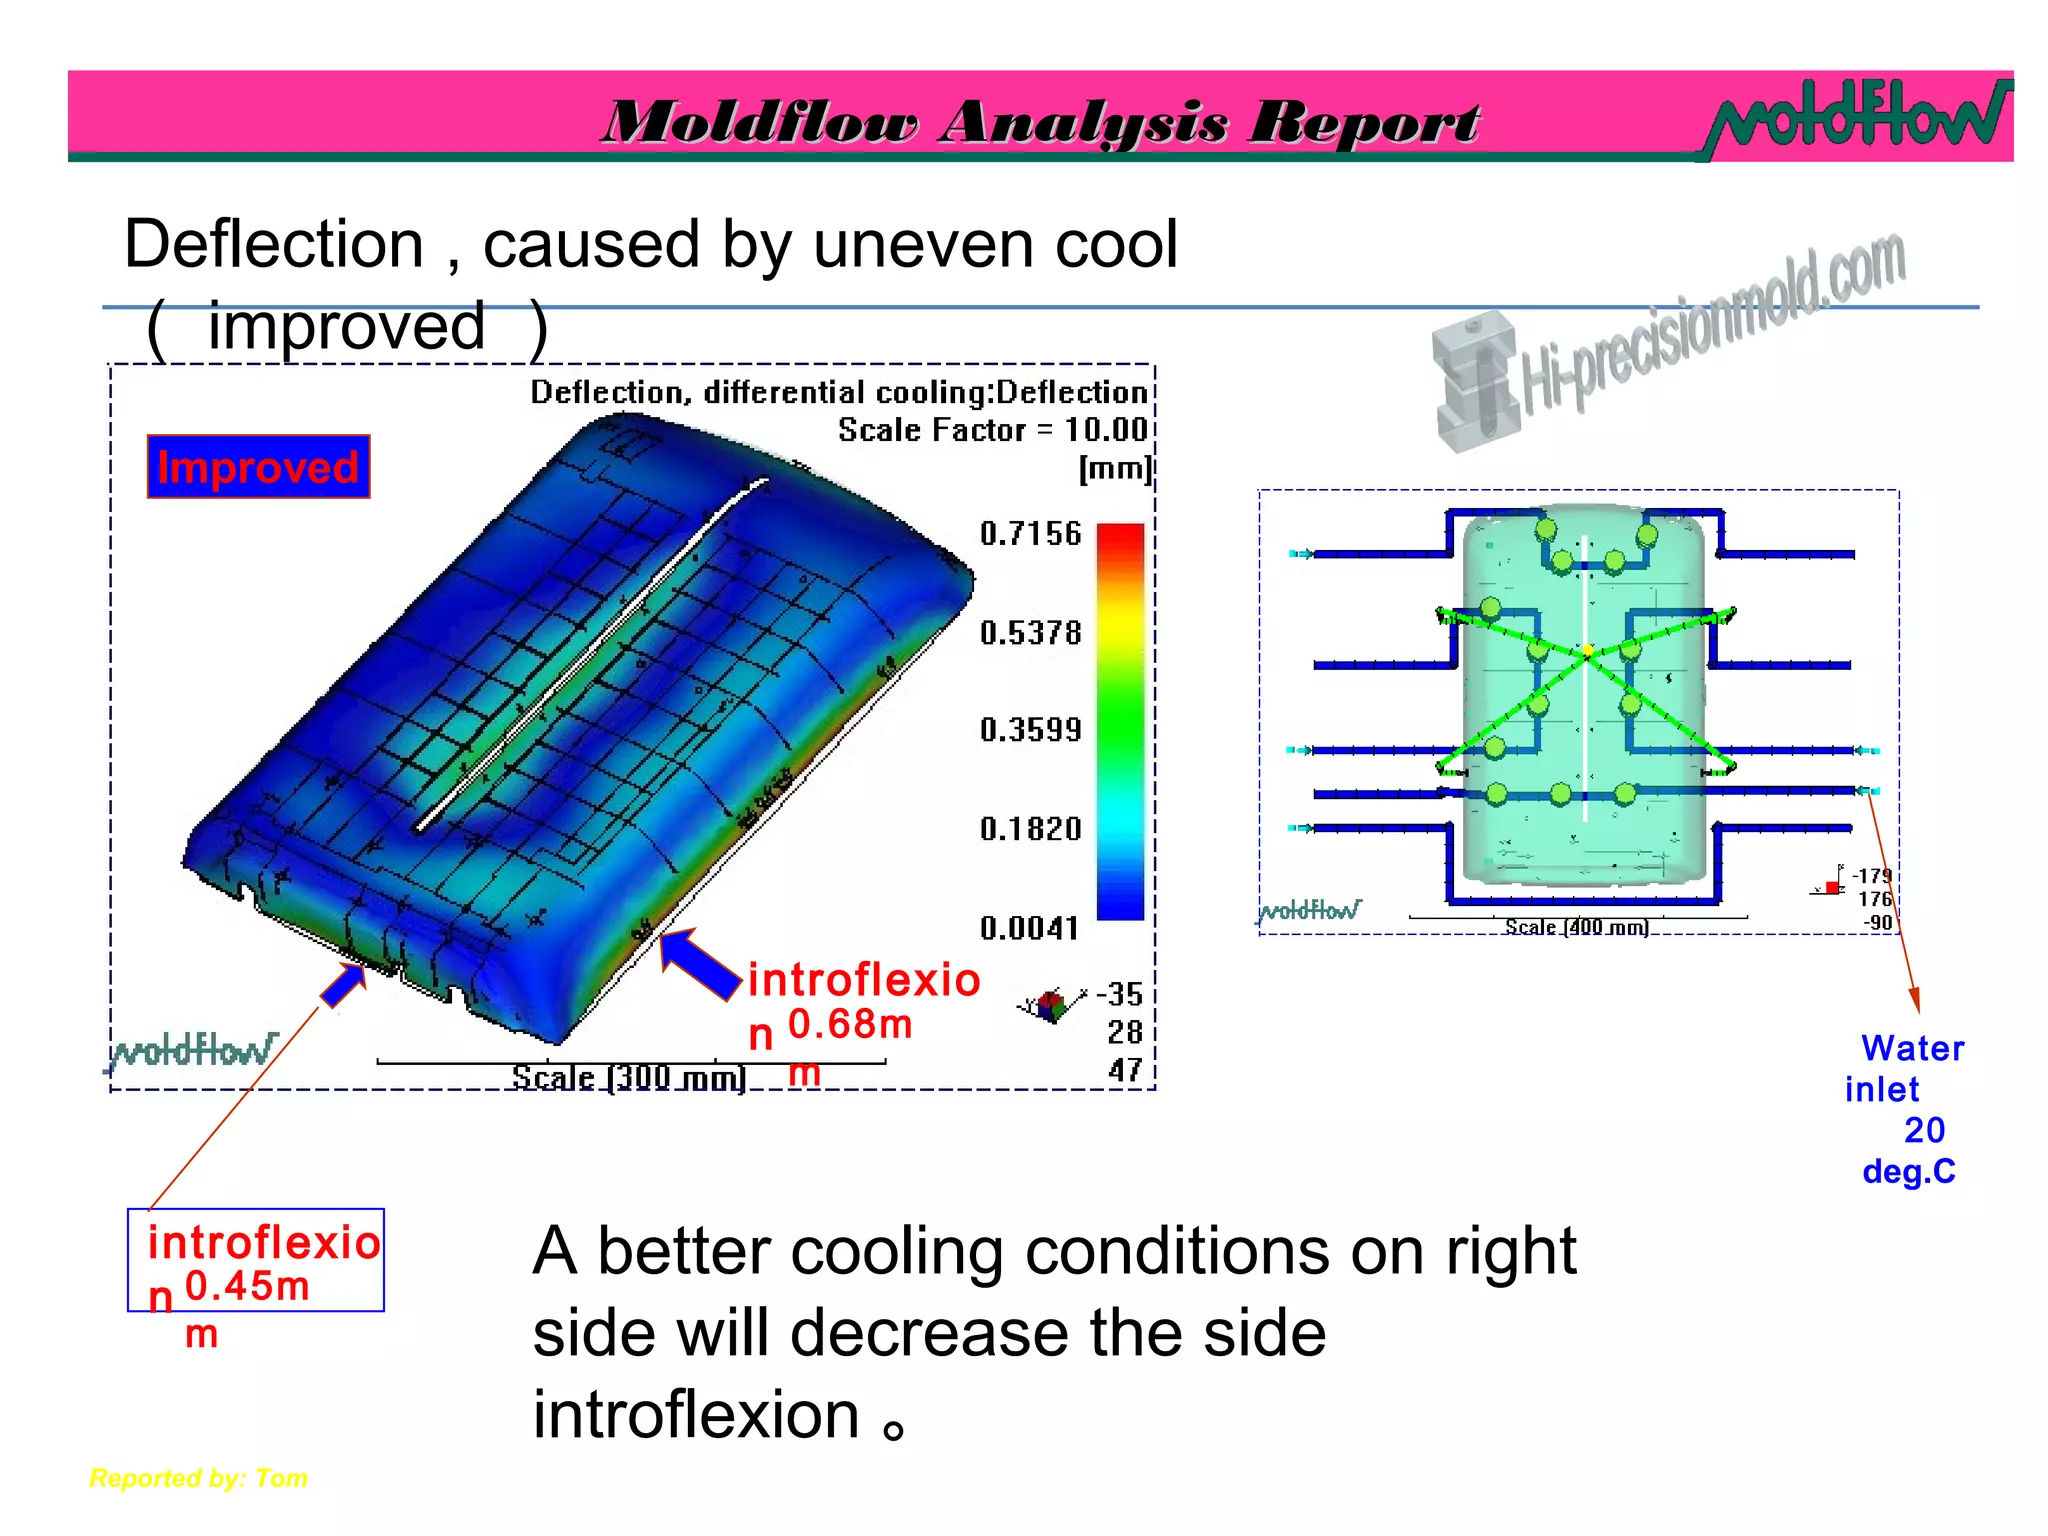
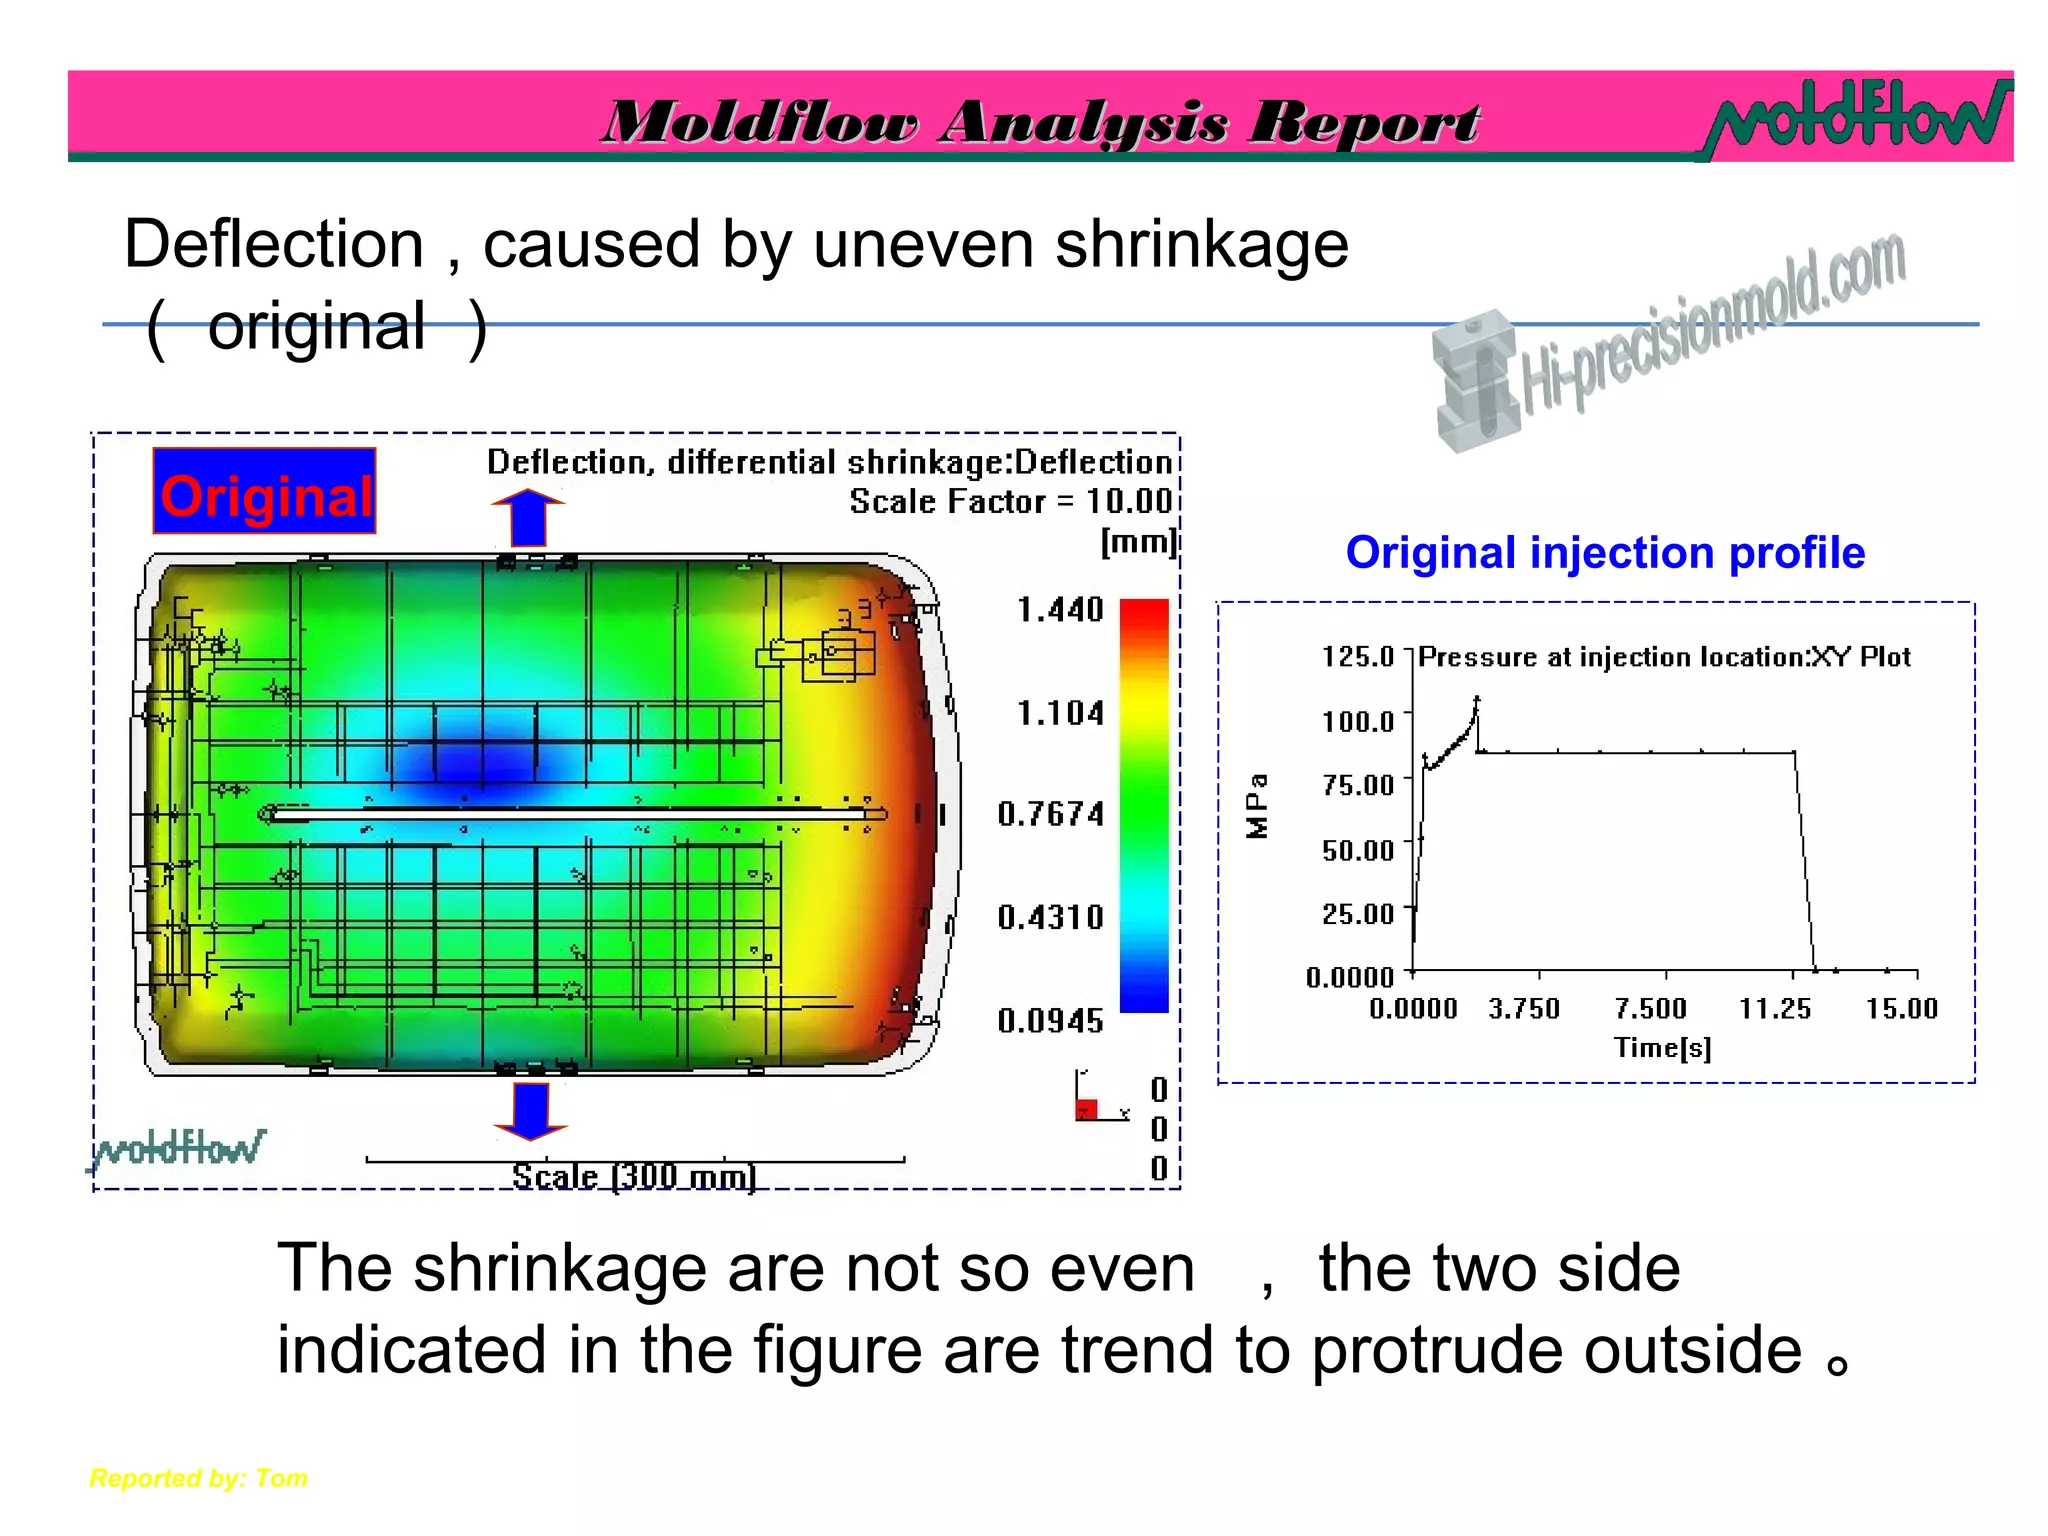
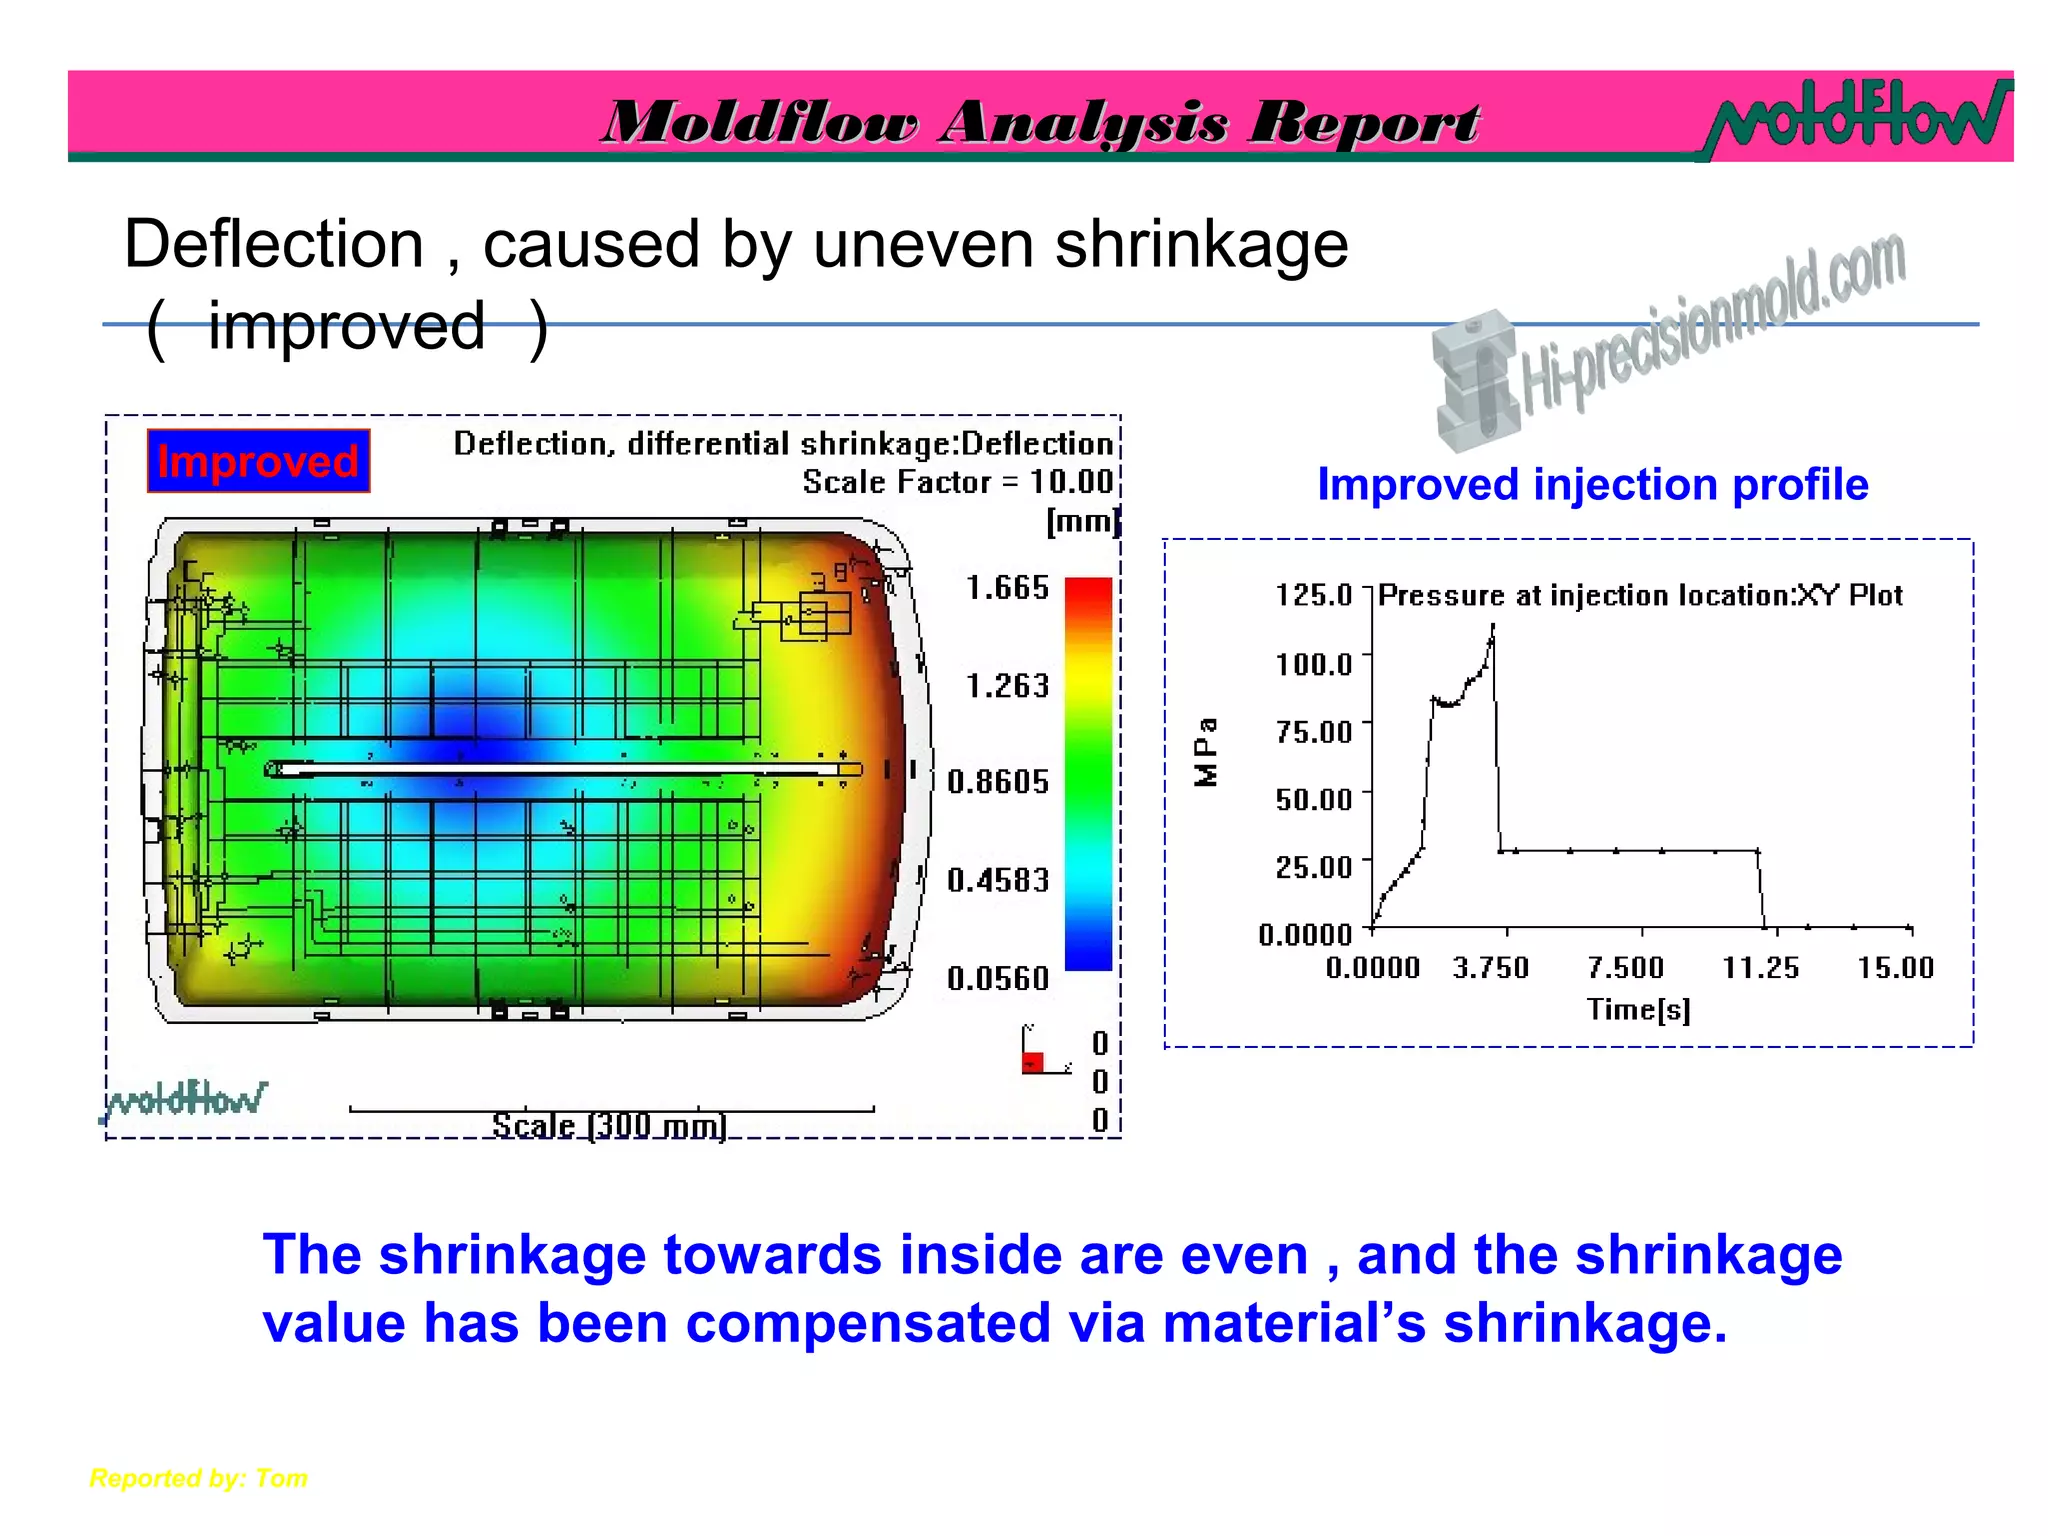


Tom analyzed the molding process for a housing part according to the customer's design. The analysis examined flow, cooling, warpage conditions and optimized the runner and cooling systems. It determined processing parameters, identified potential weld lines and air traps, evaluated warpage and sink marks, and provided recommendations to improve the design.


![Capitulo4 bombascentrifugas[1]](https://cdn.slidesharecdn.com/ss_thumbnails/capitulo4bombascentrifugas1-130125071837-phpapp02-thumbnail.jpg?width=640&height=640&fit=bounds)


![[Connect 系列活動] 歐洲矽谷─愛爾蘭蛻變大解密](https://cdn.slidesharecdn.com/ss_thumbnails/irelandforiottaiwantechmakersassociation-160831045724-thumbnail.jpg?width=640&height=640&fit=bounds)


