More Related Content
Similar to mohamadzade and bazrgar 2014
Similar to mohamadzade and bazrgar 2014 (20)
mohamadzade and bazrgar 2014
- 1. Indian Journal of Fundamental and Applied Life Sciences ISSN: 2231-6345 (Online)
An Open Access, Online International Journal Available at http://www.cibtech.org/jls.htm
2014 Vol. 4 (4) October-December, pp.203-212/Mohammadzade and Bazrgar
Research Article
© Copyright 2014 | Centre for Info Bio Technology (CIBTech) 203
ASSESSMENT OF SUSTAINABILITY INDICES IN MAIZE, BARLEY
AND WHEAT BASE ON NITROGEN DYNAMICS IN NEYSHABUR
Zahra Mohammadzade and *Amir Behzad Bazrgar
Department of Agronomy, Neyshabur Branch, Islamic Azad University, Neyshabur, Iran
*Author for Correspondence
ABSTRACT
The study was conducted to investigate the sustainability indices of maize, barley and wheat using a
simulation model at Neyshabur environmental condition. All production information of these crops
gathered and recorded during 2012 and 2013 growing seasons. Nitrogen losses simulated using
SUNDIAL model. Sustainability indices use efficiency and environmental impacts of each crop estimated
using N-Loss model. Results showed that the highest nitrogen loss during crop production belonged to
NH3volatilization and 73, 64 and 63 percent of nitrogen loss belonged to NH3 volatilization in maize,
barley and wheat respectively. The second nitrogen loss factor was leaching in maize (19%) and
denitrification in barley (25%) and wheat (26%). Total nitrogen loss in maize, barley and wheat was 48,
31 and 26 kg nitrogen per hectare, which showed the importance of better fertilization management in
order to enhance nitrogen use efficiency. Nitrogen loss to air and soil in maize production was lower than
barley and wheat. Results showed that barley and wheat had low nitrogen use efficiency and high
environmental impacts despite are sustainable in respect of soil nitrogen content.
Keywords: Environmental Impacts, Nitrogen Loss, Leaching, Denitrification, Sustainability Indices,
Sundial
INTRODUCTION
Food supply for enhancing world population is the most important challenge of humanity. The challenge
is more vital in unsuitable environmental conditions for crop production such as Iran drought and semi
drought regions. Population growth during last decades resulted in overconsumption of natural resources
especially in developing countries. Although this overconsumption resulted in more food production in
short term, but had vast environmental impacts. Add to these reduced harvested areas around the world
results in more industrial and intensive farming which has negative impacts on environment. Production
stability in drought environments is depended on preserving resources such as soil and water. Thus
enhancing agricultural and food production systems efficiency is necessary. Modern agro-ecosystems
most manage to produce high yield in short term and show sustainability in long term.
Currently in agro-ecosystems high yield usually gains by higher input consumption. Nitrogen is one of
the most important inputs in agriculture. Just a few more than 50% of total consumed nitrogen fertilizers
uses effectively in agricultural production and the rest scatters in environment and results in
environmental pollution (Galloway et al., 2008). Different shapes of nitrogen results in different
environmental negative impacts such as groundwater and soil acidification and eutrophication. Nitrogen
compounds involve in ozone, oxidants and smog formation and are potentially harmful for human health
(Bazrgar et al., 2012).
For understanding the agro-ecosystems it is necessary to simplifying them. A useful way is quantifying
system procedures in order to evaluate the system effectiveness. Thus it is necessary to quantify many
qualitative aspects of agro-ecosystem while sustainability is a concept and is not measurable. Selecting
proper indices is needed to evaluate the system sustainability. In fact each sustainability index is a
numerical value gained by gathering different sustainability scales. Using sustainability indices is the first
step in scheming a stable ecosystem. Such agro-ecosystems have low environmental impacts and stable
social and economic efficiency while producing a proper crop yield (Mahdavi et al., 2005). Various
indices proposed for evaluating agro-ecosystem sustainability, but just a few of them are enough fast and
simple in monitoring system. Researches show that proper sustainability indices are suitable for
- 2. Indian Journal of Fundamental and Applied Life Sciences ISSN: 2231-6345 (Online)
An Open Access, Online International Journal Available at http://www.cibtech.org/jls.htm
2014 Vol. 4 (4) October-December, pp.203-212/Mohammadzade and Bazrgar
Research Article
© Copyright 2014 | Centre for Info Bio Technology (CIBTech) 204
evaluating system interferences with environment (Agol et al., 2014). Nitrogen loss is a proper
sustainability index.
Fertilizer managers, biologists, ecologists and environment scientist interest in evaluating nitrogen
management and its environmental impacts (Delgado et al., 2008).
Measuring nitrogen loss is difficult thus many simulating models developed to evaluate it (Van et al.,
2014).
SUNDIAL simulation model had used in many researches and its accuracy had approved (Bradbury et al.,
1993; Gabrielle et al., 2002; Smith et al., 2003; Gibbons et al., 2005).
SUNDIAL had used by 250 researchers around the world (RRES, 2011). Tzilivakis et al., (2005) applied
the SUNDIAL to simulate nitrogen loss ad its environmental impacts at sugar beet fields.
Bazrgar et al., (2012) used the model to evaluate nitrogen loss in sugar beet areas of Khorasan-Razavi-
Iran.
Gibbons et al., (2005) applied the model to improve fertilizer management and decrease nitrate loss
among the fields. Fallon et al., (1999) used the SUNDIAL model to simulate nitrogen cycle among the
traditional faming systems.
The present study compared production sustainability of maize, barley and wheat base on nitrogen
dynamics using SUNDIAL simulating model and provide proper ways for stable production.
MATERIALS AND METHODS
Neyshabur is located at 110 km of Mashhad south-west with a latitude between 35° 40ʹ and 36° 50 ʹ E and
a longitude between 58° 15 ʹ and 59° 15 N ʹ and 1230 m altitude.
The average temperature of Neyshabur is 15.5 °C with 253 mm yearly precipitation. A survey research
performed during 2012-2013 growing season at rural regions around Neyshabur.
For maize, barley and wheat, 9, 15 and 13 fields chose randomly. All agronomic information of the fields
inquired from famers and field managers by face to face interviews.
The field information presents at table 1. Collected data arranged using Excel software. SUNDIAL
software applied to simulate nitrogen loss (Smith et al., 1996).
Environmental impacts and nitrogen balance evaluate using N-loss model (Bazrgar et al., 2012). Analysis
of variance calculated using SAS. Comparison between means performed using LSD test if F-test was
significant. Production sustainability of maize, barley and wheat evaluated using sustainability index,
impact index and efficiency index (Scholefield and Smith, 1996; Fallon et al., 1999; Smith et al., 1998):
Sustainability Index (S.I.) = Total N input / (N removed in product + other losses)
Efficiency Index (ELI.) = N in product / N input as fertilizer Environmental
Impact Index (Env.I.) = Total N losses / N in product
- 3. Indian Journal of Fundamental and Applied Life Sciences ISSN: 2231-6345 (Online)
An Open Access, Online International Journal Available at http://www.cibtech.org/jls.htm
2014 Vol. 4 (4) October-December, pp.203-212/Mohammadzade and Bazrgar
Research Article
© Copyright 2014 | Centre for Info Bio Technology (CIBTech) 205
Table 1: Maize, barley and wheat filed management information in Neyshabur
Management Barley Wheat Maize
planted varieties
Bahman
Valfajr
Yousef
Abidar
Reyhan
Alvand
Sayons
Gascogen
Omid
Pishtaz
Falat
Farsian
Jovein
Moghan
Planting date
Oct
12th
Oct
29th
Nov
21th
Dec
11th
Dec
21th
Oct
22th Oct 23th
Oct 30th Nov
28th
Nov
16th Apr 27th
Jun 10th
Harvesting date
Jun
10th
Jun
18th
Jun
12th
Jun
7th
Jun
17th
Jul
4th Jun 22th
Jun 23th Jun
18th
Jun
26th Sep 16th
Oct 20th
Manure (ton/ha) 0 1.5 Max 11
Ammonium phosphate (kg
N/ha)
25.47 27 25.5
Urea (kg N/ha) 24.53 32.87 46
Time and rate of
split application of
nitrogen (kg N/ha)
min One time- 70.95 One time- 69 Three times- 69
max Three times- 33.07 Three times- 33.66 Twelve times-15.34
Foliar fertilization kg N/ha 2.65 0.76 2.01
Total N application (kg N/ha) 112.86 128.47 171.28
Total water input (m3
/ ha) 500.2 651.8 1074.7
Soil texture Loam sandy Loam
Loam, loam sandy,
loam clay (with
adequate amounts)
- 4. Indian Journal of Fundamental and Applied Life Sciences ISSN: 2231-6345 (Online)
An Open Access, Online International Journal Available at http://www.cibtech.org/jls.htm
2014 Vol. 4 (4) October-December, pp.203-212/Mohammadzade and Bazrgar
Research Article
© Copyright 2014 | Centre for Info Bio Technology (CIBTech) 206
RESULTS AND DISCUSSION
Nitrogen Loss per Unit of Harvested Area of Maize, Barley and Wheat
Analysis of variance of nitrogen dynamic simulation showed at table 2. The amount of nitrogen
absorption by maize, barley and wheat was 181.2, 79.1 and 92.2 kg N/ha respectively.
Hu et al., (2008) reported that maize could absorb 290 to 295 kg N/ ha and thus is proper nitrogen
storage.
There was a significant difference between maize, barley and wheat in respect of total nitrogen loss
(p<0.01) (table 2). The highest and lowest nitrogen loss belonged to maize (48.1 kg N/ha) and wheat
(23.3 kg N/ha) respectively (figure 1).
Gaseous nitrogen loss was significantly different between studied crops (p<0.01) (table 2). Most of
gaseous loss occurred through NH3 volatilization.
There was significant difference between crops in respect of volatilization rate (table 2). The highest
volatilization amount belonged to maize (35.4 kg N/ha) (figure 1).
It seems that higher rate of fertilizer application in maize production resulted in higher nitrogen loss and
volatilization rate per unit of harvested area in maize compare with barley and wheat. Denitrification rate
was less in maize (3.3 kg N/ha) compare with barley (6.8 kg N/ha) and wheat (7.7 kg N/ha) but the
difference was not significant (table 3).
The rate of denitrification was less than NH3 volatilization in the studied crops (figure 1). Soltani et al.,
(2013) reported 0.09 to 1.44 kg N/ha gaseous loss of nitrogen in different studies.
Linear relation between nitrogen rate and NH3 vitalization presents at figure 2. There was significant
correlation between nitrogen rate and NH3 volatilization (R2=0.79). Higher nitrogen fertilization
application was more correlated with NH3 volatilization rather than denitrification.
Jones and Jacobsen (2005), Brentrup et al., (2001) and Bazrgar et al., (2012) reported that applying
nitrogen fertilizers especially urea results in higher NH3 volatilization due to enhancing pH of soil.
Mixing N-fertilizers with soil, splitting application of N-fertilizers in calm weather and enhancing top
dressing times resulted in lower gaseous loss of nitrogen particularly NH3 volatilization (Soltani et al.,
2010; Bazrgar et al., 2012).
Amount of nitrogen loss through leaching was 9.3, 4.1 and 2.3 kg N for maize, barley and wheat
respectively (table 3).
This may be the result of filed management, amount of top dressed urea, irrigation method and amount
and planting date. In barley and wheat long growing season resulted in higher nitrogen leaching. Gibbons
et al., (2005) reported that nitrogen leaching affected by planting date and planting method.
Applying lower amount of nitrogen fertilizer in irrigation water, foliar fertilization, and mechanized
irrigation methods resulted in lower nitrogen leaching in wheat production while higher amount of top
dressing urea, high amount of irrigation water, and applying higher amount of nitrogen in irrigation water
resulted in higher leaching rate in maize production.
- 5. Indian Journal of Fundamental and Applied Life Sciences ISSN: 2231-6345 (Online)
An Open Access, Online International Journal Available at http://www.cibtech.org/jls.htm
2014 Vol. 4 (4) October-December, pp.203-212/Mohammadzade and Bazrgar
Research Article
© Copyright 2014 | Centre for Info Bio Technology (CIBTech) 207
Table 2: Source of variation, degree of freedom and mean of squares for measured traits
Sou
rce
of
vari
atio
n
Deg
ree
of
free
dom
N
absorp
tion by
plant
Gaseou
s N loss
(denitr
ificatio
n and
volatili
zation)
Total
N loss
Leachi
ng
Denitrif
ication
NH3
volati
lizati
on
NOx
loss
NO2los
s
NOx
loss/
1000
kg of
produc
tion
N2O
loss/
1000
kg of
produc
tion
Leachi
ng
loss/
1000
kg of
produc
tion
Gaseo
us loss/
1000
kg of
produc
tion
Total N
loss/ 1000
kg of
productio
n
Trea
tme
nt
2
**
32032.
2
*
662.85
4
**
1401.9
0
**
136.79
7
56.434
**
1053.
46
*
0.101 *
2.281
**
0.0136
**
0.28 2.207
**
105.36
1
**
136.393
Erro
r
34 1884.3
224.43
3
331.91 29.521 151.724
102.0
9
0.0299 0.674
0.0008
9
0.2232 1.811 18.499 27.505
Tota
l
36 - - - - - - - -
- -
- - -
* and ** significant at 5 and 1 probability levels respectively
Table 3: Comparison between means of measured traits
Treat
ment
N
absor
ption
by
plant
Gaseo
us N
loss
(denitr
ificatio
n and
volatili
zation)
Total
N loss
Leach
ing
Denitri
ficatio
n
NH3
volatili
zation
NOx
loss
NO2 loss
NOx
loss/
1000 kg
of
product
ion
N2O
loss/
1000 kg
of
product
ion
Leachin
g loss/
1000 kg
of
product
ion
Gaseous
loss/
1000 kg
of
product
ion
Total N
loss/ 1000
kg of
productio
n
Maiz
e
181.2
2a
38.778
a
48.111
a
9.333a 3.33a
35.444
a
0.479a 2.275a 0.0075b 0.038b 0.1588a 0.696 0.855b
Barle
y
79.06
7b
27.2ab
31.267
b
4.066b 7.733a
19.467
b
0.302b 1.44b 0.0719a 0.137a 1.0436a 6.577a 7.62a
Whea
t
92.23
1b
b308/
23
25.615
b
2.307b 6.769a
16.538
b
0.3116b 1.478b 0.0696a 0.333a 0.674a 5.756a 6.4309a
There was no significant difference between means with the same letters in each column
- 6. Indian Journal of Fundamental and Applied Life Sciences ISSN: 2231-6345 (Online)
An Open Access, Online International Journal Available at http://www.cibtech.org/jls.htm
2014 Vol. 4 (4) October-December, pp.203-212/Mohammadzade and Bazrgar
Research Article
© Copyright 2014 | Centre for Info Bio Technology (CIBTech) 208
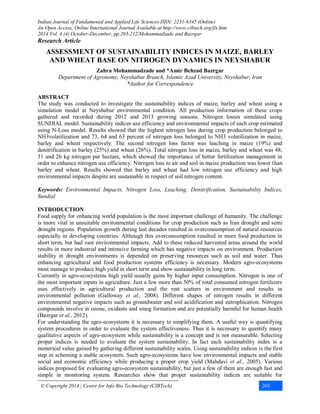
Figure 1: Comparison between maize, barley and wheat in respect of nitrogen loss per production
area
Figure 2: Relation between nitrogen application rate and NH3 volatilization in maize, barley and
wheat
Nitrogen Loss per Production Unit of Maize, Barley and Wheat
Results showed that there was significant difference between production of 1000 kg of maize, barley and
wheat in respect of gaseous loss. There was no significant difference between per production unit of
studied crops in respect of leaching amount (table 2). Mean nitrogen loss through maize production was
significantly less than barley and wheat. Nitrogen loss per 1000 kg production of maize, barley and wheat
were 0.85, 7.6 and 6.4 kg respectively.
Nitrogen loss to air and water was 0.69 and 0.16 kg per 1000 kg of maize production. There was no
significant difference between barley and wheat in respect of nitrogen loss to air and water (table 3). The
amount of nitrogen loss to air was higher than those of water. Nitrogen loss per unit of area was higher in
maize compare with barley and wheat.
maize barley wheat
Denitrification 3.33 7.733 6.769
Leaching 9.333 4.066 2.307
NH3 volatilization 35.444 19.467 16.538
Total N loss 48.111 31.267 25.615
0
20
40
60
80
100
120
y = 0.190x - 1.503
R² = 0.790
0
20
40
60
80
100
0 100 200 300 400
NH3volatilization(kgN/h)
Nitrogen fertilizer (kg N/ha)v
- 7. Indian Journal of Fundamental and Applied Life Sciences ISSN: 2231-6345 (Online)
An Open Access, Online International Journal Available at http://www.cibtech.org/jls.htm
2014 Vol. 4 (4) October-December, pp.203-212/Mohammadzade and Bazrgar
Research Article
© Copyright 2014 | Centre for Info Bio Technology (CIBTech) 209
But applying yield weight as scale showed that nitrogen loss was lower during 1000 kg production of
maize rather than barley and wheat (figure 3). Thus all shapes of nitrogen loss were less during maize
production compare with barley and wheat, in respect of yield production.
Figure 3: Comparison between maize, barley and wheat in respect of nitrogen loss per production
unit
Nitrogen Greenhouse Gas Emission of Maize, Barley and Wheat
There was significant difference between maize, barley and wheat in respect of NO2 and NOx emission
per harvested area (p<0.05) and per production unit (p<0.01) (table 2). 0.48, 0.3 and 0.32 kg N/ha
nitrogen lost through NOx formaize, barley and wheat respectively. 2.75, 1.4 and 1.48 kg N/ha lost as NO2
for maize, barley and wheat respectively (table 3). 0.04, 0.31 and 0.33 kg nitrogen lost through NO2
through production of each unit of maize, barley and wheat respectively. 0.007, 0.07 and 0.04 kg nitrogen
lost as NOx for each unit of maize, barley and wheat production respectively. NOx and NO2 loss was less
in maize production compere with barley and wheat (figure 4).
The impact of NOx and NO2 emission of global warming is 310 folds more than CO2. Nemecek and
Kagi (2007) reported that nitrogen loss through NO2 is related to agricultural nitrogen cycle and intensive
agro-ecosystems results in higher NO2 emission.
Studied maize production systems in Neyshabur were intensive and resulted in high NO2 emission (figure
4).
Figure 4: Nitrogen greenhouse gass emission during maize, barley and wheat production
a
b ba
a
a
a
a
a
0
1
2
3
4
5
6
7
8
9
Leachingloss Gaseous loss Total N loss
Nloss(kgN/ton)
maize
barley
wheat
b
b
a
a
a
a
0
0.05
0.1
0.15
0.2
0.25
0.3
0.35
NOx N2O
emission(KgN/h)
maize
barley
wheat
a
a
b
b
b
b
0
0.5
1
1.5
2
2.5
NOx NO2
emission(KgN/ton)
maize
barley
wheat
- 8. Indian Journal of Fundamental and Applied Life Sciences ISSN: 2231-6345 (Online)
An Open Access, Online International Journal Available at http://www.cibtech.org/jls.htm
2014 Vol. 4 (4) October-December, pp.203-212/Mohammadzade and Bazrgar
Research Article
© Copyright 2014 | Centre for Info Bio Technology (CIBTech) 210
Environmental Indices of Maize, Barley and Wheat
There was significant between maize, barley and wheat in respect of sustainability index and efficiency
index. But there was no significant difference between them in respect of impact index (table 4).
Sustainability index for maize (0.88) was significantly lower than barley (1.23) and wheat (1.21). but
therewas no significant difference between barley and wheat in respect of sustainability index. Total
nitrogen input was higher in maize production and nitrogen absorption and loss was higher in maize
production too.
Table 4: Mean comparision of sustainability index, efficiency index and impact index in maize,
barley and wheat
Treatment Sustainability index Efficiency index Impact index
Maize 0.8865b 1.1153a 0.2693a
Barley 1.2306a 0.7748b 0.4233a
Wheat 1.21083a 0.8726ab 0.3416a
There was no significant difference between means with the same letters in each column
Table 5: Source of variation, degree of freedom and mean of squares for measured traits
Source of
variation
Degree of
freedom
Sustainability
index
Efficiency index Impact index
Treatment 2 *
0.38110 *
0.32989 0.06911ns
Error 34 0.11072 0.09332 0.08005
Total 36 - - -
* and ** significant at 5 and 1 probability levels respectively
Figure 6: Sustainability, efficiency and impact indices in maize, balrey and wheat
Sustainability index lower than one shows unsustainability of agro-ecosystem. Base on the results maize
production was an unsustainable agro-ecosystem in Neyshabur while barley and wheat productoin was
stable. There was significant difference between maize and barley in respect of efficiency index.
a
a
b
a
b
a
a
ab
a
0
0.2
0.4
0.6
0.8
1
1.2
1.4
Env.I. Ef.I. S.I.
maize
barley
wheat
- 9. Indian Journal of Fundamental and Applied Life Sciences ISSN: 2231-6345 (Online)
An Open Access, Online International Journal Available at http://www.cibtech.org/jls.htm
2014 Vol. 4 (4) October-December, pp.203-212/Mohammadzade and Bazrgar
Research Article
© Copyright 2014 | Centre for Info Bio Technology (CIBTech) 211
Efficiency index of wheat was not significantly different whit maize and barley. Higher percent of total
applied nitrogen abrobed by maize rather than barley and wheat, thus the efficieny indexwas higher for
maize rather than two other crops. Thus maize production in Neyshabur had high efficieny in respect of
nitrogen. Nitrogen application in barley and wheat washigher than crop need. There was no significant
diffeence between studied crops in respect of impact index (figure 6). Impact index was 0.27, 0.42 and
0.34 for maize, balrey and wheat respectively. Impact index was higher for barley and wheat which
showed higher destructive potantial of these two agro-ecosystems in Neyshabur. Fallon et al., (1999)
reported that low input agro-ecosystems of maize with application of organic and inorganic fertilizers
show high sustainability and low environment impact in Nepal.
Conclusion
Comparing the results of SUNDIAL simulating model with the results of other researches showed that
SUNDIAL was approprite in simulating nitrogen loss through crop production in Neyshabur. The highest
nitrogen loss in maize (73%), barley (64%) and wheat (62%) occurred through NH3 volatilization. The
second nitrogen loss factor was leaching in maize (19%) and denitrification in barley (25%) and wheat
(26%). The third nitrogen loss factor in barley and wheat was leaching with 13 and 9% of total nitrogen
loss respectively. Thus it is important to manage nitrogen application in maize, barley and wheat.
Applying fertilizers with lower gaseous emission potential, applying accurate top dressing methods (blend
the fertilizer with soil), select the proper time and environmental conditions for applying N-fertilizer (low
temperature and calm weather) are some managing instructions for better nitrogen application. Results
showed that 2.75 and 0.48 kg N/ha of NOx and NO2 produced per 1000 kg of maize production. Each
unit of maize production released 0.03 and 0.0007 kg N as greenhouse gas to the air. There was
significant difference between maize, barley and wheat in respect of total nitrogen loss and nitrogen loss
to air. But there was no significant difference between studied crops in respect of nitrogen loss to water.
Total nitrogen loss and nitrogen loss to air was lower than barley and with due to higher yield of maize
compare with barley and wheat. Investigating environmental impact indices showed that barley and wheat
production is sustainable in respect of soil nitrogen, but these agro-ecosystems showed low efficiency and
high environment impact.
Suggestions
Nitrogen loss is not limited to field production. A high amount of nitrogen loss occurs after harvest and
during production procedure. Evaluating after harvest nitrogen loss is recommended for future studies. No
environmental standards suggested for Iran agro-ecosystems. Thus it is necessary to investigate managing
methods for all crops in each location and preparing environmental standards for each crop.
REFERENCES
Agol D, Latawiec AE and Strassburg BN (2014). Evaluating impacts of development and conservation
projects using sustainability indicators: Opportunities and challenges. Environmental Impact Assessment
Review 48 1-9.
Bazrgar AB, Soltani A, koocheki A, Zeinali E and Ghaemi A (2012). Environmental Assessment of
Khorassan Sugar Beet Production Systems using LCA, PhD Dissertation. Gorgan university of
Agricultural and Natural resources (GUASNR Press).
Bradbury NJ, Whitmore AP, Hart PBS and Jenkinson DS (1993). Modeling the fate of nitrogen in
crop and soil in the years following application of 15N-labelled fertilizer to winter wheat. Journal of
Agricultural Science 121 363 -379.
Brentrup F, Sters JKU, Kuhlmann H and Lammel J (2001). Application of the Life Cycle Assessment
methodology to agricultural production: an example of sugar beet production with different forms of
nitrogen fertilizers. European Journal of Agronomy 14 221–233.
Delgado JA, Shaffer M, Hu C, LavadoR, Cueto-Wong J, Joosse P, Sotomayor D, Colon W, Follett
R, DelGrosso, S, LiX and Rimski-Korsakov H ( 2008). An index approach to assess nitrogen losses to
the Environment. Ecological Engineering 32 108–120.
Essiet EU (2001). Agricultural sustainability under small-holder farming in Kano, northern Nigeria.
Journal of Arid Environments 48 1-7.
- 10. Indian Journal of Fundamental and Applied Life Sciences ISSN: 2231-6345 (Online)
An Open Access, Online International Journal Available at http://www.cibtech.org/jls.htm
2014 Vol. 4 (4) October-December, pp.203-212/Mohammadzade and Bazrgar
Research Article
© Copyright 2014 | Centre for Info Bio Technology (CIBTech) 212
Falloon P, Pilbeam C and Smith J (1999). Modeling nitrogen cycling in the arable systems of Nepal
using SUNDIAL. IACR-Rothamsted Technical Report, University of Reading, Whiteknights, Reading,
UK.
Gabrielle B, Mary B, Roche R, SmithP and Gosse G (2002). Simulation of carbon and nitrogen
dynamics in arable soils: a comparison of approaches. European Journal of Agronomy 18 107-120.
Galloway JN, Townsend AR, Erisman JW, Bekunda M, Cai Z, Freney JF, Martinelli LA,
Seitzinger SP and Sutton MA (2008). Transformation of the nitrogen cycle: recent trends, questions,
and potential solutions. Science 320 889–892.
Gibbons JM, Sparkes DL, Wilson PL and Ramsden SJ (2005). Modelling optimal -strategies for
decreasing nitrate loss with variation in weather – a farm-level approach. Agricultural Systems 83 113–
134.
Hu K, Li B, Chen D, Zhang Y and Edis R (2008). Simulation of nitrate leaching under irrigated maize
on sandy soil in desert oasis in Inner Mongolia, China. Agricultural Water Management 95 1180 1188.
Jones C and Jacobsen J (2005). Nitrogen Cycling, Testing and Fertilizer Recommendations, Nutrient
Management Module No. 3. Extension Service, Montana State University, USA.
Nemecek T and Kagi T (2007). Life Cycle Inventories of Swiss and European Agricultural Production
Systems. Final report ecoinvent 2(15a). AgroscopeReckenholz- Taenikon Research Station ART, Swiss
Centre for Life Cycle Inventories, Zurich and Dubendorf, CH.
Mahdavi Damghani A, Koochaki A, Rezvani Moghadam P and Nasiri Mahalati M (2005). Assorting
a sustainability index in order to investigate wheat-cotton agro-ecosystem stability in Khorasan province.
Iranian Journal of Agricultural Science 5 129-142 [in Persian with English summary].
Rothamsted Research Institute (2011). Sundial: The Research Tool, available in:-
http://www.rothamsted.bbsrc.ac.uk/aen/sundial/tool.htm.
Scholefield D and Smith JU (1996). Nitrogen flows in ley-arable systems. Legumes in Sustainable
Fanning Systems, Craibstone.
Smith J, Scholefield D, Glendining M and Stockdale E (1998). Using models to optimise the efficiency
of nitrogen across whole farm rotations. In: Proceedings of an International Workshop on mixed farming
systems in Europe, edited by Keulen H Van, Lantinga EA and Vanlaar H, Dronten/Wageningen, The
Netherlands 25-28 May 1998, Ir. A.P. Minderhoudhoeve-series no. 2.
Smith JU, Bradbury NJ and Addiscott TM (1996). Sundial: a PC-based system for simulating nitrogen
dynamics in arable land. Agronomy Journal 88 38–43.
Smith JU, Smith P, Richter GM, Agostini FA and Welham SJ (2003). Testing the adequacy of
measured data for evaluating nitrogen turnover models by the dot-to-dot method. European Journal of
Soil Science 54 175–185.
Soltani A, Rajabi MH, Zeinali E and Soltani E (2010). Evaluation of environmental impact of crop
production using LCA: wheat in Gorgan, EJCP 3(3) 201-218
Soltani E, Soltani A, Zinali A and Dastmalchi A (2013). Simulating wheat nitrogen loss using cropSyst
in Gorgan. Journal of Water and Soil Preservation 20(4) 145-163 [in Persian with English summary].
Tzilivakis J, Jaggard K, Lewis KA, May M and Warner DJ (2005). Environmental impact and
economic assessment for UK sugar beet production systems. Agriculture, Ecosystems and Environment
107 341–358.
Van der Laana M, Annandalea JG, Bristowa KL, Stirzakera RJ, du Preezc CC, Thorburnb PJ
(2014). Modeling nitrogen leaching: Are we getting the right answer for the right reason?. Agricultural
Water Management 74–80.