Module-6 - Spectroscopic and Diffraction Techniques-Loganathan.pptx
1.
Module 6: Spectroscopic,Diffraction and Microscopic Techniques [2 h]
(i). Fundamental concepts in spectroscopic and instrumental
techniques
(ii). Principle (Beer-Lambert’s Law) and applications of UV-Visible
Spectroscopy technique
(iii). Principle and applications of X-Ray Diffraction (XRD) technique
2.
(i). Fundamental conceptsin spectroscopic and microscopic techniques
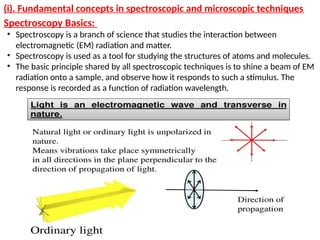
Spectroscopy Basics:
• Spectroscopy is a branch of science that studies the interaction between
electromagnetic (EM) radiation and matter.
• Spectroscopy is used as a tool for studying the structures of atoms and molecules.
• The basic principle shared by all spectroscopic techniques is to shine a beam of EM
radiation onto a sample, and observe how it responds to such a stimulus. The
response is recorded as a function of radiation wavelength.
3.
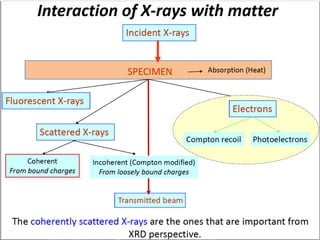
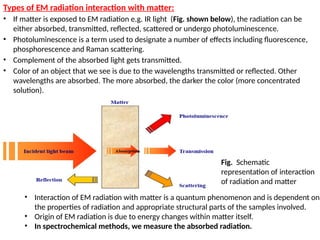
Types of EMradiation interaction with matter:
• If matter is exposed to EM radiation e.g. IR light (Fig. shown below), the radiation can be
either absorbed, transmitted, reflected, scattered or undergo photoluminescence.
• Photoluminescence is a term used to designate a number of effects including fluorescence,
phosphorescence and Raman scattering.
• Complement of the absorbed light gets transmitted.
• Color of an object that we see is due to the wavelengths transmitted or reflected. Other
wavelengths are absorbed. The more absorbed, the darker the color (more concentrated
solution).
Fig. Schematic
representation of interaction
of radiation and matter
• Interaction of EM radiation with matter is a quantum phenomenon and is dependent on
the properties of radiation and appropriate structural parts of the samples involved.
• Origin of EM radiation is due to energy changes within matter itself.
• In spectrochemical methods, we measure the absorbed radiation.
4.
(ii). Principle andapplications of UV-Visible spectroscopy technique
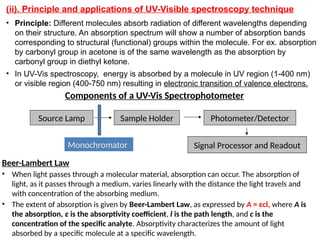
• Principle: Different molecules absorb radiation of different wavelengths depending
on their structure. An absorption spectrum will show a number of absorption bands
corresponding to structural (functional) groups within the molecule. For ex. absorption
by carbonyl group in acetone is of the same wavelength as the absorption by
carbonyl group in diethyl ketone.
• In UV-Vis spectroscopy, energy is absorbed by a molecule in UV region (1-400 nm)
or visible region (400-750 nm) resulting in electronic transition of valence electrons.
Source Lamp Sample Holder Photometer/Detector
Signal Processor and Readout
Monochromator
Components of a UV-Vis Spectrophotometer
Beer-Lambert Law
• When light passes through a molecular material, absorption can occur. The absorption of
light, as it passes through a medium, varies linearly with the distance the light travels and
with concentration of the absorbing medium.
• The extent of absorption is given by Beer-Lambert Law, as expressed by A = εcl, where A is
the absorption, ε is the absorptivity coefficient, l is the path length, and c is the
concentration of the specific analyte. Absorptivity characterizes the amount of light
absorbed by a specific molecule at a specific wavelength.
5.
Chromophore: any isolatedcovalently bonded group that shows a characteristic
absorption in the UV-Vis. region. The only molecular moieties likely to absorb light in
the 200 to 800 nm region are π-electron functions and hetero atoms having non-
bonding electron pairs.
Auxochrome: group of atoms
attached to a chromophore
which modifies the ability of
that chromophore to absorb
light. Ex. COOH, -OH, -SO3H, -
NH2, -NH-R, -N-R2
~ λmax: 255 nm
~ λmax: 280 nm
~ λmax: 320 nm
~ λmax: 385 nm
Auxochrome
Beer-Lambert Law
Path length (l)
IT
Io
6.
Empty
orbitals
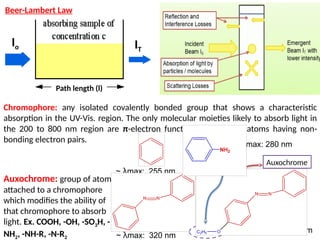
Electronic excitations inUV- Visible spectroscopy
σ to π* is forbidden transition
σ to σ*
transitions: Electron in a bonding σ orbital is excited to the corresponding antibonding σ*
orbital. Energy required is large.
n to σ *
transitions: Saturated compounds containing atoms with lone pairs exhibit n to σ*
transitions. These transitions need lesser energy than σ to σ*
transitions. They can be initiated by
light whose wavelength is in the range 150 - 250 nm.
n to π*
and π to π *
transitions: need an unsaturated group in the molecule to provide the π
electrons. Most absorption spectroscopy of organic compounds is based on these transitions and
fall in the spectral region between 200 - 700 nm.
Based on the functional group present and attached to
chromophores…
Bathochromic shift: absorption maximum shifted to longer
wavelength (Blue to Red [Red shift]).
Hypsochromic shift: absorption maximum shifted to shorter
wavelength (Red to Blue [Blue shift]).
Hyperchromism: increase in molar absorptivity
Hypochromism: decrease in molar absorptivity.
Absorbace
10.
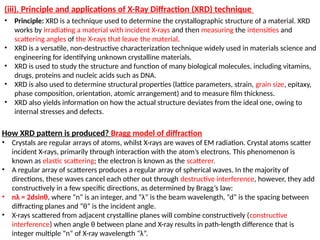
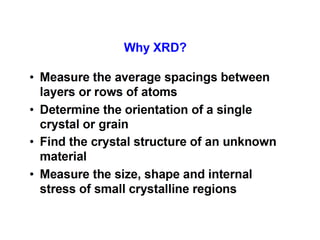
(iii). Principle andapplications of X-Ray Diffraction (XRD) technique
• Principle: XRD is a technique used to determine the crystallographic structure of a material. XRD
works by irradiating a material with incident X-rays and then measuring the intensities and
scattering angles of the X-rays that leave the material.
• XRD is a versatile, non-destructive characterization technique widely used in materials science and
engineering for identifying unknown crystalline materials.
• XRD is used to study the structure and function of many biological molecules, including vitamins,
drugs, proteins and nucleic acids such as DNA.
• XRD is also used to determine structural properties (lattice parameters, strain, grain size, epitaxy,
phase composition, orientation, atomic arrangement) and to measure film thickness.
• XRD also yields information on how the actual structure deviates from the ideal one, owing to
internal stresses and defects.
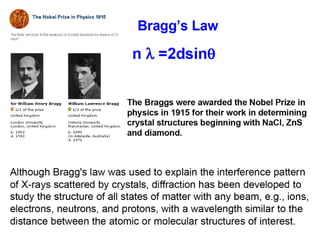
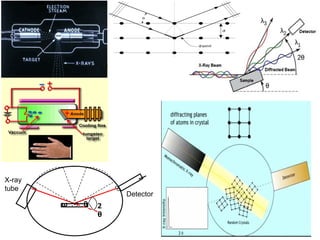
How XRD pattern is produced? Bragg model of diffraction
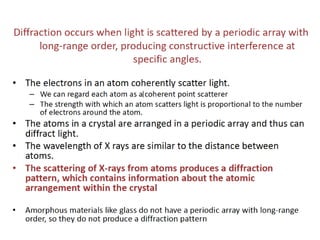
• Crystals are regular arrays of atoms, whilst X-rays are waves of EM radiation. Crystal atoms scatter
incident X-rays, primarily through interaction with the atom’s electrons. This phenomenon is
known as elastic scattering; the electron is known as the scatterer.
• A regular array of scatterers produces a regular array of spherical waves. In the majority of
directions, these waves cancel each other out through destructive interference, however, they add
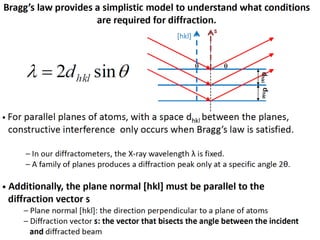
constructively in a few specific directions, as determined by Bragg’s law:
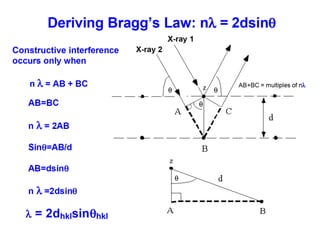
• nλ = 2dsinθ, where “n” is an integer, and “λ” is the beam wavelength, “d” is the spacing between
diffracting planes and “θ” is the incident angle.
• X-rays scattered from adjacent crystalline planes will combine constructively (constructive
interference) when angle θ between plane and X-ray results in path-length difference that is
integer multiple “n” of X-ray wavelength “λ”.
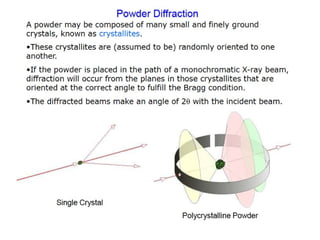
15.
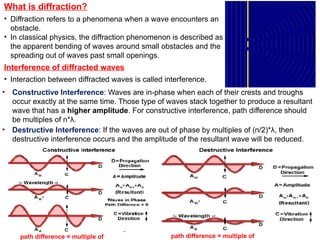
What is diffraction?
•Diffraction refers to a phenomena when a wave encounters an
obstacle.
• In classical physics, the diffraction phenomenon is described as
the apparent bending of waves around small obstacles and the
spreading out of waves past small openings.
Interference of diffracted waves
• Interaction between diffracted waves is called interference.
• Constructive Interference: Waves are in-phase when each of their crests and troughs
occur exactly at the same time. Those type of waves stack together to produce a resultant
wave that has a higher amplitude. For constructive interference, path difference should
be multiples of n*λ.
• Destructive Interference: If the waves are out of phase by multiples of (n/2)*λ, then
destructive interference occurs and the amplitude of the resultant wave will be reduced.
path difference = multiple of path difference = multiple of
16.
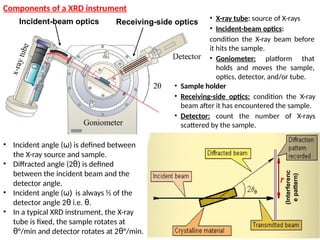
Incident-beam optics Receiving-sideoptics
• X-ray tube: source of X-rays
• Incident-beam optics:
condition the X-ray beam before
it hits the sample.
• Goniometer: platform that
holds and moves the sample,
optics, detector, and/or tube.
• Sample holder
• Receiving-side optics: condition the X-ray
beam after it has encountered the sample.
• Detector: count the number of X-rays
scattered by the sample.
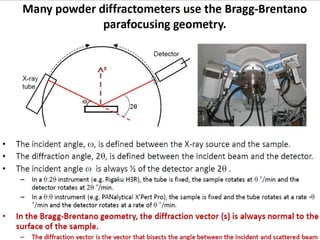
• Incident angle (ω) is defined between
the X-ray source and sample.
• Diffracted angle (2θ) is defined
between the incident beam and the
detector angle.
• Incident angle (ω) is always ½ of the
detector angle 2θ i.e. θ.
• In a typical XRD instrument, the X-ray
tube is fixed, the sample rotates at
θ°/min and detector rotates at 2θ°/min.
Components of a XRD instrument
(Interferenc
e
pattern)
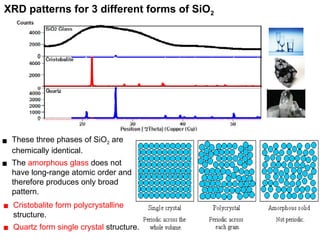
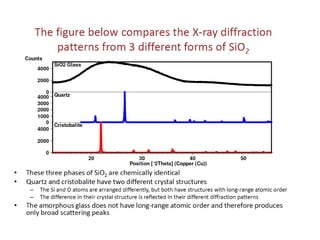
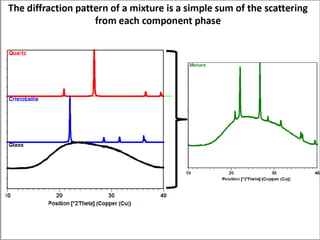
XRD patterns for3 different forms of SiO2
▪ These three phases of SiO2 are
chemically identical.
▪ The amorphous glass does not
have long-range atomic order and
therefore produces only broad
pattern.
▪ Cristobalite form polycrystalline
structure.
▪ Quartz form single crystal structure.
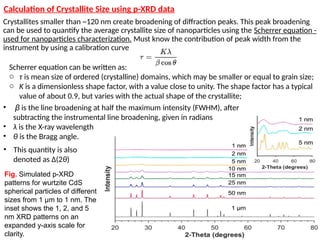
29.
Scherrer equation canbe written as:
o τ is mean size of ordered (crystalline) domains, which may be smaller or equal to grain size;
o K is a dimensionless shape factor, with a value close to unity. The shape factor has a typical
value of about 0.9, but varies with the actual shape of the crystallite;
Crystallites smaller than ~120 nm create broadening of diffraction peaks. This peak broadening
can be used to quantify the average crystallite size of nanoparticles using the Scherrer equation -
used for nanoparticles characterization. Must know the contribution of peak width from the
instrument by using a calibration curve
Fig. Simulated p-XRD
patterns for wurtzite CdS
spherical particles of different
sizes from 1 μm to 1 nm. The
inset shows the 1, 2, and 5
nm XRD patterns on an
expanded y-axis scale for
clarity.
• β is the line broadening at half the maximum intensity (FWHM), after
subtracting the instrumental line broadening, given in radians
• λ is the X-ray wavelength
• θ is the Bragg angle.
• This quantity is also
denoted as Δ(2θ)
Calculation of Crystallite Size using p-XRD data
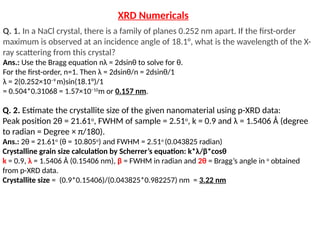
30.
Q. 2. Estimatethe crystallite size of the given nanomaterial using p-XRD data:
Peak position 2θ = 21.61o
, FWHM of sample = 2.51o
, k = 0.9 and λ = 1.5406 Å (degree
to radian = Degree × π/180).
Ans.: 2θ = 21.61o
(θ = 10.805o
) and FWHM = 2.51o
(0.043825 radian)
Crystalline grain size calculation by Scherrer’s equation: k*λ/β*cosθ
k = 0.9, λ = 1.5406 Å (0.15406 nm), β = FWHM in radian and 2θ = Bragg’s angle in o
obtained
from p-XRD data.
Crystallite size = (0.9*0.15406)/(0.043825*0.982257) nm = 3.22 nm
Q. 1. In a NaCl crystal, there is a family of planes 0.252 nm apart. If the first-order
maximum is observed at an incidence angle of 18.1°, what is the wavelength of the X-
ray scattering from this crystal?
Ans.: Use the Bragg equation nλ = 2dsinθ to solve for θ.
For the first-order, n=1. Then λ = 2dsinθ/n = 2dsinθ/1
λ = 2(0.252×10⁻⁹
m)sin(18.1°)/1
= 0.504*0.31068 = 1.57×10⁻¹⁰
m or 0.157 nm.
XRD Numericals
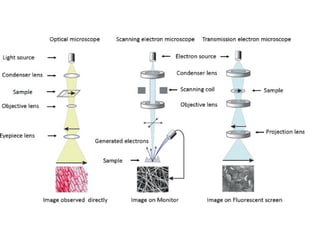
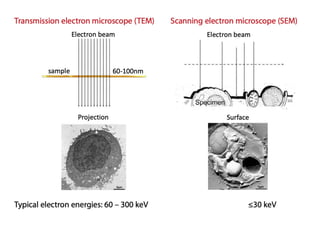
Scanning Electron Microscope
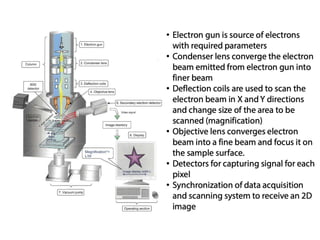
Workingprinciple
Scanning Electron Microscopy, or SEM
analysis, provides high-resolution imaging
useful for evaluating various materials for
surface fractures, flaws, contaminants or
corrosion.
SEM image of pollen grains
Editor's Notes
#10 Other applications
Complex ion determination.
Determination of ozone level in atmosphere (λ = 260 nm).
Study of cis and trans isomers, and
Study of H+ ion concentration.
![Module 6: Spectroscopic, Diffraction and Microscopic Techniques [2 h]
(i). Fundamental concepts in spectroscopic and instrumental
techniques
(ii). Principle (Beer-Lambert’s Law) and applications of UV-Visible
Spectroscopy technique
(iii). Principle and applications of X-Ray Diffraction (XRD) technique](https://image.slidesharecdn.com/module-6-spectroscopicanddiffractiontechniques-loganathan-250419090325-9d12e600/85/Module-6-Spectroscopic-and-Diffraction-Techniques-Loganathan-pptx-1-320.jpg)
![Empty
orbitals
Electronic excitations in UV- Visible spectroscopy
σ to π* is forbidden transition
σ to σ*
transitions: Electron in a bonding σ orbital is excited to the corresponding antibonding σ*
orbital. Energy required is large.
n to σ *
transitions: Saturated compounds containing atoms with lone pairs exhibit n to σ*
transitions. These transitions need lesser energy than σ to σ*
transitions. They can be initiated by
light whose wavelength is in the range 150 - 250 nm.
n to π*
and π to π *
transitions: need an unsaturated group in the molecule to provide the π
electrons. Most absorption spectroscopy of organic compounds is based on these transitions and
fall in the spectral region between 200 - 700 nm.
Based on the functional group present and attached to
chromophores…
Bathochromic shift: absorption maximum shifted to longer
wavelength (Blue to Red [Red shift]).
Hypsochromic shift: absorption maximum shifted to shorter
wavelength (Red to Blue [Blue shift]).
Hyperchromism: increase in molar absorptivity
Hypochromism: decrease in molar absorptivity.
Absorbace](https://image.slidesharecdn.com/module-6-spectroscopicanddiffractiontechniques-loganathan-250419090325-9d12e600/85/Module-6-Spectroscopic-and-Diffraction-Techniques-Loganathan-pptx-6-320.jpg)