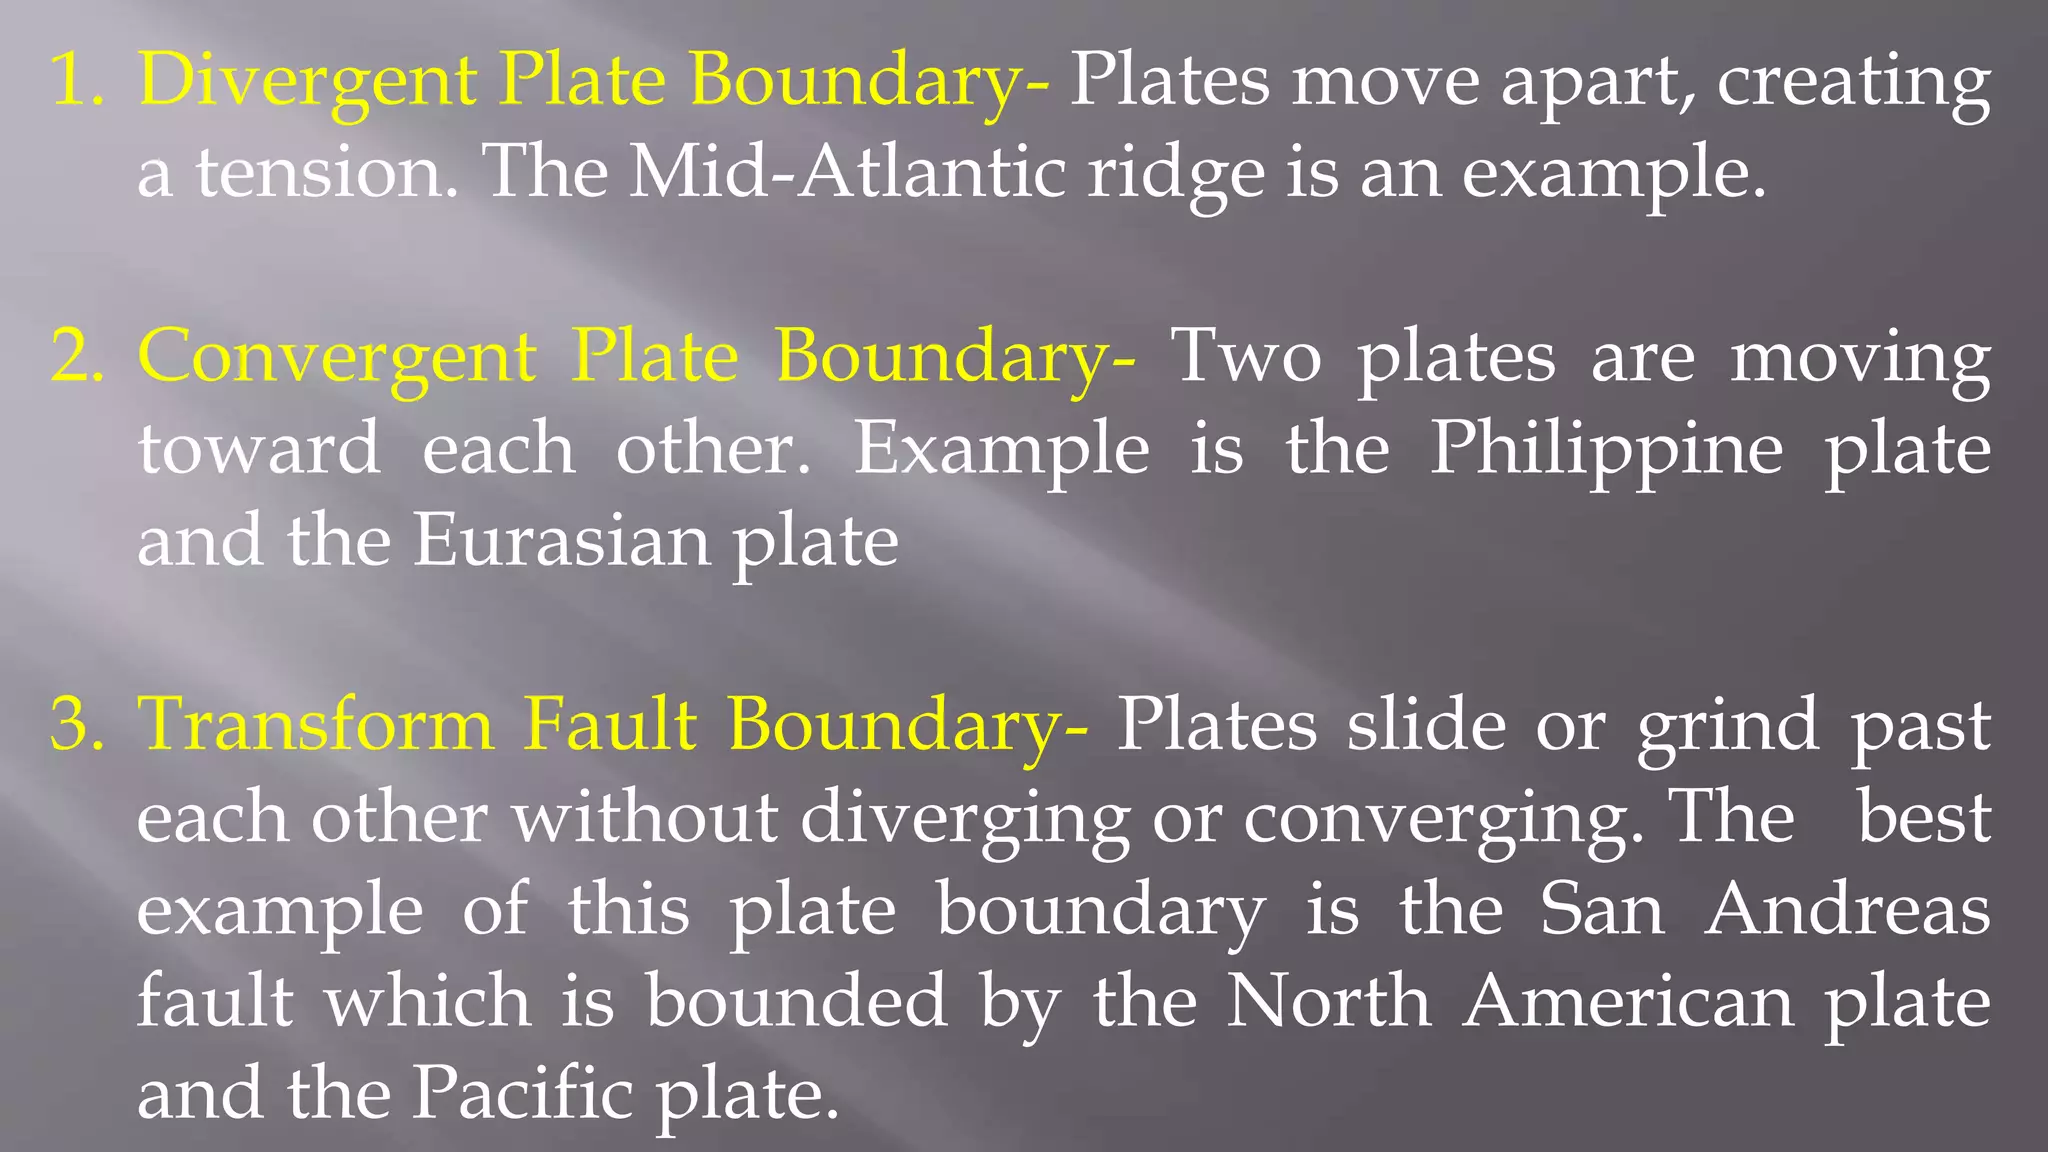
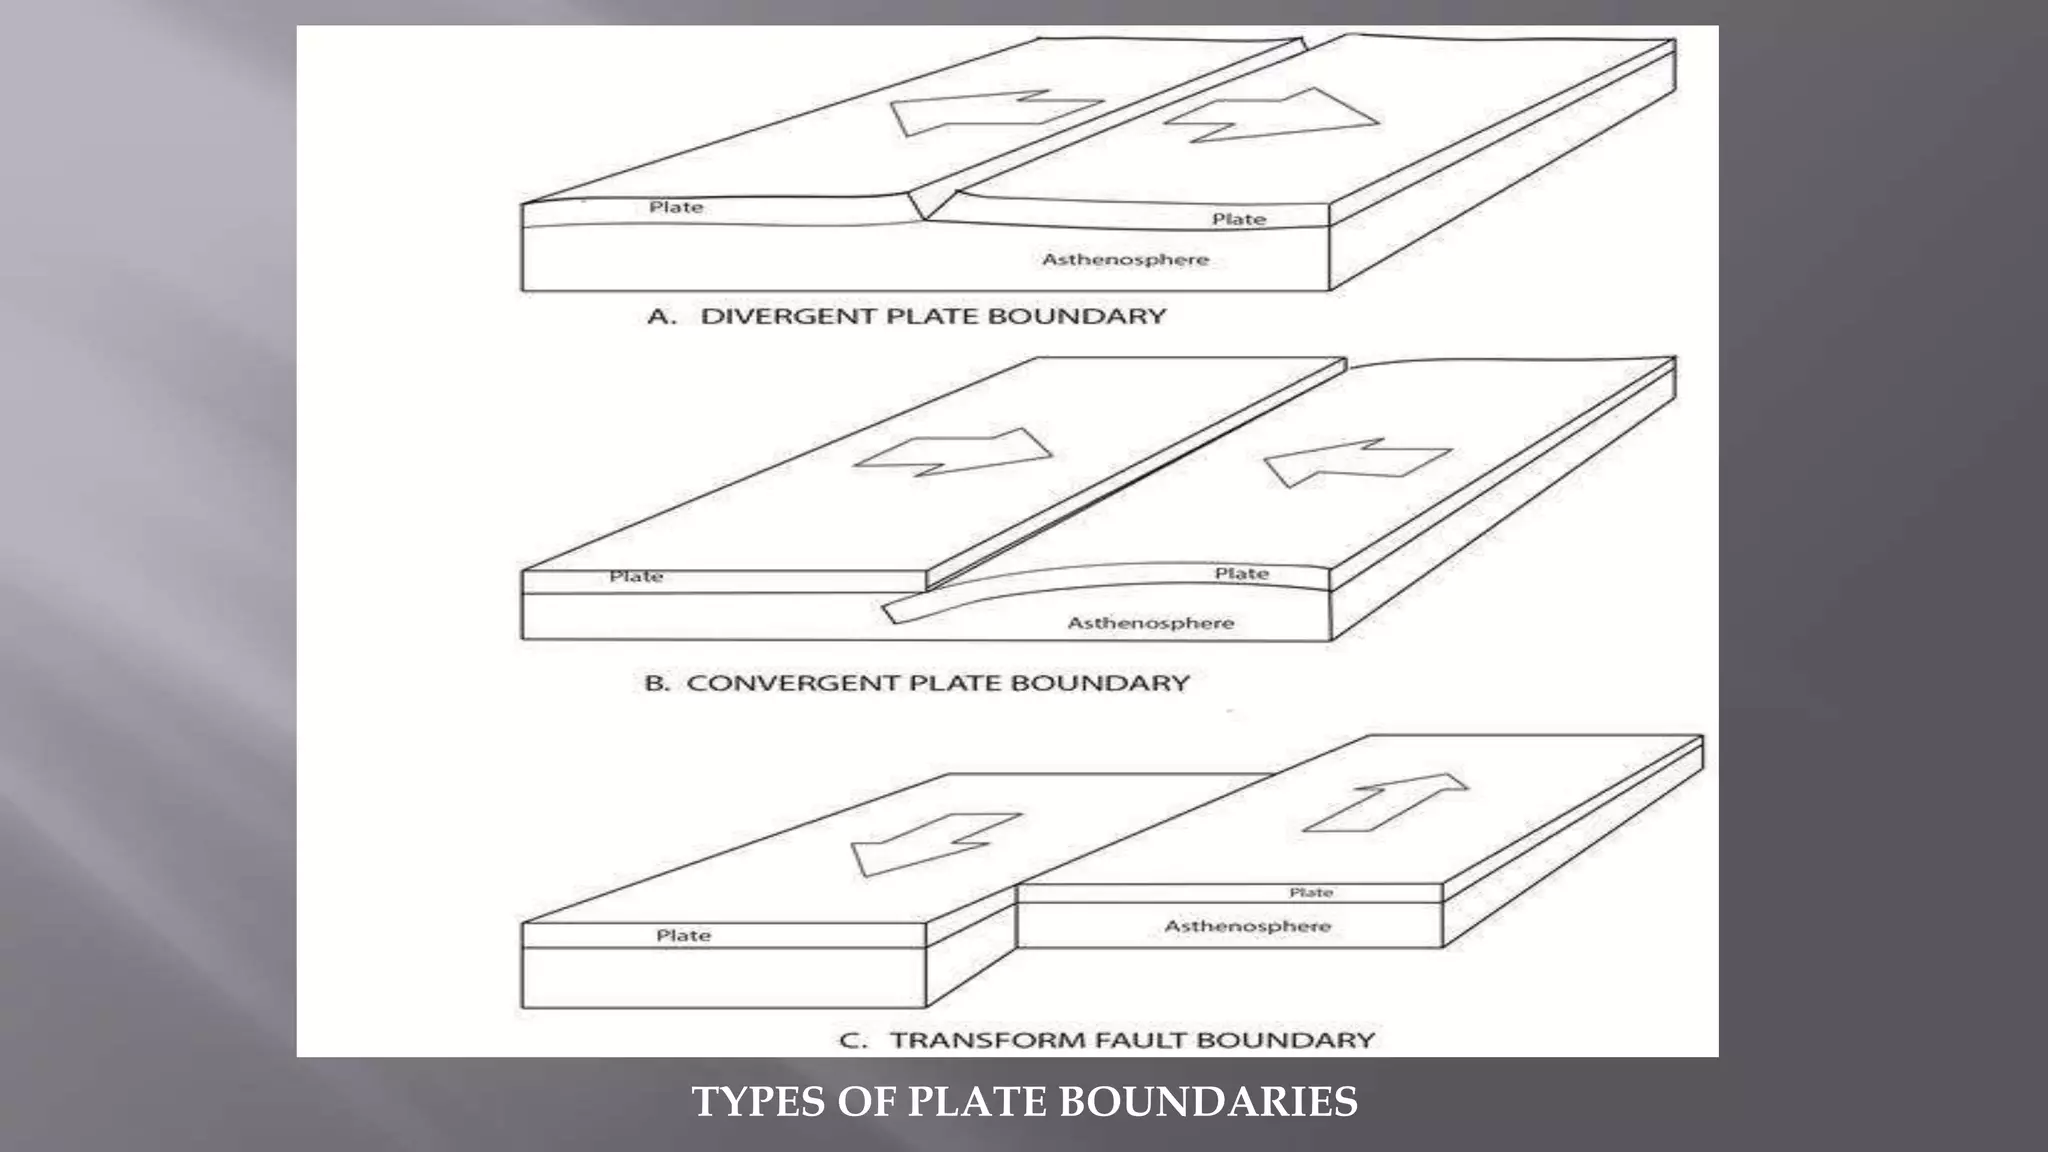
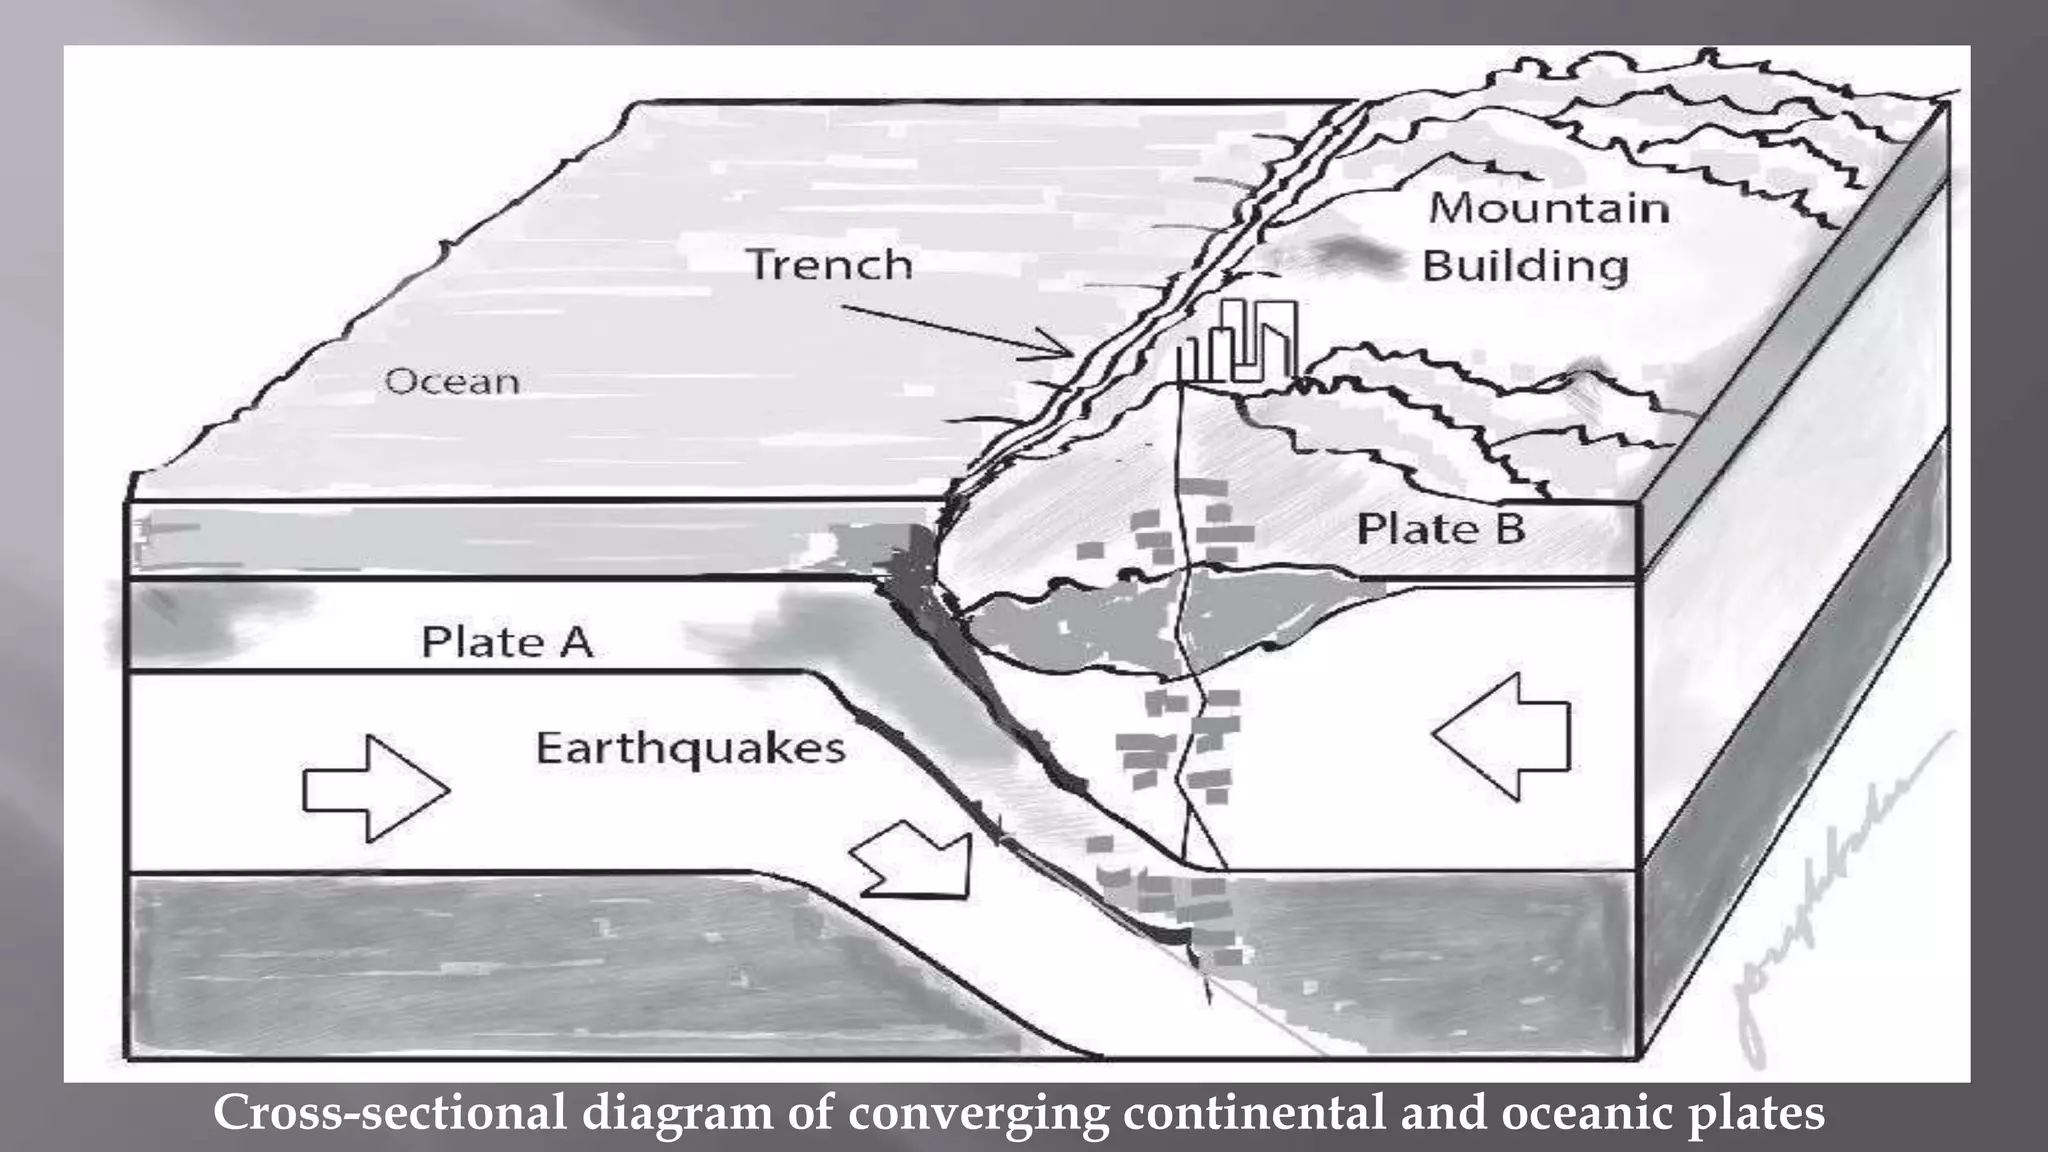
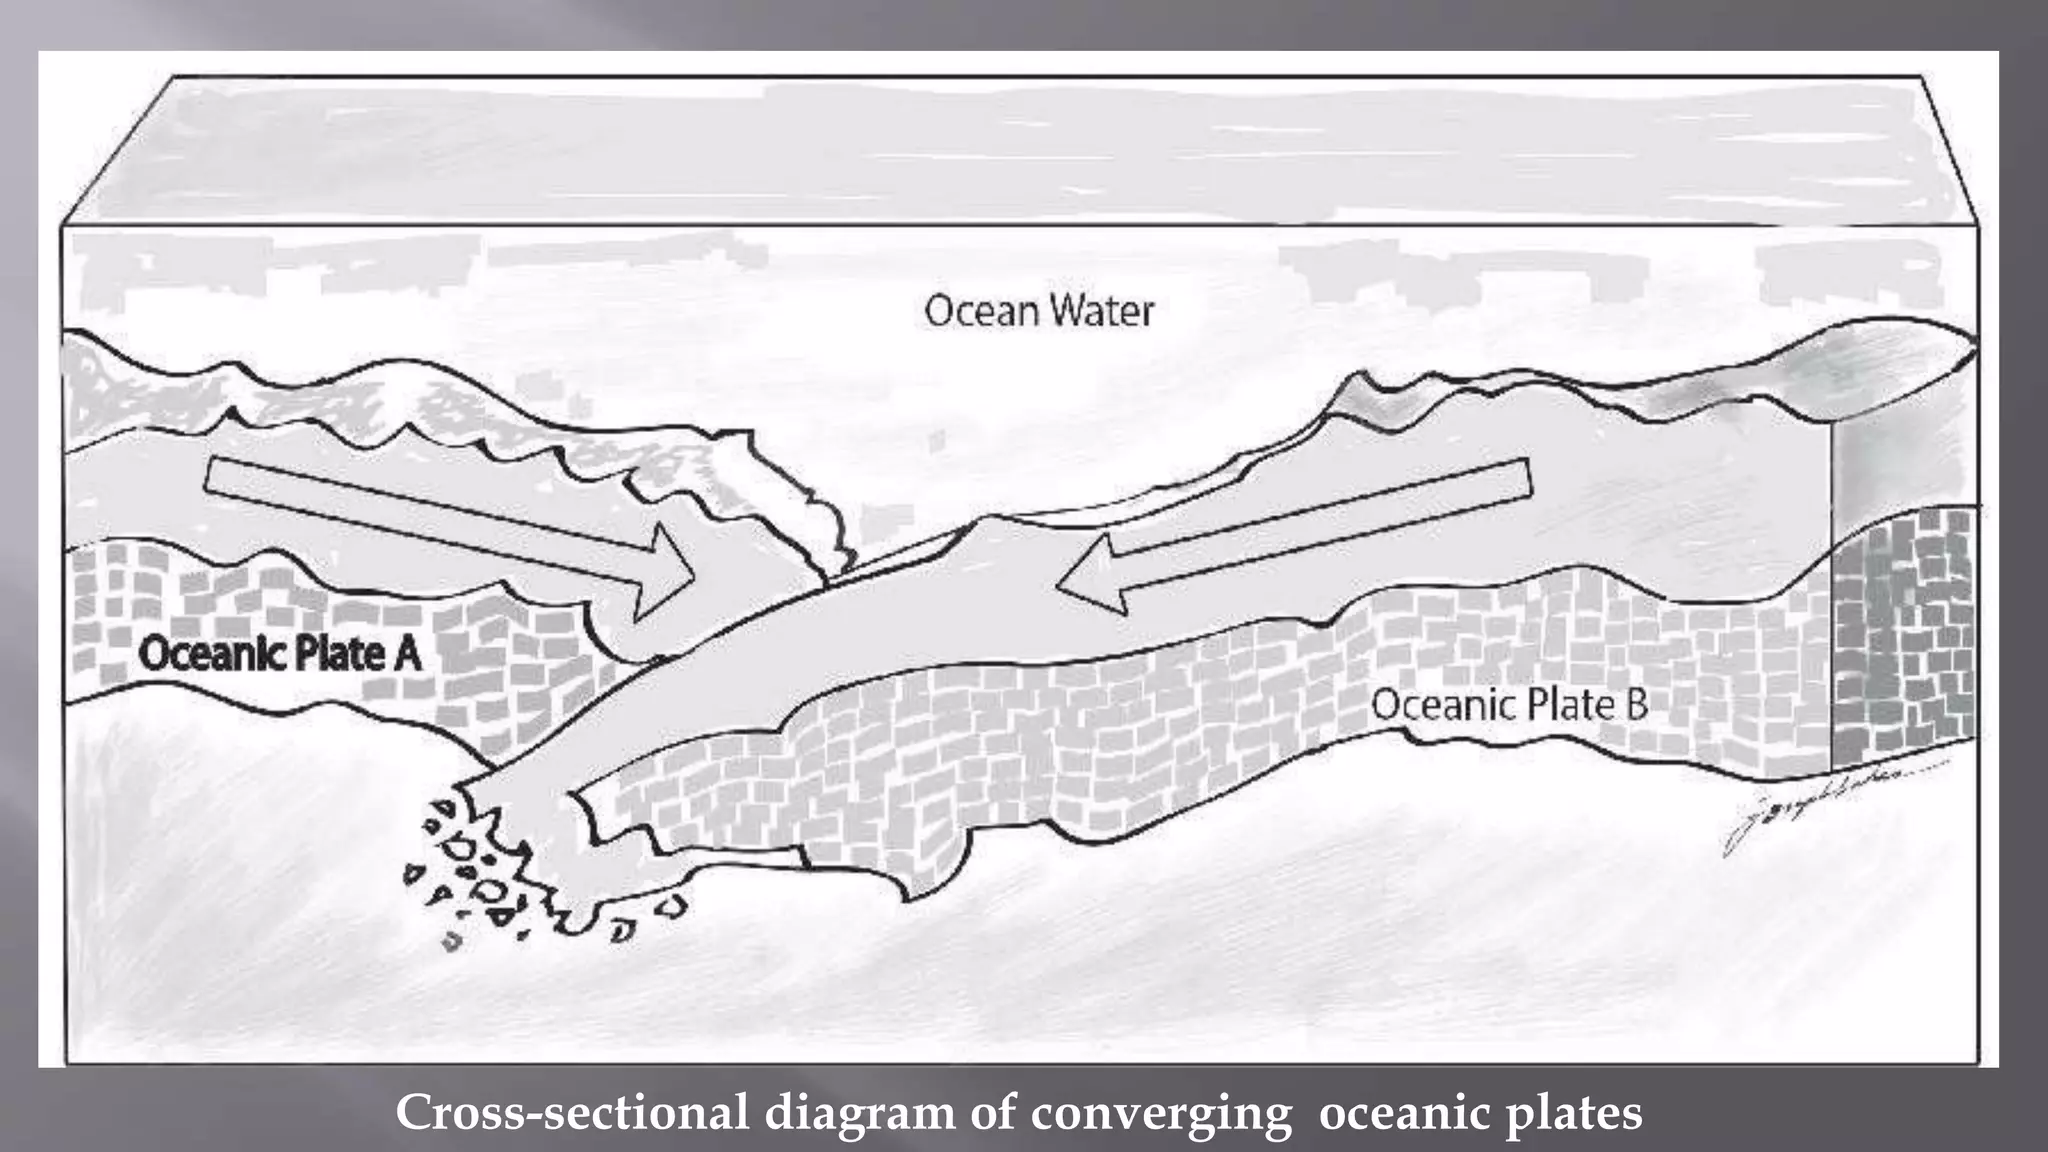
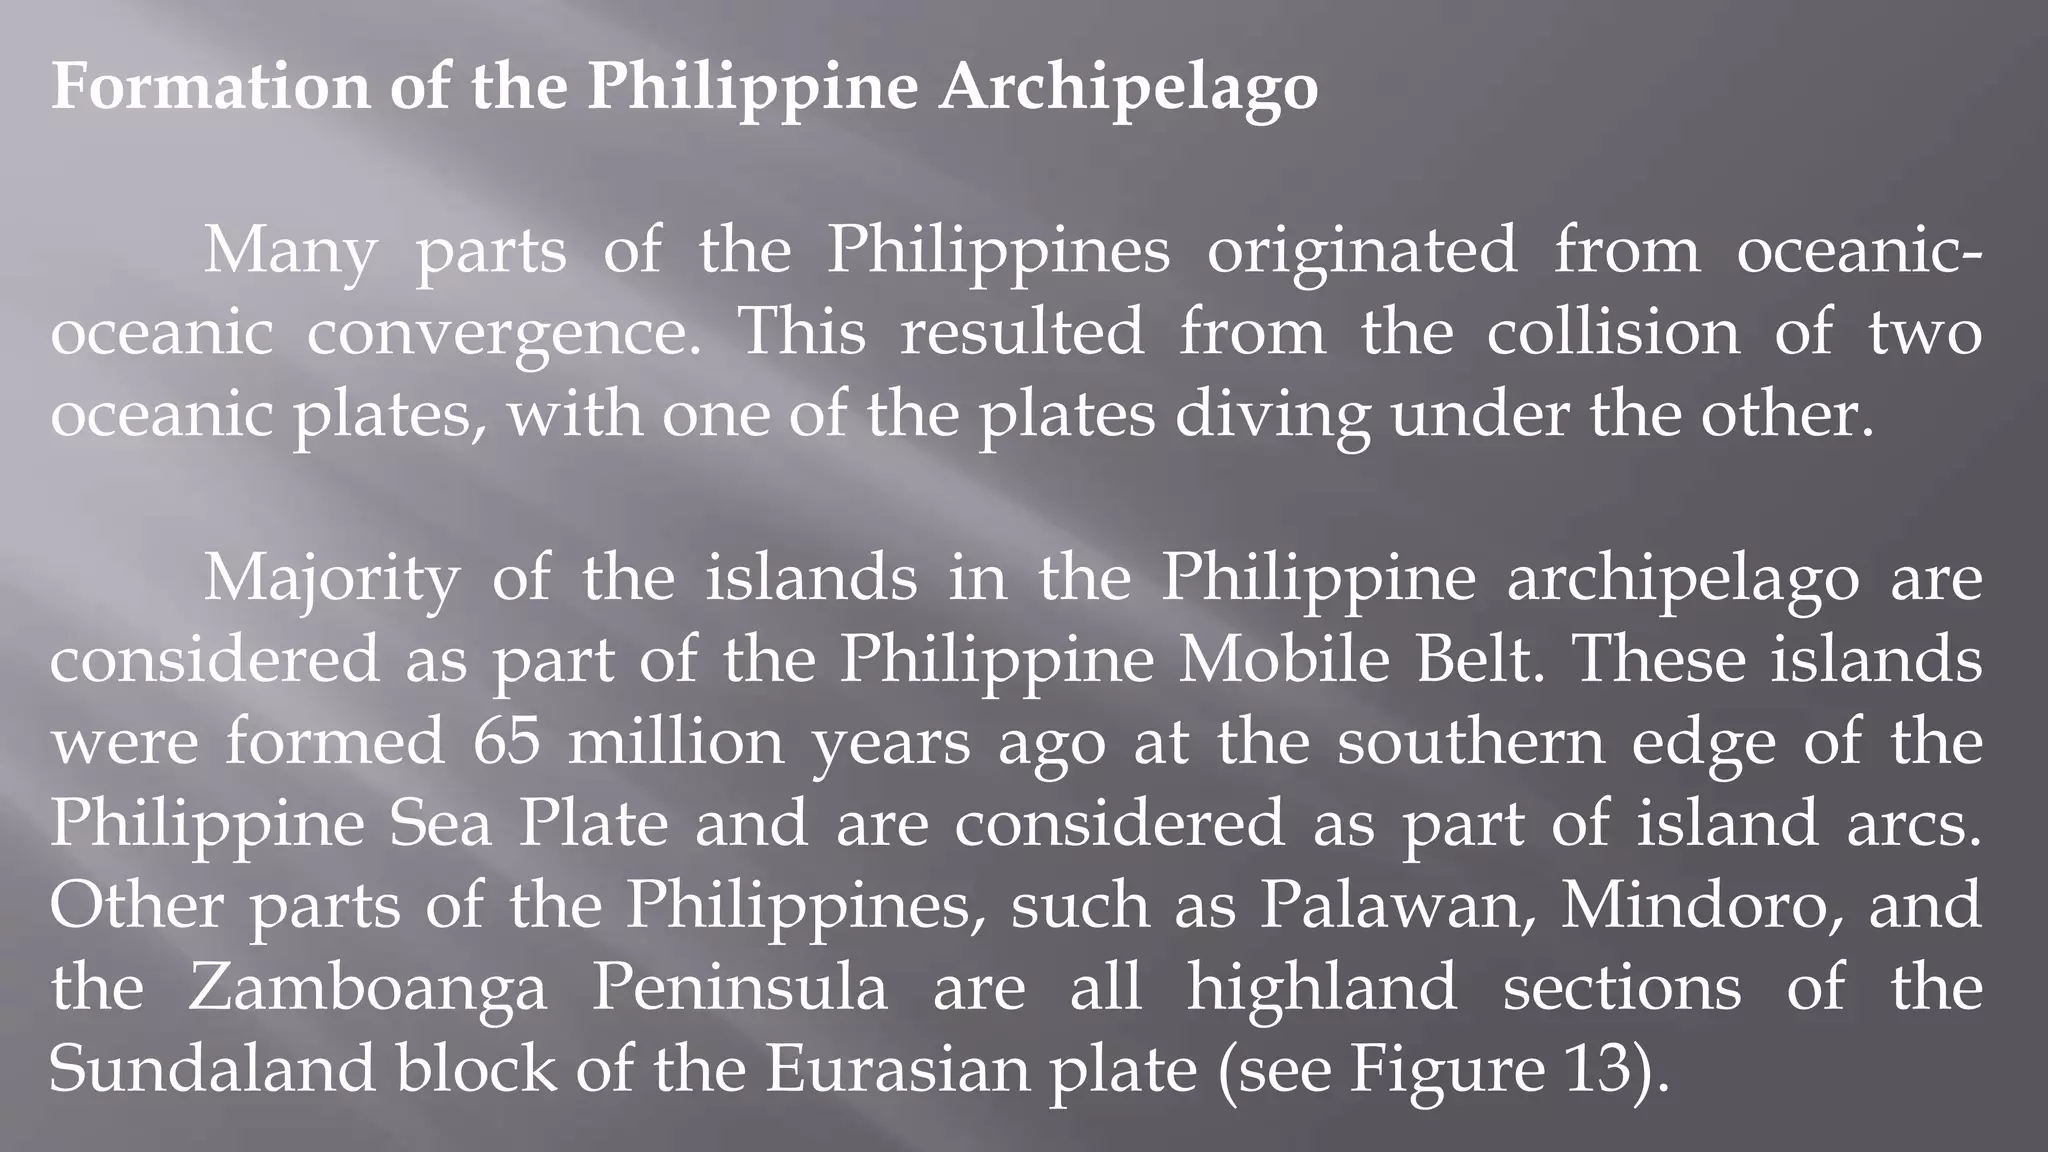
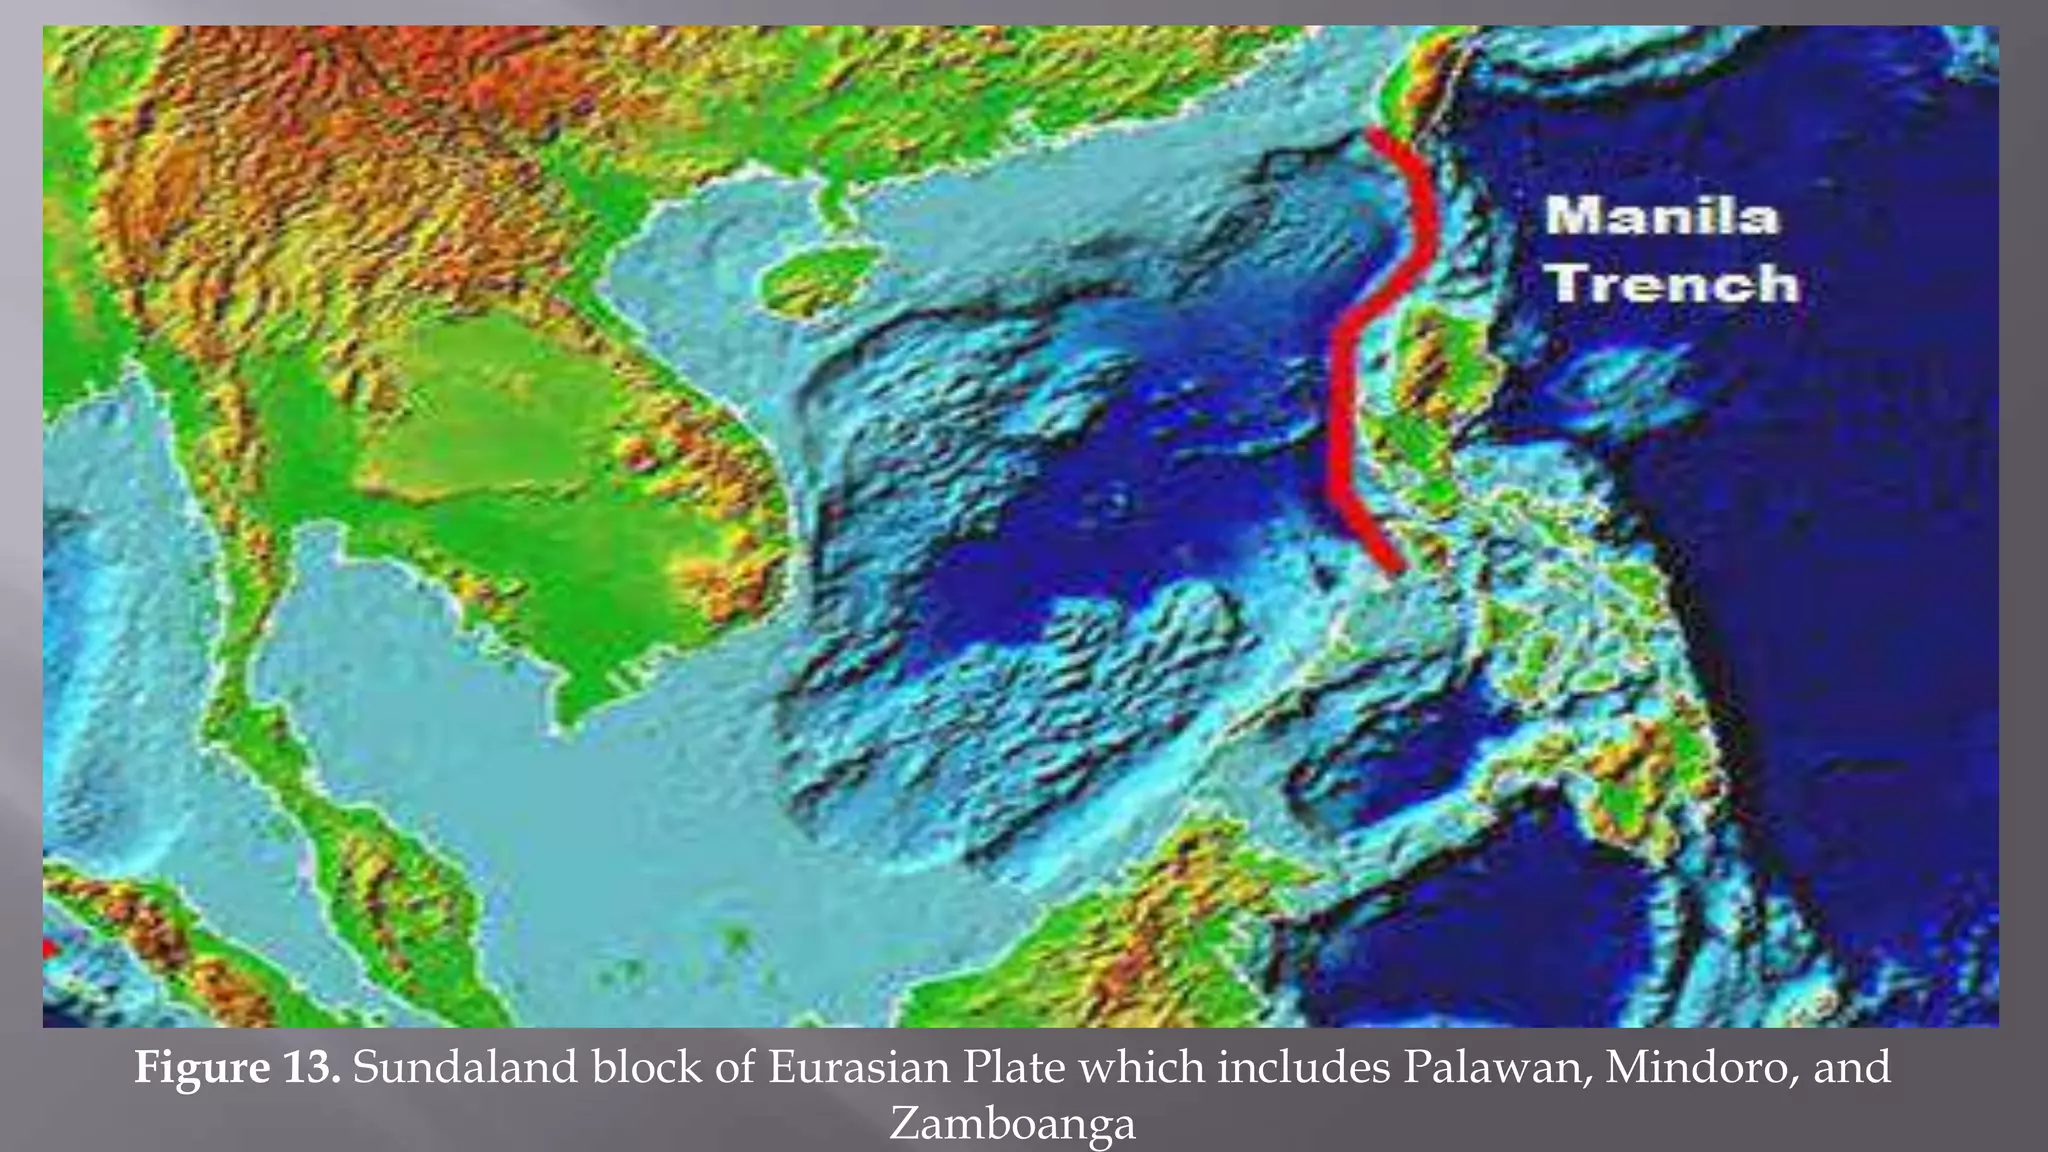
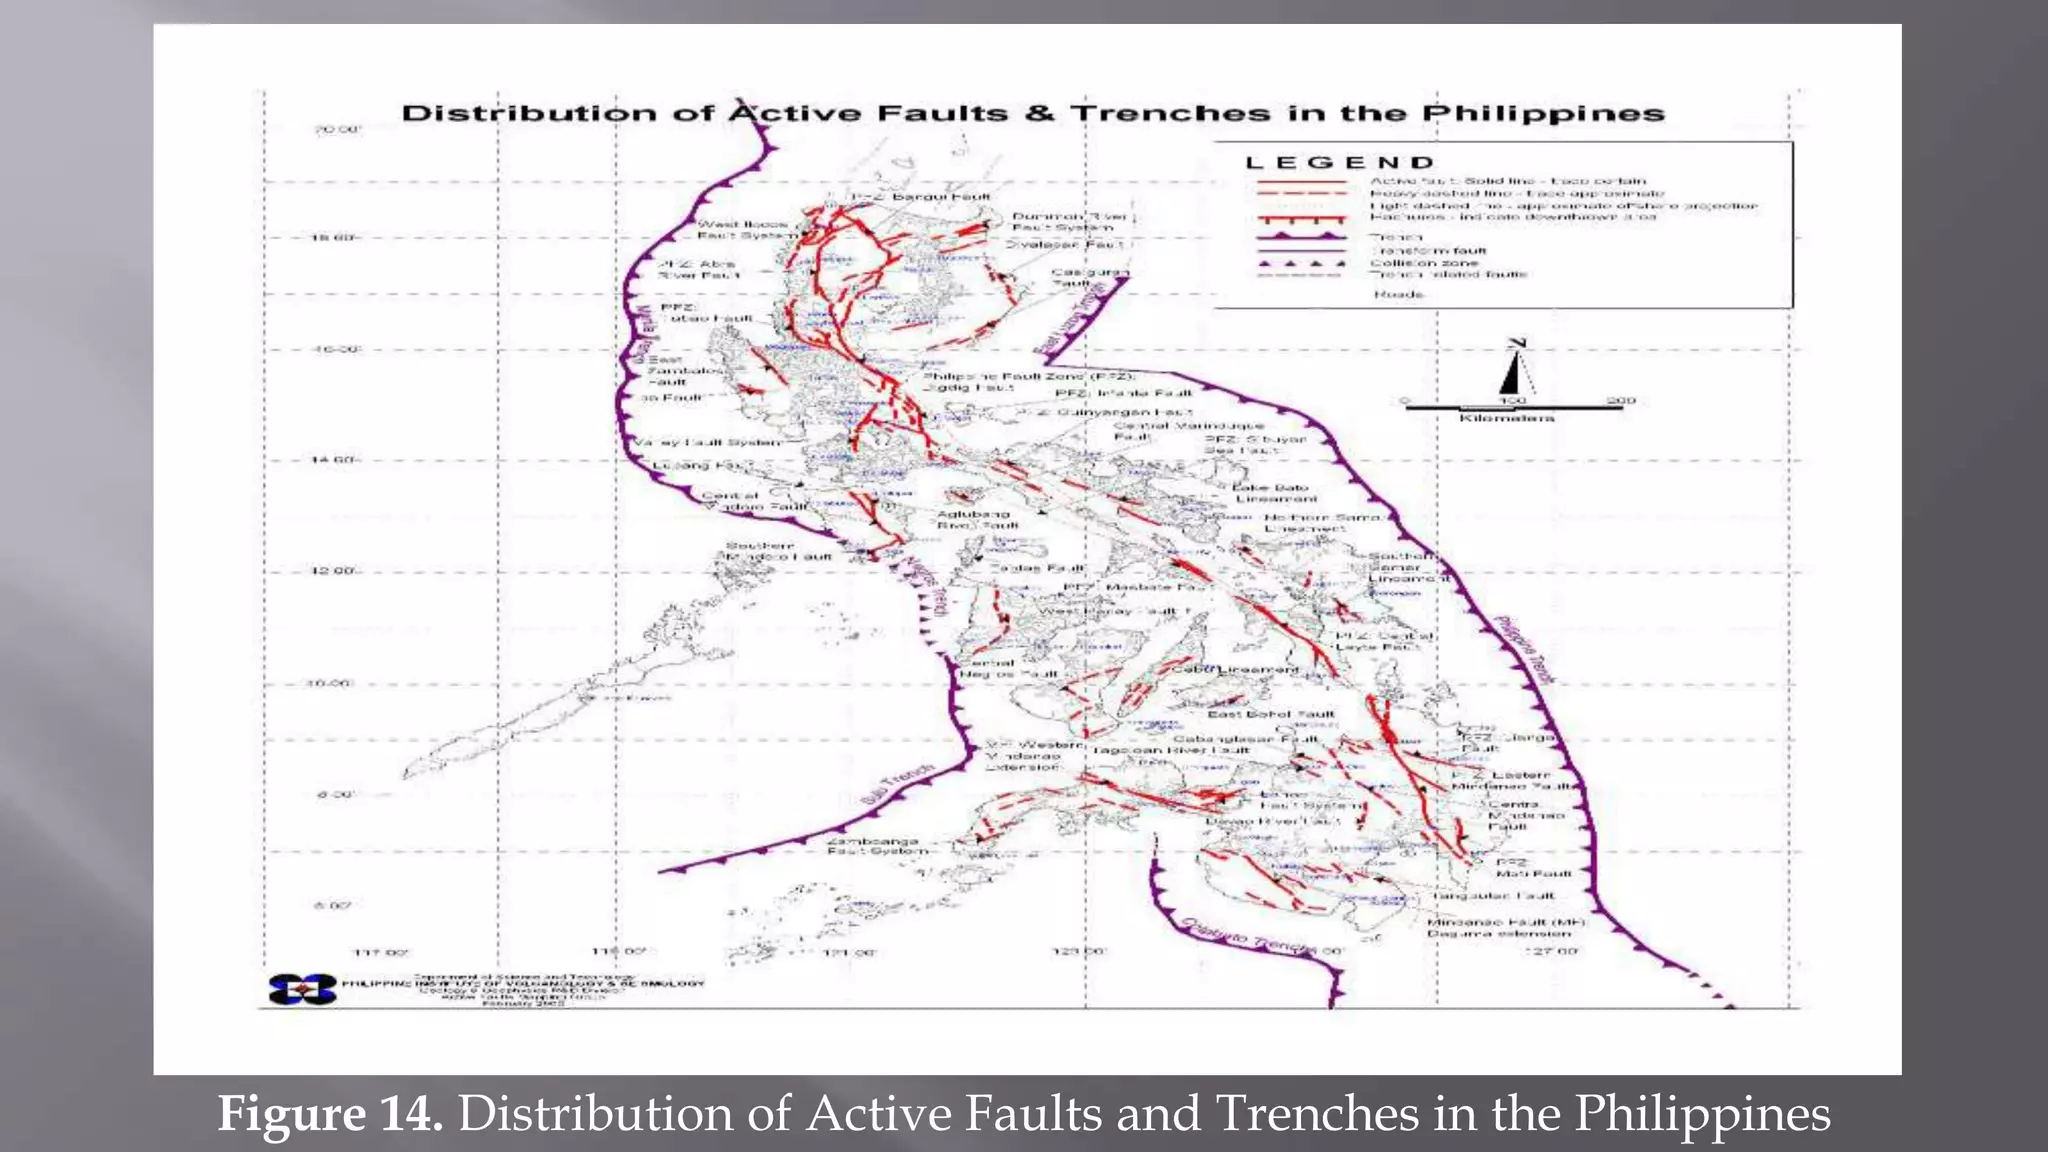
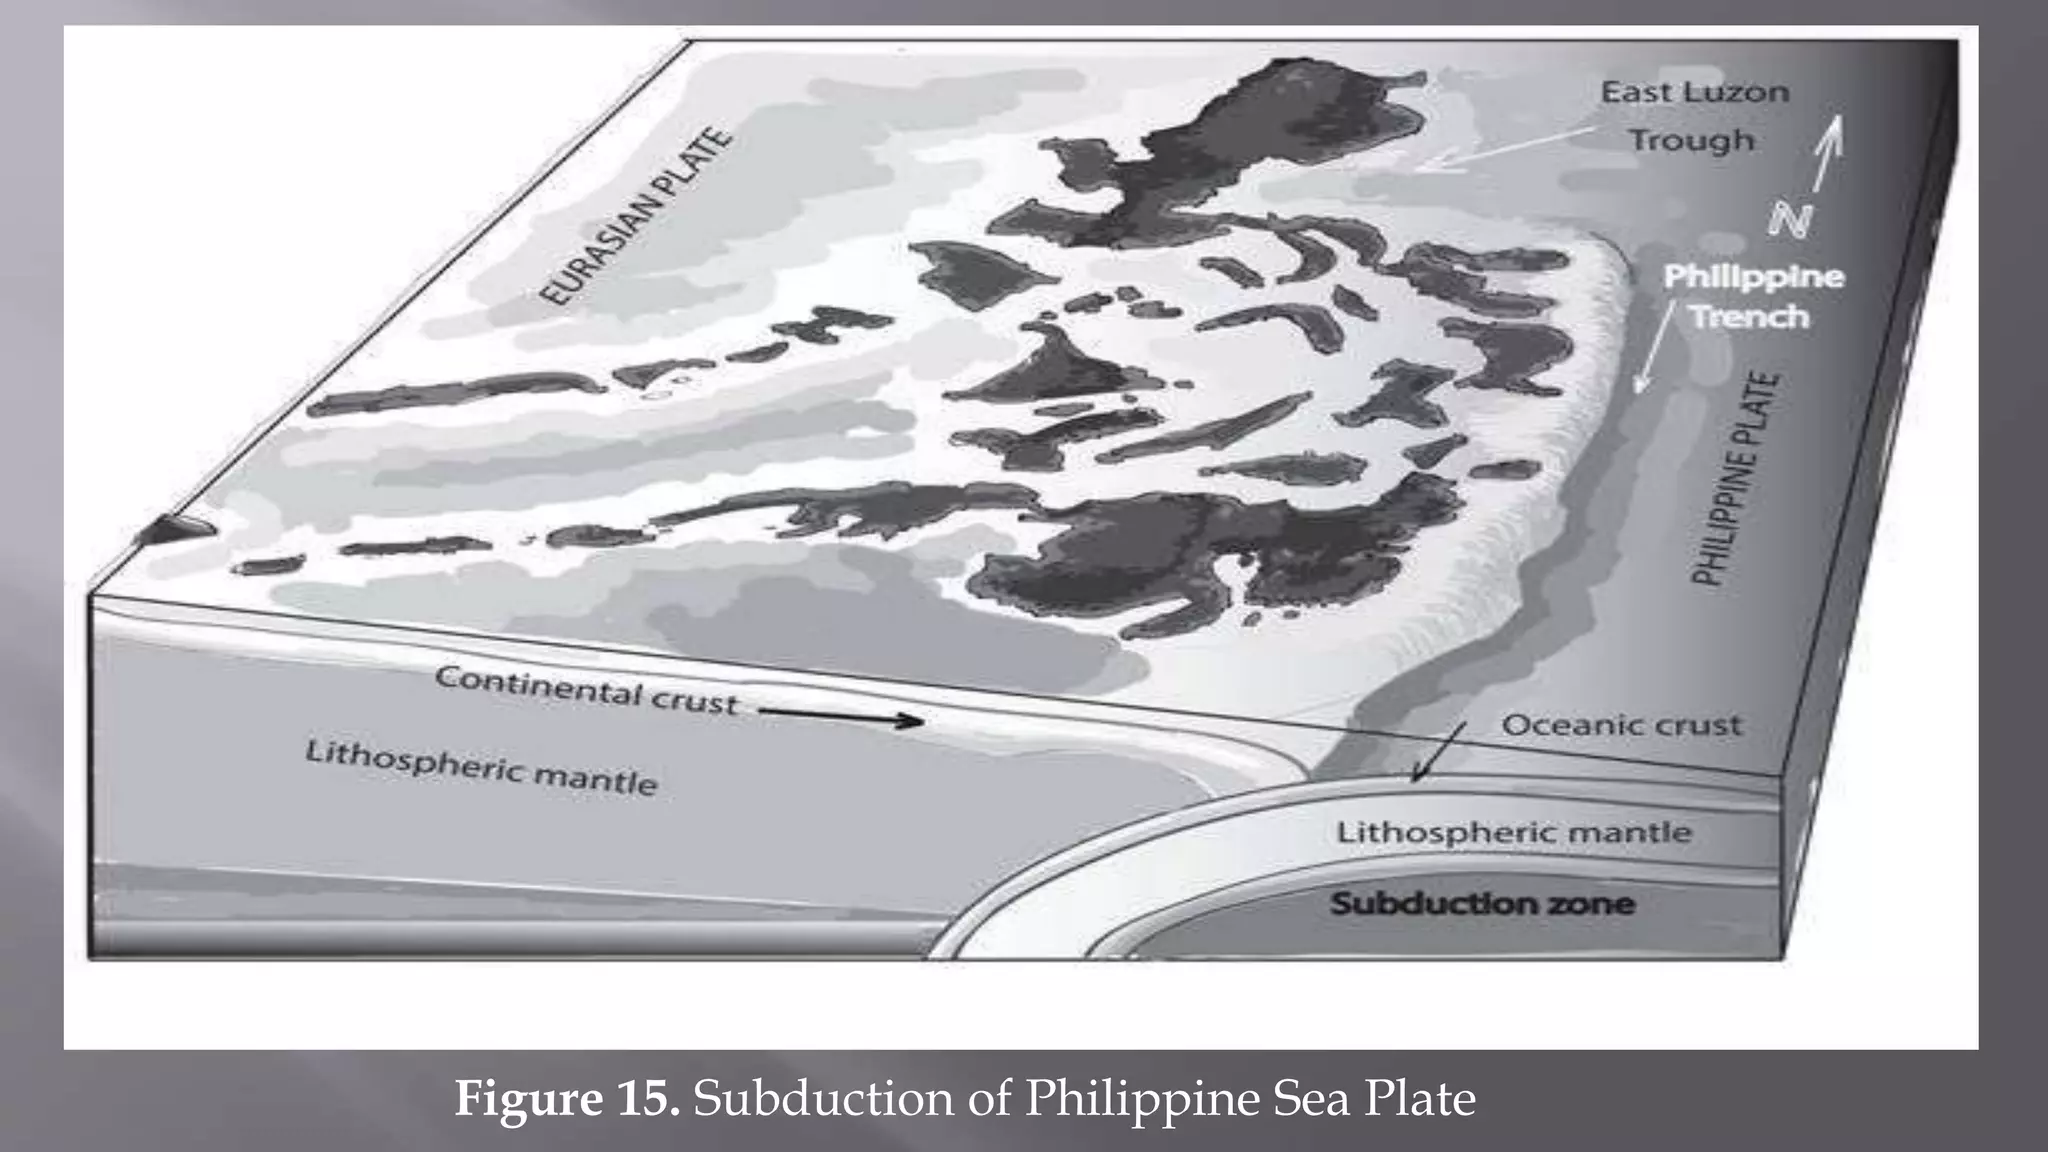
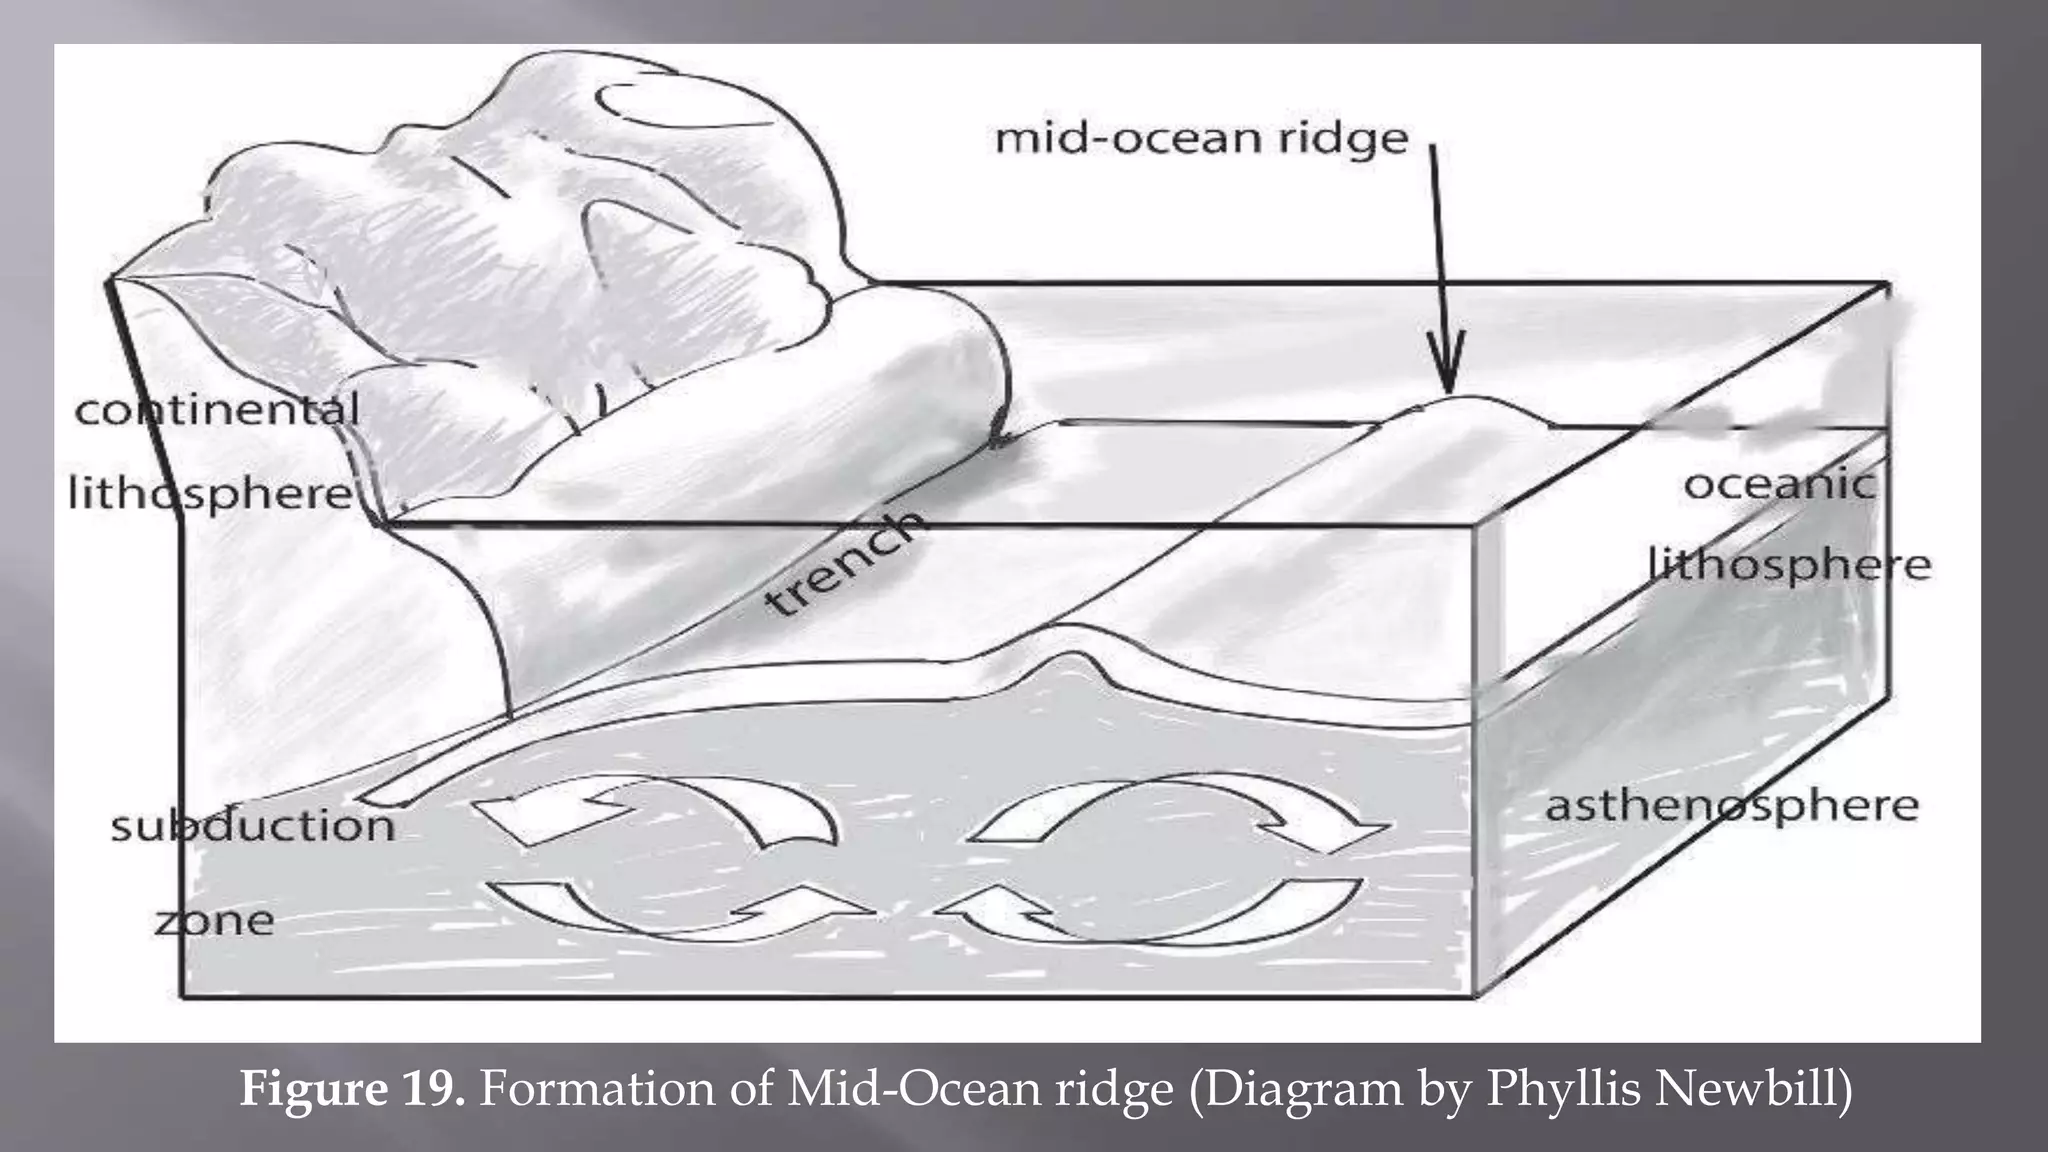
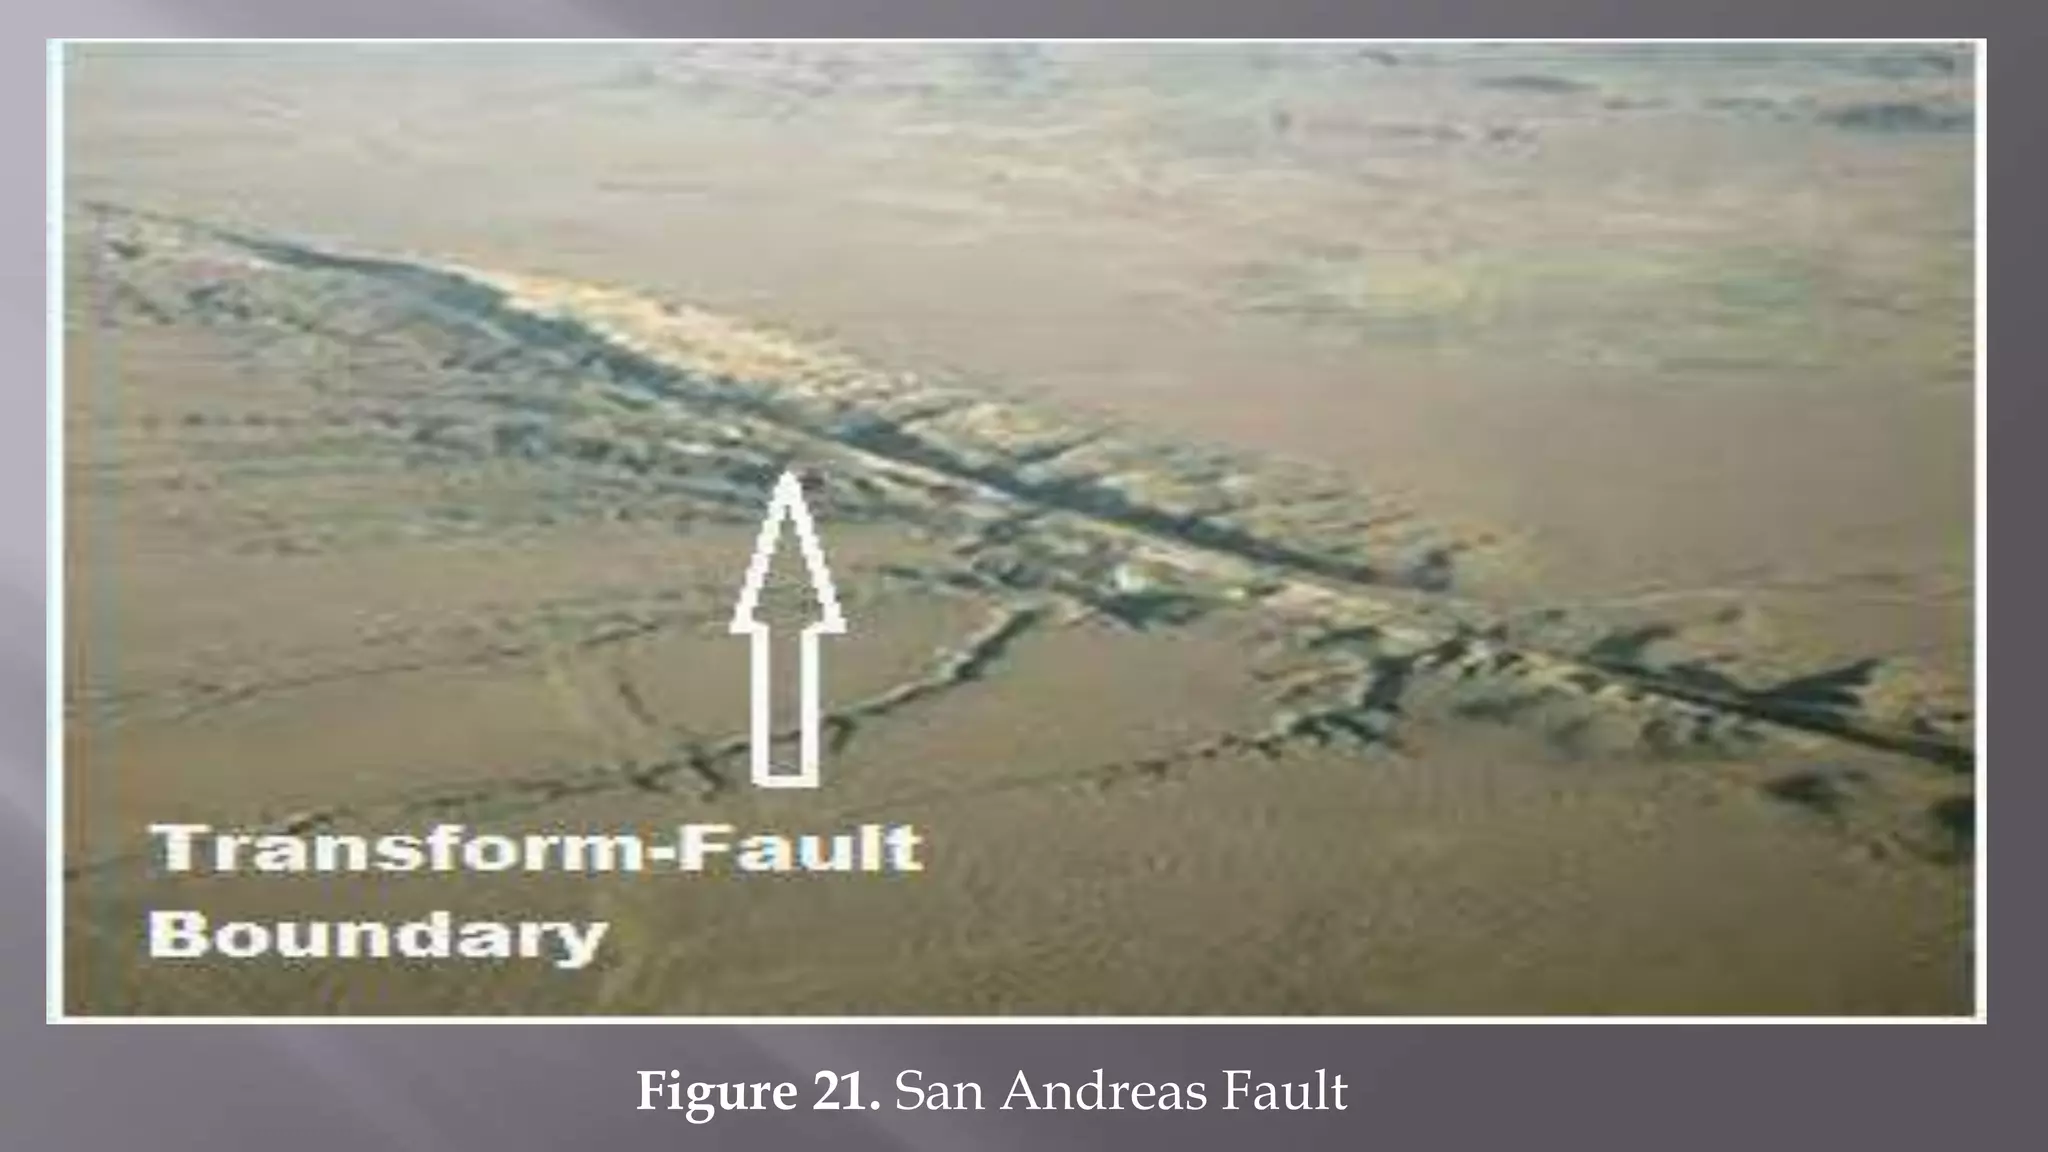
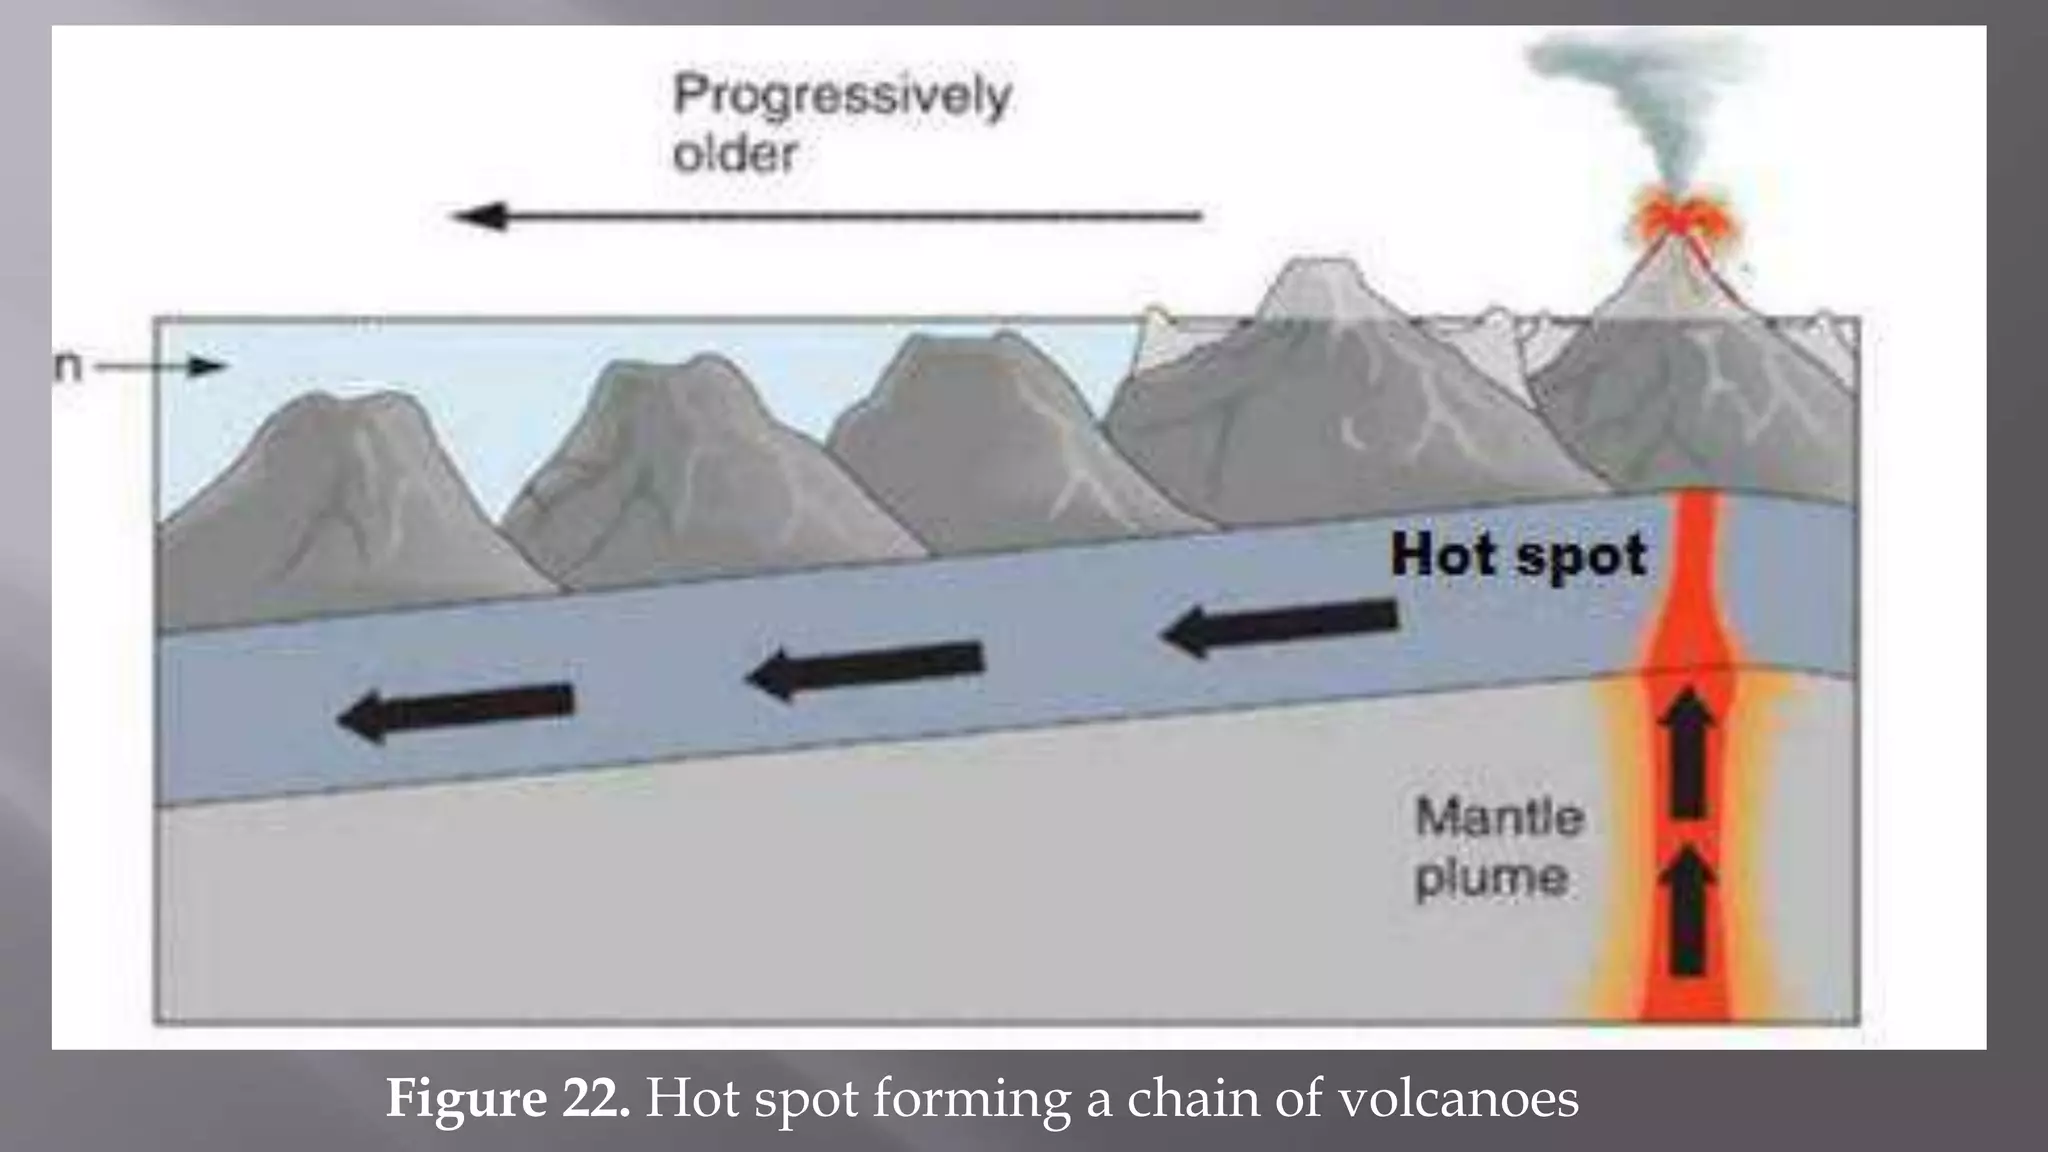
The document discusses plate tectonics and provides examples of activities to help students understand the theory. It begins by introducing the three main types of plate boundaries: divergent boundaries where plates move apart, convergent boundaries where they move together, and transform boundaries where they slide past each other. Later activities illustrate how convergent boundaries between oceanic and continental plates can result in subduction and volcanic island arcs. They also explain how the Philippines' geology has been shaped by the collision and subduction of tectonic plates over millions of years.
This document provides an overview of the Grade 10 Earth and Space science curriculum in the Philippines. It covers two main modules on plate tectonics and Earth's interior. The plate tectonics module describes plate boundaries, processes at boundaries like earthquakes and volcanoes, and activities to teach these concepts. The Earth's interior module covers the internal structure of Earth and evidence that supports plate movement, with additional hands-on activities. The curriculum aims to explain geological phenomena based on the theory of plate tectonics.
The document discusses key concepts related to plate tectonics including the differences between continental and oceanic crust, lithospheric plates and plate tectonics, P and S waves, epicenters and foci, and seismograms and seismographs. It also discusses how seismologists use triangulation of data from three or more seismic stations to determine the location of an earthquake epicenter and how early geologists used plotted epicenter positions to conceptualize crustal plate movements.
1) The document describes an activity where students analyze maps of earthquake epicenters, volcanic locations, and mountain ranges to understand the distribution of these features and determine the scientific basis for dividing the lithosphere into plates.
2) By overlaying plastic sheets with tracings of earthquake and volcano locations from the maps, students see that earthquakes, volcanoes, and mountains often occur near plate boundaries.
3) Analyzing these distributions helps students recognize that lithospheric plates move and interact at boundaries, causing earthquakes, volcanoes, and mountains to form in related patterns around the world.
Multi-phase volcanic resurfacing at Loki Patera on IoSérgio Sacani
The Jovian moon Io hosts the most powerful persistently active
volcano in the Solar System, Loki Patera1,2. The interior of this
volcanic, caldera-like feature is composed of a warm, dark floor
covering 21,500 square kilometres3 surrounding a much cooler
central ‘island’4. The temperature gradient seen across areas of
the patera indicates a systematic resurfacing process4–9, which
has been seen to occur typically every one to three years since the
1980s5,10. Analysis of past data has indicated that the resurfacing
progressed around the patera in an anti-clockwise direction at a
rate of one to two kilometres per day, and that it is caused either
by episodic eruptions that emplace voluminous lava flows or by a
cyclically overturning lava lake contained within the patera5,8,9,11.
However, spacecraft and telescope observations have been unable to
map the emission from the entire patera floor at sufficient spatial
resolution to establish the physical processes at play. Here we report
temperature and lava cooling age maps of the entire patera floor at
a spatial sampling of about two kilometres, derived from groundbased
interferometric imaging of thermal emission from Loki Patera
obtained on 8 March 2015 ut as the limb of Europa occulted Io.
Our results indicate that Loki Patera is resurfaced by a multi-phase
process in which two waves propagate and converge around the
central island. The different velocities and start times of the waves
indicate a non-uniformity in the lava gas content and/or crust bulk
density across the patera.
Materials Required· Computer and internet access· Textbook· AbramMartino96
Materials Required
· Computer and internet access
· Textbook
· Scientific calculator
· Spreadsheet software like Excel
· Digital camera
· Printer or drawing software
· Save this worksheet and use it as your report template
Time Required: Between 3-3.5 hours, note that depending if you use Excel (or similar), your time will be shortened.
Introduction
Figure 1: JP Stellar Revolution
The life cycle of the stars is one of the most fascinating studies of astronomy.Stars are the building blocks of galaxies and by looking at their age, composition and distribution we can learn a great deal about the dynamics and evolution of that galaxy. Stars manufacture the heavier elements including carbon, nitrogen and oxygen which in turn will determine the characteristics of the planetary systems that form around them. It is the mass of the star which will determine its life cycle and this all depends on the amount of matter that is available in its nebula. Each star will begin with a limited amount of hydrogen in their cores. This lifespan is proportional to (f M) / (L), where f is the fraction of the total mass of the star, M, available for nuclear burning in the core and L is the average luminosity of the star during its main sequence lifetime. The larger the mass, the shorter the lifespan ending in a beautiful supernova, the smaller the mass, the longer the lifespan ending as a quiet brown dwarf (Fig. 1).
Main Sequence Stars
Figure 2: https://imagine.gsfc.nasa.gov/
For this lab we will focus on stars similar to our own Sun (up to 1.4MassSun ), main sequence stars. A star that is similar in size to our Sun will take approximately 50 million years to mature from the beginning of their collapse to becoming an “adult” star. Our Sun, after reaching this mature phase, will stay on the main sequence of the HR-diagram for approximately 10 billion years (Fig. 2). Stars like our Sun are fueled by the nuclear fusion of hydrogen forming into helium at their cores. It is this outflow of energy that provides the outward pressure necessary to keep the star from collapsing under its own weight. And in turn, this energy determines the luminosity of the stars.
Death of Our Sun
Figure 3. NGC 6543
When a low mass star like our Sun has exhausted its supply of hydrogen in its core, then there will no longer be a source of heat to support the core against the pull of gravity. Hydrogen will continue to burn in a shell around the core and the star will evolve into the phase of a red giant, growing in diameter. The core of the star will collapse under the pull of gravity until it reaches a high enough density, and it will begin to burn helium and make carbon. This phase will last about 100 million years eventually exhausting the helium and then becoming a red supergiant, growing more in diameter. This is a more brief phase and last only a few tens of thousands of years and the star loses mass by expelling a strong wind. The star eventually loses the mass in its envelope, leav ...
The document discusses concepts related to plate tectonics including:
- The lithosphere is broken into plates that move slowly over time.
- Plates interact at boundaries which can cause earthquakes and volcanic activity.
- Maps show distributions of earthquakes, volcanoes, and mountains that relate to plate boundaries and plate interactions under the surface of the Earth.
This document provides instructions for an activity to locate the epicenter of an earthquake using the triangulation method. It includes hypothetical earthquake wave data from three seismic stations and instructions to compute distances from each station, draw circles representing those distances on a map, and find where the circles intersect, which would indicate the epicenter. It also includes questions about determining the epicenter location, potential difficulties, distance from a station, and importance of locating epicenters.
This document discusses a lesson on plate tectonics and locating the epicenter of an earthquake. The lesson objectives are to teach students how to locate an earthquake epicenter using triangulation from seismic data recorded at three stations. The document provides background on plate tectonics and earthquake terminology. It then presents a activity where students are given seismic data from three stations and asked to determine the epicenter using triangulation.
Part 1 Magnetic Anomalies The objective of this lab is to i.pdfrazak7861
Part 1: Magnetic Anomalies The objective of this lab is to introduce the concepts of Plate
Tectonics and how the plates move and interact with one another. One of the main things that will
be explored is the interactions at plate boundaries. Velocity is defined as the ratio of distance over
time. Mathematically: V=td Velocity is a vector, which has both direction and magnitude, meaning
that when we are exploring the velocities of these tectonic plates, we will look at both how fast the
plates are moving as well as which directions the plates move. To determine the velocities of
moving plates, we need two pieces of information: distance and time. Fortunately, volcanic rocks
can give us information about when they were created in the magnetic orientation of magnetite
crystals. These crystals align themselves with Earth's magnetic field, which will periodically switch
its polarity. We can use this information to help determine the time component of the velocity. Use
the map of Geoworld to answer the following questions. Step 1: Locate the mid-ocean ridge. The
magnetic anomalies will form a symmetric pattern moving away from the mid-ocean ridge.
Highlight the length of the ridge and label it "Hobbit Ridge", Step 2: Determine the relative rate of
movement of the spreading of the Elrond Sea. Use the scale on the map for the distance and the
ages of the magnetic reversals for the time. First determine the half spreading rate: the rate that
the continents are moving from the ridge. Then determine the full spreading rate: the rate that the
continents are moving from each other. Give your answer in mm/yr. Half Spreading Rate: Full
Spreading Rate:te concepts of Plate Tectonics he one ancther. Ome of the main ions at plate
boundaries. over time. Mathematically: tion and magnitude, meaning that rese tectonic plates, we
will look well as which directions the plates ites, we need two pieces of ly, volcanic rocks can give
us in the magnetic orientation of iemselves with Earth's magnetic olarity. We can use this mponent
of the velocity. ollowing questions. rement of the spreading of the the distance and the ages of the
mine the half spreading rate: the be ridge. Then determine the full are moving from each other.
Spreading Rate: Spreading Rate:.
The document contains a 10 question quiz about the electromagnetic spectrum and related topics like radiation, global warming, and the greenhouse effect. The questions cover topics such as the different types of radiation, how they are used and their effects, how food is cooked in microwaves, what gases cause global warming, and what the greenhouse effect has on Earth.
The Habitability of PlanetsMarch 28, 20201 Background.docxrtodd33
The Habitability of Planets
March 28, 2020
1 Background
The presence of liquid water is considered to be a prerequisite for life as we know it, which
makes looking for water a practical way to begin our search for life beyond Earth. For water
to exist on the surface of a planet, the planet must have the right temperature on its surface.
The main driving force behind the surface temperature of any planet is the light it receives
from its parent star. Around every star there is a region where the planet will receive just
the right amount of light to give it temperatures that are conducive to liquid water - this
region is call the star’s Habitable Zone. The orbit of the Earth currently falls within the
Habitable Zone of our Sun.
2 The Habitability of the Earth
To begin, load up the Habitable Zone simulator written by the University of Nebraska by
entering the following URL in the address bar of your web browsers:
http://astro.unl.edu/naap/habitablezones/animations/stellarHabitableZone.html
The flash simulator will show you a visual diagram of the solar system in the top panel,
a set of simulation settings in the middle panel, and a timeline of the habitability of the
Earth in the bottom panel. To run the simulation, click the run in the bottom panel. This
button immediately becomes a pause button which will allow you to pause the simulation
at any time. To restart the simulation, press the restart button at the very top of the
simulation.
The blue region marked on the diagram is the Habitable Zone around our Sun. Notice
how there is both an inner edge and an outer edge - the planets interior to the habitable
zone are too hot to support liquid water, while the planets exterior to it are too cold.
1) The simulation is currently set to zero-age - this is the Solar System as it was when
it first formed, 5 billion years ago. Which planets were in the Habitable Zone at this time?
1
http://astro.unl.edu/naap/habitablezones/animations/stellarHabitableZone.html
2) Press the start button and watch the Habitable Zone change with time. Pause the
simulation when it reaches an age of 5 billion years (you can keep track of the time by looking
at the timeline marker in the bottom panel). This is the Solar System as it is today - which
planets are in the Habitable Zone now?
3) Allow the simulation to run until the Earth is no longer in the Habitable Zone. At
what age does this happen? How long from now until this happens? You can use the timeline
bar in the bottom panel to determine your answers. .
4) After the Earth is no longer within the Habitable Zone, what do you think the condi-
tions on Earth will be like?
5) Resume the simulation and let it run until the end. Which planets other than the
Earth fell within the Habitable Zone at any point during the Sun’s life?
6) If you had to choose planets of our Solar System for future colonization based on their
future habitability, which would you choose, and why?
3 The Habitability Different Kinds .
Earthquake seismology uses seismic waves generated by earthquakes to study the interior of the Earth. Seismic waves are detected by seismographs and include P-waves, S-waves, and surface waves. The location and depth of the initial rupture point within the Earth is known as the hypocenter and epicenter, respectively. Larger earthquakes with shallower depths typically cause more damage. Earthquake magnitude represents the energy released while intensity refers to the strength of shaking experienced at a particular location.
This document is the lesson plan for an online Science class about earthquakes and faults. It includes an opening prayer, attendance instructions using emojis, class rules, and an overview of the key concepts that will be covered such as the different types of faults, epicenters, focuses, magnitudes, and intensities. The lesson also provides directions and questions for students to differentiate these terms. Students are assigned a task to create a video demonstrating how to protect themselves during an earthquake. At the end, there is a discussion for students to share their earthquake experiences and ideas.
The document provides information on an educational material in English for secondary students on Earth's internal energy, including its goals of explaining how the planet's internal energy causes geological transformations and phenomena like volcanoes and earthquakes. It discusses concepts like tectonic plates and continental drift, providing activities for students to learn vocabulary, describe processes, and understand the evidence for plate tectonics theory. The material would take approximately 9 sessions to complete and aims to develop students' skills in areas like science, digital literacy, and social awareness.
Deadline is on Tuesday ,September 16 th2014I would like to .docxtheodorelove43763
Deadline is on Tuesday ,September 16 th/2014
I would like to have a design of the four broadcast protocols using a written description with the graphic representation showing how the design looks like and how information/communication happen between nodes beside the details explanation using scenarios to estimate the complexity.
Each of the designs should have an evaluation of the efficiency in the context of message complexity and round complexity.
The design should be based on a cube system with 8 nodes using
1. message-passing model
2. shared-memory model
3. mobile agent communication model
So the final work will have a total of 4 graphic designs with use case scenarios for each design to explain and calculate the complexity and efficiently of each design. The efficiency would be calculated for each design in term of message complexity and round complexity. Then decide on the best protocol among the proposed designs based on the efficiency.
geology2.pdf
geology1.pdf
1
Plate Tectonics Name: ________________
INTRODUCTION
Plate tectonics is a well established theory that unifies and provides a framework for
all geologic observations. Most geologic phenomenon observed near the Earth’s
surface are linked in some way to plate tectonic processes. The theory states that the
outer 60-100 km of the Earth is divided into slabs of rigid rock (the lithosphere). These
slabs (the plates) rest upon a semi-viscous layer of easily deformable rock (the
asthenosphere). Thermal convection within the asthenosphere pushes the plates in
horizontal directions at rates ranging from 1 cm to 12 cm/year. This causes the plates
to move in relation to one another. Boundaries between the 8 principle plates and
several smaller plates are zones of rock deformation, earthquakes and volcanism.
This lab utilizes real data that demonstrates and/or validates the theory of Plate
Tectonics. Four exercises, modified from Jones and Jones (2003), follow.
o Part A examines global maps of tectonic plate boundaries and earthquake data
to identify plate boundary locations and assess relative motion between the
plates.
o Part B uses maps of the ocean floor to calculate spreading rates across a mid-
oceanic ridge in the South Pacific.
o Part C interprets maps and utilizes geologic ages for Hawaiian Islands to better
understand movement of the underlying Pacific plate over a “hot spot”.
o Part D examines a geologic map along a portion of the San Andreas Fault to
evaluate the direction and rate of plate movement.
OBJECTIVES
Upon completion of this exercise, you will be able to understand:
1. basic differences between major types of plate boundaries.
2. magnetic stripping and use it to calculate spreading rates
3. the concept of “hot spots” and use this understanding to determine the speed
and direction of movement of plates
4. how to interpret a geological map of the San Andreas Fault and calculate the
rate of movement al.
Published by Mining Matters this secondary school thematic resources uses the topic of diamonds to explore Earth's structure and process, the mining cycle as well a careers in the minerals industry.
The 21 activities in Discovering Diamonds bring in elements from every area of Earth Science – from earthquakes to environment, cratons to chemicals. Activities are presented in sequence in five topics, starting with the large-scale structure of the earth, moving into tectonic and surficial processes, and finishing with a look at the mining industry, including exploration, mining, processing, and mining’s importance to Canadians.
Students will learn about Canada’s world-class diamond-bearing deposits, diamond formation, and the modern technology being applied to the discovery, extraction, and processing of diamonds. The diamond industry uses cutting-edge technology; current information about this industry makes a valuable addition to the school Earth Science curriculum.
The document is a self-learning module that describes plate tectonic theory and the distribution of active volcanoes, earthquake epicenters, and major mountain belts. It includes pre-tests and post-tests for students to assess their understanding. The key points are that plate tectonic theory states the lithosphere is made up of plates that move and interact at boundaries, and that volcanoes, earthquakes and mountains are located near these plate boundaries as a result of the interactions between plates. Students learn about the distribution of these features and take quizzes to relate this to plate tectonic theory.
The document discusses the distribution of active volcanoes, earthquake epicenters, and major mountain belts in relation to plate tectonic theory. It notes there are 53 active volcanoes in the Philippines located along two volcanic arcs. Volcanoes are described as active if they erupt regularly and dormant if they have erupted in the past but are currently inactive. Familiar active volcanoes in the Philippines include Taal, Pinatubo, and Mayon. Earthquake epicenters can be located using triangulation based on the differences in arrival times of P and S waves recorded by seismographs located in at least three different locations. Mountain belts often form near plate boundaries due to the movement and collisions of tectonic
Page 65 4.1 InTroduCTIonIn chapter one, we reviewed th.docxalfred4lewis58146
Page | 65
4.1 InTroduCTIon
In chapter one, we reviewed the scientific method and the exact meaning of a
theory, which is a well-supported explanation for a natural phenomenon that still
cannot be completely proven. A Grand Unifying Theory is a set of ideas that
is central and essential to a field of study such as the theory of gravity in physics
or the theory of evolution in biology. The Grand Unifying Theory of geology is the
theory of Plate Tectonics, which defines the outer portion of the earth as a brit-
tle outer layer that is broken into moving pieces called tectonic plates. This the-
ory is supported by many lines of evidence including the shape of the continents,
the distribution of fossils and rocks, the distribution of environmental indicators,
as well as the location of mountains, volcanoes, trenches, and earthquakes. The
movement of plates can be observed on human timescales and easily measured
using GPS satellites.
Plate tectonics is integral to the study of geology because it aids in reconstruct-
ing earth’s history. This theory helps to explain how the first continents were built,
how oceans formed, and even helps inform hypotheses for the origin of life. The
theory also helps explain the geographic distribution of geologic features such as
mountains, volcanoes, rift valleys, and trenches. Finally, it helps us assess the po-
tential risks of geologic catastrophes such as earthquakes and volcanoes across
the earth. The power of this theory lies in its ability to create testable hypotheses
regarding Earth’s history as well as predictions regarding its future.
4.1.1 learning outcomes
After completing this chapter, you should be able to:
• Explain several lines of evidence supporting the movement of tectonic plates
• Accurately describe the movement of tectonic plates through time
• Describe the progression of a Hawaiian Island and how it relates to the
Theory of Plate Tectonics
4Plate TectonicsBradley Deline
Page | 66
Introductory GeoloGy Plate tectonIcs
• Describe the properties of tectonics plates and how that relates to the
proposed mechanisms driving plate tectonics
• Be able to describe and identify the features that occur at different plate
boundaries
4.1.2 Key Terms
4.2 evIdenCe of The movemenT of ConTInenTs
The idea that the continents appear to have been joined based on their shapes is
not new, in fact this idea first appeared in the writings of Sir Francis Bacon in 1620.
The resulting hypothesis from this observation is rather straightforward: the shapes
of the continents fit together because they were once connected and have since bro-
ken apart and moved. This hypothesis is discussing a historical event in the past and
cannot be directly tested without a time machine. Therefore, geoscientists reframed
the hypothesis by assuming the continents used to be connected and asking what
other patterns we would expect to find. This is exactly how turn of the century earth
scientists (.
Lesson 1 describes earthquakes and faults. It defines key terms like fault, focus, and epicenter. Faults occur along breaks in the earth's crust where significant movement has taken place. There are two main types of faults: dip-slip faults which involve vertical movement, and strike-slip faults which involve horizontal movement. The focus is where an earthquake originates within the fault plane, while the epicenter is the point directly above on the surface. The lesson provides safety tips for before, during, and after an earthquake occurs.
Earthquakes occur when tectonic plates slip past one another at plate boundaries, releasing stored energy in seismic waves. The location below ground where it starts is the hypocenter, above which at the surface is the epicenter. Scientists measure earthquakes using seismographs which record seismic waves on seismograms to determine magnitude based on wave amplitude and fault size. Triangulation of arrival times between P and S waves at multiple stations locates the hypocenter. While earthquakes cannot be predicted, some speculation exists that weather or animal behavior may provide warning signs.
Earthquakes occur when tectonic plates slip past one another at plate boundaries, releasing stored energy in seismic waves. The location below ground where it starts is the hypocenter, above which at the surface is the epicenter. Scientists measure earthquakes using seismographs which record seismic waves on seismograms to determine magnitude based on wave amplitude and fault size. Triangulating arrival times of P and S waves at multiple stations allows scientists to locate the earthquake epicenter but not predict when future quakes will occur.
Earthquakes occur when tectonic plates slip past one another at plate boundaries, releasing stored energy in seismic waves. The location below ground where it starts is the hypocenter, above which at the surface is the epicenter. Scientists measure earthquakes using seismographs which record seismic waves on seismograms to determine magnitude based on wave amplitude and fault size. Triangulation of arrival times between P and S waves at multiple stations locates the hypocenter. While earthquakes cannot be predicted, some research investigates possible links to weather or animal behavior.
The document provides information about the structure and composition of Earth's interior. It is divided into three main layers: the crust, mantle, and core. The crust is the outermost layer and is thinner oceanic crust under the oceans. The mantle lies below the crust and makes up the majority of Earth's volume. It is solid but can flow slowly. The core is at the center and has a solid inner core surrounded by a liquid outer core. Seismic waves have provided evidence about the composition and properties of these layers.
The document provides an overview of a course on Earth science and the universe. It includes 12 lessons covering topics like mapping the seafloor, plate tectonics, earthquakes and volcanoes, the origin of the universe, the solar system, what we are made of, the extinction of dinosaurs, and whether life exists elsewhere. The first lesson introduces concepts of time, space, the structure of Earth, and the rock cycle. Subsequent lessons will explore these topics in more depth.
Immersive Learning That Works: Research Grounding and Paths ForwardLeonel Morgado
We will metaverse into the essence of immersive learning, into its three dimensions and conceptual models. This approach encompasses elements from teaching methodologies to social involvement, through organizational concerns and technologies. Challenging the perception of learning as knowledge transfer, we introduce a 'Uses, Practices & Strategies' model operationalized by the 'Immersive Learning Brain' and ‘Immersion Cube’ frameworks. This approach offers a comprehensive guide through the intricacies of immersive educational experiences and spotlighting research frontiers, along the immersion dimensions of system, narrative, and agency. Our discourse extends to stakeholders beyond the academic sphere, addressing the interests of technologists, instructional designers, and policymakers. We span various contexts, from formal education to organizational transformation to the new horizon of an AI-pervasive society. This keynote aims to unite the iLRN community in a collaborative journey towards a future where immersive learning research and practice coalesce, paving the way for innovative educational research and practice landscapes.
The ability to recreate computational results with minimal effort and actionable metrics provides a solid foundation for scientific research and software development. When people can replicate an analysis at the touch of a button using open-source software, open data, and methods to assess and compare proposals, it significantly eases verification of results, engagement with a diverse range of contributors, and progress. However, we have yet to fully achieve this; there are still many sociotechnical frictions.
Inspired by David Donoho's vision, this talk aims to revisit the three crucial pillars of frictionless reproducibility (data sharing, code sharing, and competitive challenges) with the perspective of deep software variability.
Our observation is that multiple layers — hardware, operating systems, third-party libraries, software versions, input data, compile-time options, and parameters — are subject to variability that exacerbates frictions but is also essential for achieving robust, generalizable results and fostering innovation. I will first review the literature, providing evidence of how the complex variability interactions across these layers affect qualitative and quantitative software properties, thereby complicating the reproduction and replication of scientific studies in various fields.
I will then present some software engineering and AI techniques that can support the strategic exploration of variability spaces. These include the use of abstractions and models (e.g., feature models), sampling strategies (e.g., uniform, random), cost-effective measurements (e.g., incremental build of software configurations), and dimensionality reduction methods (e.g., transfer learning, feature selection, software debloating).
I will finally argue that deep variability is both the problem and solution of frictionless reproducibility, calling the software science community to develop new methods and tools to manage variability and foster reproducibility in software systems.
Exposé invité Journées Nationales du GDR GPL 2024
ESPP presentation to EU Waste Water Network, 4th June 2024 “EU policies driving nutrient removal and recycling
and the revised UWWTD (Urban Waste Water Treatment Directive)”
ESR spectroscopy in liquid food and beverages.pptxPRIYANKA PATEL
With increasing population, people need to rely on packaged food stuffs. Packaging of food materials requires the preservation of food. There are various methods for the treatment of food to preserve them and irradiation treatment of food is one of them. It is the most common and the most harmless method for the food preservation as it does not alter the necessary micronutrients of food materials. Although irradiated food doesn’t cause any harm to the human health but still the quality assessment of food is required to provide consumers with necessary information about the food. ESR spectroscopy is the most sophisticated way to investigate the quality of the food and the free radicals induced during the processing of the food. ESR spin trapping technique is useful for the detection of highly unstable radicals in the food. The antioxidant capability of liquid food and beverages in mainly performed by spin trapping technique.
Authoring a personal GPT for your research and practice: How we created the Q...Leonel Morgado
Thematic analysis in qualitative research is a time-consuming and systematic task, typically done using teams. Team members must ground their activities on common understandings of the major concepts underlying the thematic analysis, and define criteria for its development. However, conceptual misunderstandings, equivocations, and lack of adherence to criteria are challenges to the quality and speed of this process. Given the distributed and uncertain nature of this process, we wondered if the tasks in thematic analysis could be supported by readily available artificial intelligence chatbots. Our early efforts point to potential benefits: not just saving time in the coding process but better adherence to criteria and grounding, by increasing triangulation between humans and artificial intelligence. This tutorial will provide a description and demonstration of the process we followed, as two academic researchers, to develop a custom ChatGPT to assist with qualitative coding in the thematic data analysis process of immersive learning accounts in a survey of the academic literature: QUAL-E Immersive Learning Thematic Analysis Helper. In the hands-on time, participants will try out QUAL-E and develop their ideas for their own qualitative coding ChatGPT. Participants that have the paid ChatGPT Plus subscription can create a draft of their assistants. The organizers will provide course materials and slide deck that participants will be able to utilize to continue development of their custom GPT. The paid subscription to ChatGPT Plus is not required to participate in this workshop, just for trying out personal GPTs during it.
The debris of the ‘last major merger’ is dynamically youngSérgio Sacani
The Milky Way’s (MW) inner stellar halo contains an [Fe/H]-rich component with highly eccentric orbits, often referred to as the
‘last major merger.’ Hypotheses for the origin of this component include Gaia-Sausage/Enceladus (GSE), where the progenitor
collided with the MW proto-disc 8–11 Gyr ago, and the Virgo Radial Merger (VRM), where the progenitor collided with the
MW disc within the last 3 Gyr. These two scenarios make different predictions about observable structure in local phase space,
because the morphology of debris depends on how long it has had to phase mix. The recently identified phase-space folds in Gaia
DR3 have positive caustic velocities, making them fundamentally different than the phase-mixed chevrons found in simulations
at late times. Roughly 20 per cent of the stars in the prograde local stellar halo are associated with the observed caustics. Based
on a simple phase-mixing model, the observed number of caustics are consistent with a merger that occurred 1–2 Gyr ago.
We also compare the observed phase-space distribution to FIRE-2 Latte simulations of GSE-like mergers, using a quantitative
measurement of phase mixing (2D causticality). The observed local phase-space distribution best matches the simulated data
1–2 Gyr after collision, and certainly not later than 3 Gyr. This is further evidence that the progenitor of the ‘last major merger’
did not collide with the MW proto-disc at early times, as is thought for the GSE, but instead collided with the MW disc within
the last few Gyr, consistent with the body of work surrounding the VRM.
Current Ms word generated power point presentation covers major details about the micronuclei test. It's significance and assays to conduct it. It is used to detect the micronuclei formation inside the cells of nearly every multicellular organism. It's formation takes place during chromosomal sepration at metaphase.
hematic appreciation test is a psychological assessment tool used to measure an individual's appreciation and understanding of specific themes or topics. This test helps to evaluate an individual's ability to connect different ideas and concepts within a given theme, as well as their overall comprehension and interpretation skills. The results of the test can provide valuable insights into an individual's cognitive abilities, creativity, and critical thinking skills
The technology uses reclaimed CO₂ as the dyeing medium in a closed loop process. When pressurized, CO₂ becomes supercritical (SC-CO₂). In this state CO₂ has a very high solvent power, allowing the dye to dissolve easily.
Travis Hills' Endeavors in Minnesota: Fostering Environmental and Economic Pr...Travis Hills MN
Travis Hills of Minnesota developed a method to convert waste into high-value dry fertilizer, significantly enriching soil quality. By providing farmers with a valuable resource derived from waste, Travis Hills helps enhance farm profitability while promoting environmental stewardship. Travis Hills' sustainable practices lead to cost savings and increased revenue for farmers by improving resource efficiency and reducing waste.
EWOCS-I: The catalog of X-ray sources in Westerlund 1 from the Extended Weste...Sérgio Sacani
Context. With a mass exceeding several 104 M⊙ and a rich and dense population of massive stars, supermassive young star clusters
represent the most massive star-forming environment that is dominated by the feedback from massive stars and gravitational interactions
among stars.
Aims. In this paper we present the Extended Westerlund 1 and 2 Open Clusters Survey (EWOCS) project, which aims to investigate
the influence of the starburst environment on the formation of stars and planets, and on the evolution of both low and high mass stars.
The primary targets of this project are Westerlund 1 and 2, the closest supermassive star clusters to the Sun.
Methods. The project is based primarily on recent observations conducted with the Chandra and JWST observatories. Specifically,
the Chandra survey of Westerlund 1 consists of 36 new ACIS-I observations, nearly co-pointed, for a total exposure time of 1 Msec.
Additionally, we included 8 archival Chandra/ACIS-S observations. This paper presents the resulting catalog of X-ray sources within
and around Westerlund 1. Sources were detected by combining various existing methods, and photon extraction and source validation
were carried out using the ACIS-Extract software.
Results. The EWOCS X-ray catalog comprises 5963 validated sources out of the 9420 initially provided to ACIS-Extract, reaching a
photon flux threshold of approximately 2 × 10⁻⁸ photons cm−2
s
−1
. The X-ray sources exhibit a highly concentrated spatial distribution,
with 1075 sources located within the central 1 arcmin. We have successfully detected X-ray emissions from 126 out of the 166 known
massive stars of the cluster, and we have collected over 71 000 photons from the magnetar CXO J164710.20-455217.
The binding of cosmological structures by massless topological defectsSérgio Sacani
Assuming spherical symmetry and weak field, it is shown that if one solves the Poisson equation or the Einstein field
equations sourced by a topological defect, i.e. a singularity of a very specific form, the result is a localized gravitational
field capable of driving flat rotation (i.e. Keplerian circular orbits at a constant speed for all radii) of test masses on a thin
spherical shell without any underlying mass. Moreover, a large-scale structure which exploits this solution by assembling
concentrically a number of such topological defects can establish a flat stellar or galactic rotation curve, and can also deflect
light in the same manner as an equipotential (isothermal) sphere. Thus, the need for dark matter or modified gravity theory is
mitigated, at least in part.
4. Unit 1: Earth and Space
Overview
In your Grade 9 Science, part of your lessons was about
volcanoes. You have learned about the position of the
Philippines in the Ring of Fire and its relationship to the
presence of active and inactive volcanoes in our country.
In this quarter, the topics will focus solely on a theory that
explains the existence of volcanoes and other geologic features.
You have two modules to understand this theory better.
In the first module, you will use some of your science
skills such as graphing, measuring, analyzing and interpreting
data, and inferring for you to attain the desired outcomes.
5. What are the outcomes that are expected from you? First, you should
identify the types of boundaries created because of lithospheric
movements. Secondly, you must relate the movement of Earth’s
lithosphere to the occurrence of different geologic changes. And
finally, you will explain the processes that are taking place along the
boundaries.
In the second module, you will perform an activity that will
allow you to probe the Earth’s interior by analyzing the behavior of
seismic waves (Primary and Secondary waves). You will also have an
opportunity to simulate one of the properties of the materials present
in the mantle.
Lastly, included in the module, and the most important part is
the series of activities that will give you an idea about the driving
mechanism behind the motion of Earth’s lithosphere.
6. PLATE TECTONICS
I. Introduction
Our country is blessed with so many land features
such as mountains and volcanoes. These features can be
sources of different minerals or can be used for
agricultural purposes. For example, we have the majestic
and world renowned Mayon Volcano. Because of its
activity, it produces fertile slopes and plains which are
used by the locals to grow their crops. Also, found in the
northeastern coast of Luzon, we have the Sierra Madre
mountain range which is home to many endemic species
of flora and fauna.
7. Have you ever wondered why our country is endowed with
these kind of geologic features? Well, if your answer is YES, then this
module will help you find the answer to your question.
In this module, we will study thoroughly the framework that
will enable us to understand how and why several features of the
Earth continuously change. This theory is what we call “Plate
Tectonics.”
This describes the events within the Earth that give rise to
mountain ranges, volcanoes, earthquake belts, and other features of
the Earth’s surface.
At the end of Module 1, you are expected to answer the key
question below:
What is the relationship among the locations of volcanoes,
earthquake epicenters, and mountain ranges?
8. What is Plate Tectonics?
Earth’s lithosphere consists of layers, the crust
and the upper part of the mantle. This part of the
module will focus on the outermost layer which is
called crust.
The crust is made of a variety of solid rocks like
sedimentary, metamorphic, and igneous. It has an
average density of 2.8 g/cm3 and its thickness ranges
from 5 to 50 km. The crust is thickest in a part where
a relatively young mountain is present and thinnest
along the ocean floor.
10. You will notice from Figure 1 that there
are two kinds of crust: the thicker but
less dense continental crust and the
oceanic crust which is relatively thinner
but denser than continental crust.
According to the plate tectonics model,
the entire lithosphere of the Earth is
broken into numerous segments called
plates (see Figure 2).
12. As shown in Figure 2, there are seven relatively
large plates and a number of smaller ones,
including the Philippine plate. The plates move
very slowly but constantly, and this movement is
called tectonics; thus the theory of moving
lithospheric plates is called plate tectonics.
Before we study more about plate tectonics,
let’s discuss first one of the consequences of moving
crustal plates which is crucial in studying plate
tectonics: earthquake.
13. You have learned in your Grade 8 Science that an
earthquake releases three types of seismic waves; Primary
(P-waves), Secondary (S-waves), and Long surface waves
(L-waves). The first two travel into the Earth’s interior
while the last one on the surface. These waves travel at
different velocities; thus, do not arrive at a seismic
recording station at the same time. The farther the
recording instrument is from the focus, the greater the
difference in arrival times of the first P-wave compared to
the first S-wave. The difference in the arrival time will tell
us the distance of the earthquake’s focus from the seismic
recording station. However, it does not tell in which
direction it came from.
14. If we have at least three recording stations that can
tell how far away from them the earthquake occurred,
the epicenter can be determined using the triangulation
method. It uses distance information from three seismic
stations to locate the earthquake epicenter. On a map,
circles are drawn around each seismic station. The radii
of the circles are scaled to the estimated distance from
the station to the earthquake. The three circles will
intersect at one point that locates the earthquake.
The next activity will give you a first-hand
experience on how to locate earthquake epicenter.
15. Activity 1
Find the Center
Objective:
Locate the epicenter of an earthquake using the
triangulation method.
Materials:
• hypothetical records of earthquake waves
• Philippine map
• drawing compass, ruler and calculator
16. Procedure:
1. Study the data showing the difference in the arrival time of P-wave and
S-wave on three seismic recording stations.
Recording Station Time difference
(seconds)
Distance of epicenter
from the station
km cm
Batangas 36.8
Puerto Princesa 44
Davao 44.8
17. 2. Compute the distance of the epicenter from each of the
stations using this formula:
d = Td x 100 km
8 seconds
Where: d = distance (km)
Td = time difference in the arrival time of P-wave and S-wave
(seconds)
This formula is suited because 8 seconds is the interval
between the times of arrival of the P-wave and S-wave at a
distance of 100 km.
18. 3. Choose one of the recording stations and measure
the computed distance on the map scale (the scale of
the map in Figure 3 is 1.5 cm: 200 km). Set your
compass for that computed distance.
4. Center your compass on the station you have
chosen. Draw a circle.
5. Repeat steps 3 and 4 for the rest of the stations. You
should get three circles that intersect or nearly
intersect at a point. This intersection is the epicenter.
19.
20. Q1. Where is the epicenter of this hypothetical
earthquake?
Q2. What difficulty will you encounter if you only have
data from two recording stations?
In the previous activity, the hypothetical earthquake
happened locally, that is why we use the formula stated
in the procedure. But, if the earthquake took place at a far
greater distance, seismologists use the distance-time
graph similar to the figure below in determining the
location of the epicenter.
22. The distance-time graph above shows that the S-P interval
is about 10 minutes.
Q3. What is the distance of the epicenter from the seismic
station?
Q4. What do you think is the importance of determining the
epicenter of an earthquake?
Determining the location of earthquake epicenters plays a
vital role in laying the foundations of plate tectonics. Let us see
how early geologists used the plotted positions of earthquake
epicenters throughout the world in conceptualizing crustal
movements.
23. Activity 2
Let’s Mark the Boundaries
Objectives:
• Describe the distribution of active volcanoes, earthquake
epicenters, and major mountain belts.
• Determine the scientific basis for dividing the Lithospheric plates.
Materials:
• Figure 5: Map of earthquake distribution
• Figure 6: Map of active volcanoes of the world
• Figure 7: Mountain ranges of the world
• 2 pieces plastic sheet used for book cover, same size as a book
page
• marking pens (two different colors)
24. Figure 5. Map of earthquake distribution (Red, green, and blue dots represent earthquake epicenters)
25. Procedure:
1. Study Figure 5 showing the earthquake distribution
around the world. Trace the approximate locations of
several earthquake “clusters” using a marking pen on
one of the plastic sheets.
Q5. How are earthquakes distributed on the map?
Q6. Where are they located?
Q7. Where are there no earthquakes?
Q8. Why is it important for us to identify areas which
are prone to earthquakes?
26. Figure 6. Map of active volcanoes (Red areas represent presence of volcanoes)
27. 2. Study the map of active volcanoes in Figure 6.
Q9. How are volcanoes distributed?
Q10. Where are they located?
Q11. Based on the map, mention a country that is unlikely
to experience a volcanic eruption.
3. On the second plastic sheet, sketch the approximate
locations of several volcanoes using a marking pen.
4. Place the earthquake plastic sheet over the volcano plastic
sheet.
Q12. Compare the location of majority of earthquake
epicenters with the location of volcanoes around the world.
29. 5. Study Figure 7, the orange portions indicate mountain ranges of the
world.
Q13. How will you relate the distribution of mountain ranges with the
distribution of earthquake epicenters and volcanoes?
6. Now that you have seen the location of volcanoes, mountain ranges,
and majority of earthquake epicenters, study Figure 2 on page 7, Map of
Plate boundaries once more.
Q14. What do you think is the basis of scientists in dividing Earth’s
lithosphere into several plates?
The places on Earth where most of the earthquakes originated or
some mountains and volcanoes were formed mark the boundaries of
each lithospheric plate. As mentioned earlier, each plate is slowly moving
relative to each other, causing geologic events to happen along their
boundaries.
30. Figure 8. Map showing the relative motion of plates (Arrows indicate the direction of motion)
32. 1. Divergent Plate Boundary- Plates move apart, creating
a tension. The Mid-Atlantic ridge is an example.
2. Convergent Plate Boundary- Two plates are moving
toward each other. Example is the Philippine plate
and the Eurasian plate
3. Transform Fault Boundary- Plates slide or grind past
each other without diverging or converging. The best
example of this plate boundary is the San Andreas
fault which is bounded by the North American plate
and the Pacific plate.
34. Activity 3
Head-On Collision
Part A: Converging Continental Plate and Oceanic Plate
Objectives:
• Explain the processes that occur along convergent
boundaries.
• Determine the consequences of colliding plates.
Procedure:
1. Study Figure 10 showing a cross-sectional diagram of
plates that are converging, and answer the questions that
follows.
36. Q15. What type of plate is Plate A? What about Plate B?
Why do you say so?
Q16. Describe what happens to Plate A as it collides with
Plate B? Why?
Q17. What do you think may happen to the leading edge of
Plate A as it continues to move downward? Why?
Q18. What do you call this molten material?
Q19. What is formed on top of Plate B?
Q20. As the plates continue to grind against each other,
what other geologic event could take place?
37. Converging Oceanic Crust Leading Plate and Continental
Crust Leading Plate
The previous activity depicts what happens during collision of two
plates; one has continental edge while the other has an oceanic
edge. From the diagram, it is clear that this event gives rise to the
formation of a volcanic arc near the edge of a continental leading
plate. The reason for this is because the denser oceanic crust (Plate
A) undergoes what we call subduction process or the bending of
the crust towards the mantle. Since the mantle is hotter than the
crust, the tendency is, the subducted crust melt forming magma.
Addition of volatile material such as water will cause the magma to
become less dense, hence allowing it to rise and reach the crust once
again and causing volcanic activities on the continental leading
plate.
38. SUBDUCTION- an event in which a slab of rock thrusts
into the mantle.
EFFECTS OF CONVERGING CONTINENTAL PLATE
AND OCEANIC PLATE
TRENCH - Also called submarine valleys, formed when
continental and oceanic plate collide. Ocean trenches are
the deepest part of the ocean. One of the deepest is the
Philippine trench with a depth of 10 540 meters.
EARTHQUAKE- The subduction of plate can
cause earthquakes at varying depths.
39. Activity 3
Head-On Collision
Part B: Convergence of Two Oceanic Plates
Procedure:
1. Study Figure 11. It shows a cross-section of two
converging oceanic plates.
2. Using your knowledge gained from the
previous activity, identify the geologic events or
features resulting from this collision.
41. Q21. What are the geologic processes/events
that will occur because
of this plate movement?
Q22. What geologic features might form at the
surface of Plate A?
Q23. If the edge of Plate A suddenly flicks
upward, a large amount of water may be
displaced. What could be formed at the surface
of the ocean?
42. Convergence of Oceanic Plates
Like the first type of convergent boundaries discussed
earlier, converging oceanic plates will cause formation of
trenches, and these trenches will become sources of earthquakes.
Underwater earthquakes, especially the stronger ones, can
generate tsunamis. The Japanese term for “harbor wave,” tsunami
is a series of ocean waves with very long wavelengths (typically
hundreds of kilometers) caused by large-scale disturbances of the
ocean. The leading edge of the subducted plate will eventually
reach the mantle causing it to melt and turn into magma. The
molten material will rise to the surface creating a volcanic island
arc parallel to the trench. Volcanic island arc is a chain of
volcanoes position in an arc shape as seen in figure below.
44. Formation of the Philippine Archipelago
Many parts of the Philippines originated from oceanic-
oceanic convergence. This resulted from the collision of two
oceanic plates, with one of the plates diving under the other.
Majority of the islands in the Philippine archipelago are
considered as part of the Philippine Mobile Belt. These islands
were formed 65 million years ago at the southern edge of the
Philippine Sea Plate and are considered as part of island arcs.
Other parts of the Philippines, such as Palawan, Mindoro, and
the Zamboanga Peninsula are all highland sections of the
Sundaland block of the Eurasian plate (see Figure 13).
45. Figure 13. Sundaland block of Eurasian Plate which includes Palawan, Mindoro, and
Zamboanga
46. `The Philippine Mobile Belt eventually
collided with the Sundaland block which
explains the presence of trenches, such as the
Manila Negros-Cotabato Trench System, and
the Sulu Trench, as shown in Figure 14.
On the eastern side of the Philippines,
trenches like the Philippine Trench and East
Luzon Trough are both products of
subducting Philippine Sea Plate beneath the
archipelago.
49. Aside from the formation of trenches and troughs, the
downward movement of oceanic lithospheres underneath
the Philippine Archipelago creates active volcanic chains.
For example, the descent of the West Philippine Sea oceanic
lithosphere along the Manila Trench created a volcanic
chain from Taiwan to Mindoro. Some of the known active
volcanoes in this chain are Pinatubo in Central Luzon and
Taal in Batangas.
Also, the constant dipping movement of slabs induces
frequent moderate to strong earthquakes at various depths,
gives rise to mountain ranges and develops the geologic
character of the Philippine Archipelago.
50. Activity 3
Head-On Collision
Part C: Two Continental Plates Converging
Materials:
• modeling clay
• 2 blocks of wood
• paper
Procedure:
1. On a piece of paper, flatten the modeling clay with the palm of your
hand.
2. Cut the clay into four strips; each strip should be 0.5 cm thick, 4 cm wide,
and 12 cm long.
3. Put 4 strips one on top of the other.
4. Place a block of wood at each end of the clay strips and slowly push the
two blocks together. Observe what happens to the clay.
51.
52. Q24. What happened to the strips of clay as they were
pushed from opposite ends?
Q25. If the strips of clay represent the Earth’s
lithosphere, what do you think is formed in the
lithosphere?
Q26. What other geologic event could take place with
this type of plate movement aside from your answer in
Q25?
Q27. In terms of the consequences on the Earth’s
lithosphere, how will you differentiate this type of
convergent plate boundary with the other two?
53. When two continental plates
converge, a collision zone is formed.
Unlike the other two types of convergent
boundaries, subduction ceases for this
particular type of convergence. No trench,
no volcano, and definitely no island arc
are created during this process. Instead,
what is created is a large group of tall
mountains called mountain range.
55. About 40 to 50 million years ago, two
large land masses, India and Eurasia, collided
to begin the formation of the most visible
product of plate tectonics - the Himalayas.
Since subduction is impossible between two
colliding continental plates, pressure is
released by pushing the crusts upward and
forming the Himalayan peaks.
Also, collision of continental plates is
associated with shallow earthquake activities.
57. Activity 4
Going Separate Ways
Objectives:
• Explain the processes that occur along divergent
boundaries.
• Determine the results of plates that are moving apart.
Materials:
photographs of Rift Valleys and Oceanic Ridges
Procedure:
1. Analyze the photographs of rift valleys (topmost
pictures) and oceanic ridges below, and answer the
questions that follow.
59. Q28. What are common in the four pictures?
Q29. Millions of years ago, the land masses in
each picture were once connected. What do
you think is happening to the Earth’s crust in
those pictures?
Q30. If this event continues for millions of
years, what do you think will be the effect on
the crust?
Q31. Complete the drawing below to illustrate
your answer in question number 30.
61. Divergence of Plates
Formation of rift valleys and oceanic ridges
are indications that the crust is spreading or
splitting apart. In this case, the plates are forming
divergent plate boundaries wherein they tend to
move apart. Most divergent boundaries are
situated along underwater mountain ranges
called oceanic ridges. As the plates separate, new
materials from the mantle ooze up to fill the gap.
These materials will slowly cool to produce new
ocean floor.
62. The spreading rate at these ridges may
vary from 2 to 20 cm per year. Although a
very slow process, divergence of plates
ensures a continuous supply of new
materials from the mantle. The Mid-
Atlantic Ocean ridge is an example of
spreading center which causes the
divergence of the South American plate
and the African plate.
64. When a spreading center develops within a
continent, the crust may break into several
segments. The breaking leads to the formation
of down faulted valleys called rift valleys. It is
also associated with the rising of hot materials
from the mantle.
The rift valley increases its length and depth
as the spreading continues. At this point, the
valley develops into a linear sea, similar to the
Red Sea today.
66. In Grade 8, you were introduced to different types
of fault such as normal, reverse, and strike-slip. You also
learned that faults are fractures in the Earth’s crust
created by different types of forces acting on the
lithosphere.
There is one type of plate boundary that resembles
the strike-slip fault. Though much larger, transform fault
boundary is similar to strike-slip fault in terms of the
relative motion of adjacent slabs of rock.
To find out more about this kind of plate boundary,
the next activity will let you simulate the event that
could happen out of this boundary.
67. Activity 5
Slide and Shake
Objective:
determine the effect of transform-fault boundary on the
Earth’s crust.
Materials:
• four blocks of wood:
blocks 1 and 4 measures 5 cm x 5 cm x 10 cm
while blocks 2 and 3 measures 5 cm x 5 cm x 15cm
• two hook screws
• sandpaper
68. Procedure:
1. Attach a hook screw on one end of Blocks 2
and 3.
2. Arrange the blocks as shown in the
illustration below.
3. Place sandpaper on the side of the blocks
where they all meet.
4. Slowly pull Blocks 2 and 3 on its hook
screw to the direction indicated by the arrow.
Observe the motion of the blocks.
69.
70. Q32. Were you able to pull the blocks of wood
easily? Why or why not?
Q33. What can you say about the relative
motion of blocks 1 and 2? How about blocks 3
and 4?
Q34. How will you describe the interaction
between blocks 2 and 3 as you pull each
block?
Q35. What is the interaction between blocks 1
and 3? How about between blocks 2 and 4?
71. Transform Fault Boundaries
If the blocks of wood in Activity 6 were
to represent the lithospheric plates, you will
notice that there were two sets of divergent
plate boundaries (between blocks 1 and 2,
and blocks 3 and 4). But since the plates
were adjacent to each other, a new type of
boundary is manifested and that is the
transform fault boundary.
72. Most transform faults join two segments of a mid-ocean
ridge (represented by the gaps between 1 and 2, and between
3 and 4). Remember that the presence of a ridge is an
indication of diverging plates, and as the plates diverge
between the two segments of the mid-ocean ridge, the
adjacent slabs of crust are grinding past each other (blocks 2
and 3, blocks 1 and 3, and blocks 2 and 4).
Although most transform faults are located within the
ocean basins, there are a few that cut through the continental
crust. An example of this is the San Andreas fault. The
immediate concerns about transform fault boundaries are
earthquake activities triggered by movements along the fault
system.
74. It was stated at the beginning of this module
that majority of tectonic activities like earthquakes,
mountain formations, and volcanic activities
happen along or near plate boundaries. But there
are some cases wherein activities take place in the
middle of a plate.
Let’s take the case of the Hawaiian islands.
Here, we can find some of the largest and most
active volcanoes of the world. If we’re going to
look at Hawaii, it is situated right in the middle of
Pacific plate and not along the boundaries.
75. Activity 6
Drop It Like It’s “Hot Spot”
Objective:
Relate hot spot with plate tectonics
Materials:
• alcohol lamp • test tube • test tube holder
• bond paper (2 sheets) • match • water
Procedure:
1. Attach one end of the bond paper to the end of another bond
paper.
2. Fill 3/4 of the test tube with water and heat it over an alcohol
lamp.
3. While waiting for the water to boil, place the paper on top of
the test
76.
77. 4. Once the water starts boiling and fumes are coming
out, hold the paper in the same position for the next
10 seconds.
5. After 10 seconds, move the bond paper very slowly
and horizontally
by 10 centimeters. See to it that the paper and test
tube are still in contact.
6. Repeat step 5 after another 10 seconds and observe.
Q36. What can you see on the surface of the bond
paper?
78. Q37. Let’s say that the paper represents the Earth’s
crust; what do you think is represented by the water
in the test tube?
Q38. What geologic feature do you think will be
formed at the surface of the crust?
Q39. Which of the features, at the surface of the crust,
will be the oldest? the youngest? Label these on your
paper.
Q40. Which of the features will be the most active?
The least active? Label these on your paper.
79. Activity 6 gave you an idea how tectonic
activities could also happen within a plate and not
just along the boundaries.
This idea started when extensive mapping of
seafloor volcanoes in the Pacific revealed a chain of
volcanic structures extending from the Hawaiian
Islands to Midway Islands. When geologists
determined the age of each volcanic island through
radiometric dating, they noticed that the farther
the volcano from Hawaii is, the older and less
active it is.
80. Scientists suggested that there is a source of molten
materials from the mantle called mantle plume that formed
the volcanic island chains. As the Pacific plate moves,
different parts of it will be on top of the mantle plume to
receive the molten materials, thus creating the volcanic
islands. Continuing plate movement eventually carries the
island beyond the hot spot, cutting it off from the magma
source, and volcanism ceases. As one island volcano
becomes extinct, another develops over the hot spot, and
the cycle is repeated. This process of volcano growth and
death, over many millions of years, has left a long trail of
volcanic islands and seamounts across the Pacific Ocean
floor.
82. VI. Summary/Synthesis/Feedback
• According to the plate tectonics model, the entire lithosphere of
the Earth is broken into numerous segments called plates.
• Each plate is slowly but continuously moving.
• As a result of the motion of the plates, three types of plate
boundaries were formed: Divergent, Convergent, and Transform
fault boundaries.
• Divergent boundary is formed when plates move apart,
creating a zone of tension.
• Convergent boundary is present when two plates collide.
• Transform fault is characterized by plates that are sliding past
each other.
• Plate tectonics give rise to several geologic features and events.
83. Glossary of Terms
Continental volcanic arc mountains formed in part by igneous
activity associated with subduction of oceanic lithosphere
beneath a continent
Convergent boundary a boundary in which two plates move
toward each other, causing one of the slabs of the lithosphere
to subduct beneath an overriding plate
Crust the outer portion of the earth
Continental Crust the thick part of the Earth’s crust, not
located under the ocean
Oceanic Crust the thin part of the Earth’s crust located under
the oceans
84. Divergent boundary a region where the crustal plates are
moving apart
Earthquake vibration of Earth due to the rapid release of
Energy
Fault a break in a rock along which movement has
Occurred
Fracture any break in a rock in which no significant
movement has taken place
Geology the science that studies Earth
Hot spot a concentration of heat in the mantle capable of
creating magma
85. Magma a mass of molten rock formed at depth,
including dissolved gases and crystals.
Mid-ocean ridge a continuous mass of land with
long width and height on the ocean floor.
Plates rigid sections of the lithosphere that move
as a Unit
Plate tectonics a theory which suggests that
Earth’s crust is made up of plates that interact in
various ways, thus producing earthquakes,
mountains, volcanoes, and other geologic features
86. Primary (P) wave the first type of seismic
wave to be recorded in a seismic station
Rocks consolidated mixture of minerals
Secondary (S) wave second type of
earthquake wave to be recorded in a seismic
station
Seismogram a record made by a seismograph
Seismograph a device used to record
earthquake waves
87. Subduction an event in which a slab of rock
thrusts into the mantle
Transform fault boundary a boundary
produced when two plates slide past each
other
Trench a depression in the seafloor produced
by subduction process
Volcanic Island arc a chain of volcanoes that
develop parallel to a trench