This document presents a novel deep learning framework utilizing a modified fuzzy rough set technique with a stacked autoencoder for breast cancer detection using MRI images. The method includes image preprocessing, lesion segmentation, feature extraction, and classification, achieving classification accuracies of 99% and 99.22% on benchmark datasets. The proposed model aims to reduce system complexity and computational time while improving the early detection of malignant and benign breast lesions.
![International Journal of Electrical and Computer Engineering (IJECE)
Vol. 14, No. 1, February 2024, pp. 294~304
ISSN: 2088-8708, DOI: 10.11591/ijece.v14i1.pp294-304 294
Journal homepage: http://ijece.iaescore.com
Modified fuzzy rough set technique with stacked autoencoder
model for magnetic resonance imaging based breast cancer
detection
Sachin Kumar Mamdy1
, Vishwanath Petli2
1
Department of Electronics and Communication Engineering, VTU RRC, Visvesvaraya Technological University, Belagavi, India
2
Department of Electronics and Communication Engineering, SLN College of Engineering, Raichur, India
Article Info ABSTRACT
Article history:
Received Jul 9, 2023
Revised Jul 8, 2023
Accepted Jul 17, 2023
Breast cancer is the common cancer in women, where early detection
reduces the mortality rate. The magnetic resonance imaging (MRI) images
are efficient in analyzing breast cancer, but it is hard to identify the
abnormalities. The manual breast cancer detection in MRI images is
inefficient; therefore, a deep learning-based system is implemented in this
manuscript. Initially, the visual quality improvement is done using region
growing and adaptive histogram equalization (AHE), and then, the breast
lesion is segmented by Otsu thresholding with morphological transform.
Next, the features are extracted from the segmented lesion, and a modified
fuzzy rough set technique is proposed to reduce the dimensions of the
extracted features that decreases the system complexity and computational
time. The active features are fed to the stacked autoencoder for classifying
the benign and malignant classes. The results demonstrated that the proposed
model attained 99% and 99.22% of classification accuracy on the benchmark
datasets, which are higher related to the comparative classifiers: decision
tree, naïve Bayes, random forest and k-nearest neighbor (KNN). The
obtained results state that the proposed model superiorly screens and detects
the breast lesions that assists clinicians in effective therapeutic intervention
and timely treatment.
Keywords:
Breast cancer detection
Fuzzy rough set
Image enhancement
Magnetic resonance imaging
Otsu thresholding
Stacked autoencoder
This is an open access article under the CC BY-SA license.
Corresponding Author:
Sachin Kumar Mamdy
Department of Electronics and Communication Engineering, VTU RRC, Visvesvaraya Technological
University
Belagavi, India
Email: msachin834@gmail.com
1. INTRODUCTION
In the current scenario, breast cancer is the common cancer type in the rural and urban areas, where
women between the age group of thirty-fifty years are at a higher risk of breast cancer [1], [2]. It is the
second most cause of cancer deaths in women after lung cancer [3]. Hence, the death rate of women due to
breast cancer is 1 in 37 subjects, which is around 2.7%. Therefore, the proper treatment and early diagnosis
of breast cancer are essential for decreasing the death rates and preventing the disease progression [4]–[6]. In
recent decades, magnetic resonance imaging (MRI) images are highly utilized for diagnosing breast cancer to
decrease unnecessary biopsies [7], [8]. Additionally, the MRI images are a highly recommended test to
monitor and detect the breast cancer lesion and to interpret the lesioned region, because it has better soft
tissue imaging [9]. Additionally, an experienced physician is needed to process the MRI images, which is a
time-consuming mechanism [10], [11]. For overcoming the above-stated issue, several automated models are](https://image.slidesharecdn.com/2833005ijecedbk-240104040109-3b65bac3/75/Modified-fuzzy-rough-set-technique-with-stacked-autoencoder-model-for-magnetic-resonance-imaging-based-breast-cancer-detection-1-2048.jpg)
![Int J Elec & Comp Eng ISSN: 2088-8708
Modified fuzzy rough set technique with stacked autoencoder model for … (Sachin Kumar Mamdy)
295
implemented by the researchers [12], [13]. Singh et al. [14] introduced a novel two-stage model for tumor
classification. The integration of adversarial network and convolutional neural network (CNN) requires a
large amount of medical data for training the developed model, which was extremely expensive.
Ibraheem et al. [15] combined two dimensional median filter and discrete wavelet transform for improving
the quality of breast images and extracting the features. The extracted features were given to the support
vector machine (SVM) for tumor and healthy region classification. The SVM does not work well, when the
target-classes were overlapping and the collected data was noisier. Khan et al. [16] introduced a deep
learning framework based on the concept of transfer learning for breast cancer detection. In the presented
deep learning system, three pre-trained models like residual network (ResNet), GoogLeNet and visual
geometry group network (VGGNet) were used to extract features from the breast cytology images. The
extracted deep learning features were fed to the fully connected layer of the transfer-learning model for
malignant and benign classification. The developed transfer-learning model needs expensive graphics
processing unit systems that increase computational cost.
Ragab et al. [17] has integrated ResNet, AlexNet, and GoogLeNet models for extracting deep
features from the breast mammogram images. The extracted features were given to the SVM classifier for
tumor and non-tumor region classification. However, the SVM classifier was suitable for binary class
classification, where it was inappropriate for multiclass classification. On the other hand, Alanazi et al. [18]
has presented a CNN model for boosting the automatic detection of cancer regions by utilizing
histopathology images, where it was computationally expensive. Fang et al. [19] firstly applied median
filtering technique for enhancing the quality of mammogram images. Then, the whale optimization algorithm
was combined with the multilayer perceptron algorithm for classifying the breast images as healthy or
cancerous. The evaluation outcomes demonstrated that the presented model obtained higher accuracy than
the existing models. The multilayer perceptron algorithm was sensitive to feature scaling and needs more
hyper-parameters tuning such as hidden layers and neurons. Gravina et al. [20] developed a CNN model
based on the intrinsic deforming autoencoders for automatic breast lesion malignancy recognition. The CNN
was computationally costly, where it requires an enormous amount of data in order to obtain better
classification results. Chouhan et al. [21] developed a deep highway network to extract dynamic features
from the digital breast mammogram images. Further, the extracted features were given to the SVM and
emotional learning inspired ensemble model for benign and malignant classification. As specified earlier, the
developed SVM model supports only binary class classification.
Khamparia et al. [22] has implemented a hybrid transfer-learning model that combines ImageNet
and modified VGGNets for superior breast cancer recognition. The presented hybrid transfer-learning model
was a superior tool for clinicians in order to diminish the false positive and false negative rates of breast
cancer recognition, but it was computationally complex. In addition, Yurttakal et al. [23] implemented a time
saving deep CNN model for classifying the breast lesions as benign or malignant tumors. The presented time
saving deep CNN model obtained promising results in the breast cancer classification by means of
specificity, accuracy, and sensitivity. In addition, Hizukuri et al. [24] developed a deep CNN model with
Bayesian optimization for effective breast cancer classification. As presented in the resulting section, the
deep CNN model obtained higher classification performance and it would be useful in early diagnoses of
breast masses. However, the vanishing gradients was a major problem in the hybrid transfer-learning model
and deep CNN model. To highlight the above-stated issues and to enhance breast-cancer detection, a novel
deep learning system is implemented in this work. The primary aim of this article is to categorize the
malignant and benign breast lesions with limited system complexity and computational time. The
contributions are listed below:
− After acquiring the breast images from breast imaging-reporting and data system (BI-RADS) MRI and
breast dynamic contrast material-enhanced MRI (DCE-MRI) datasets, the image denoising is carried out
by using region growing and adaptive histogram equalization (AHE) techniques. The undertaken pre-
processing techniques significantly enhance the edge definitions and improve the local contrast of the
collected breast images.
− The breast lesion segmentation is accomplished utilizing Otsu thresholding with morphological
transform, where this technique is effective, when the background condition is unchanged.
− The discriminative features are extracted from the segmented lesions by utilizing local ternary pattern
(LTP) and steerable pyramid transform (SPT). Then, the dimensions of the extracted features are
diminished by proposing a modified fuzzy rough set technique that enhances the computational time and
complexity of the stacked autoencoder model, which is used for classification. The modified fuzzy rough
set technique combines the fuzzy equivalence and the membership function of fuzzy c means clustering
technique for feature optimization. The rough set based stacked autoencoder model’s effectiveness is
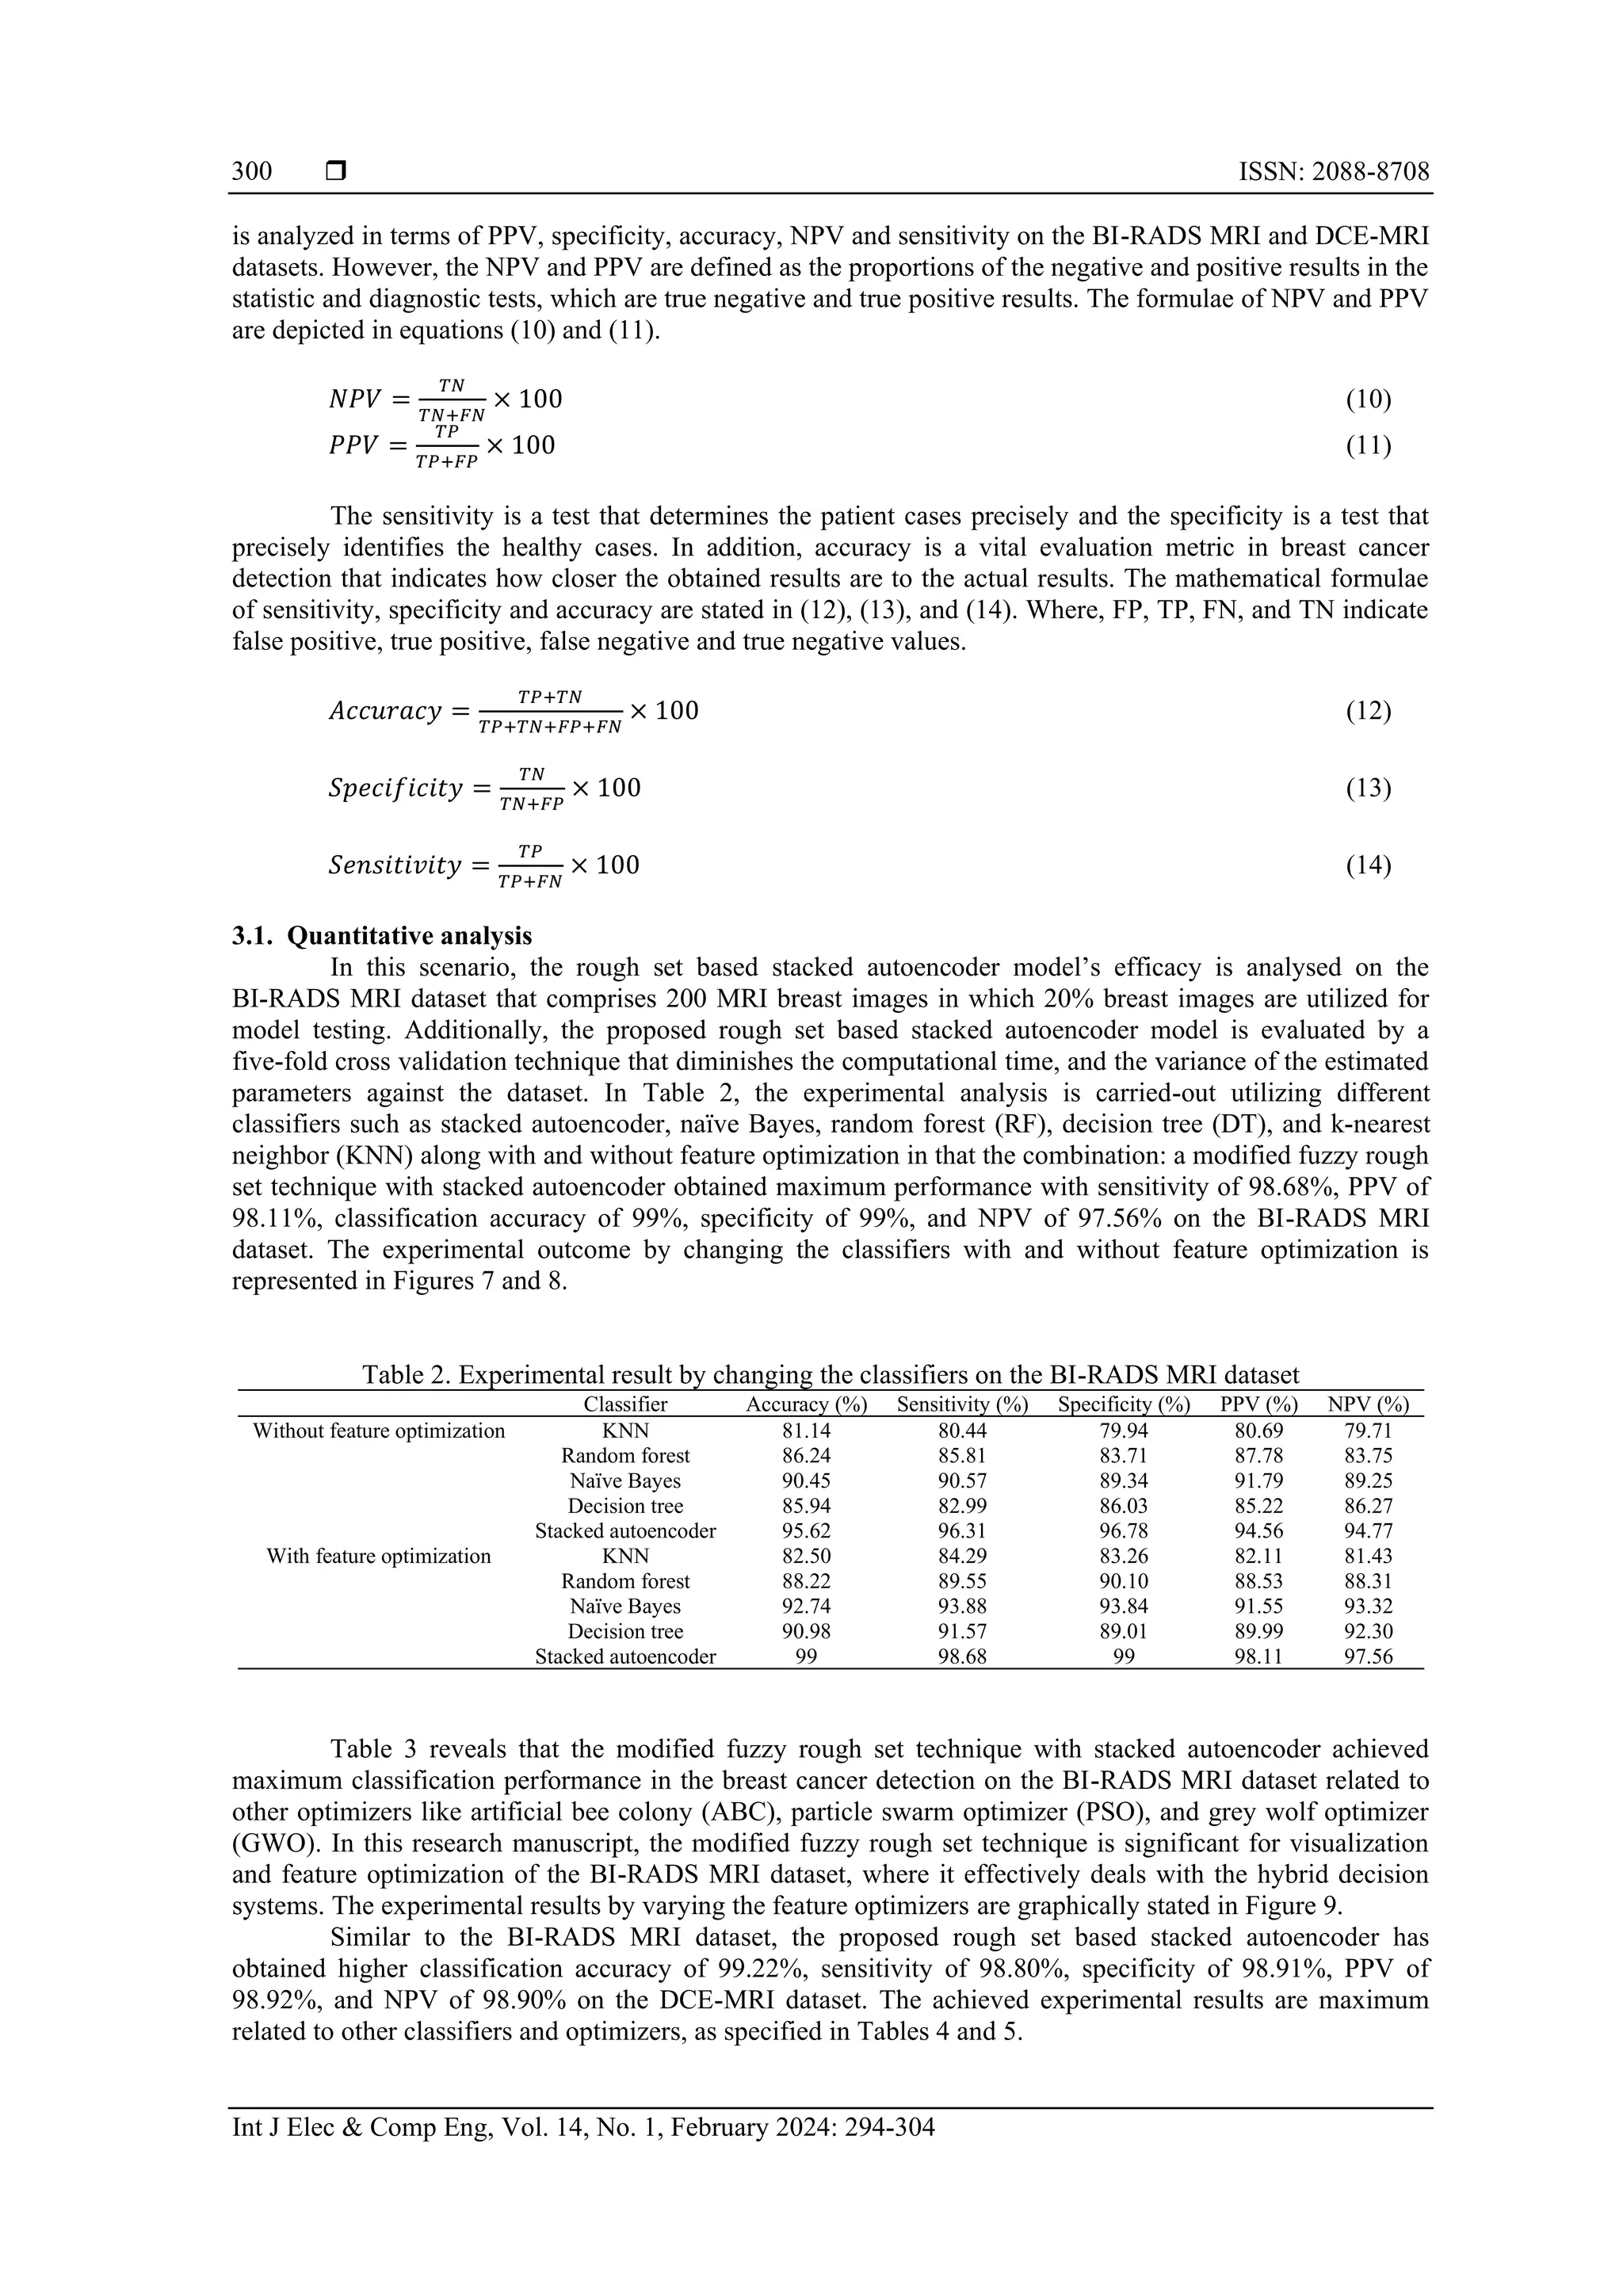
analyzed in terms of positive predicted value (PPV), specificity, accuracy, negative predicted value
(NPV), and sensitivity.](https://image.slidesharecdn.com/2833005ijecedbk-240104040109-3b65bac3/75/Modified-fuzzy-rough-set-technique-with-stacked-autoencoder-model-for-magnetic-resonance-imaging-based-breast-cancer-detection-2-2048.jpg)
![Int J Elec & Comp Eng ISSN: 2088-8708
Modified fuzzy rough set technique with stacked autoencoder model for … (Sachin Kumar Mamdy)
297
employed to enhance the contrast of the raw breast MRI images. The AHE technique computes different
histogram values to distinguish the images into many sections and then utilizes these sections for
redistributing the lightness of the breast MRI images. Hence, the AHE technique is appropriate to enhance
the image edges and to improve the local contrast of the collected breast MRI images [25]. Additionally, the
region growing technique completely relies on the neighborhood image pixel assumption [26]. The region
growing techniques compare one pixel with the neighbourhood pixels. If the similarity criterion is satisfied,
the pixels belong to the clusters. The output image of the AHE and region-growing techniques are
graphically depicted in Figures 3 and 4.
Figure 3. Output images of AHE technique
Figure 4. Output images of region growing
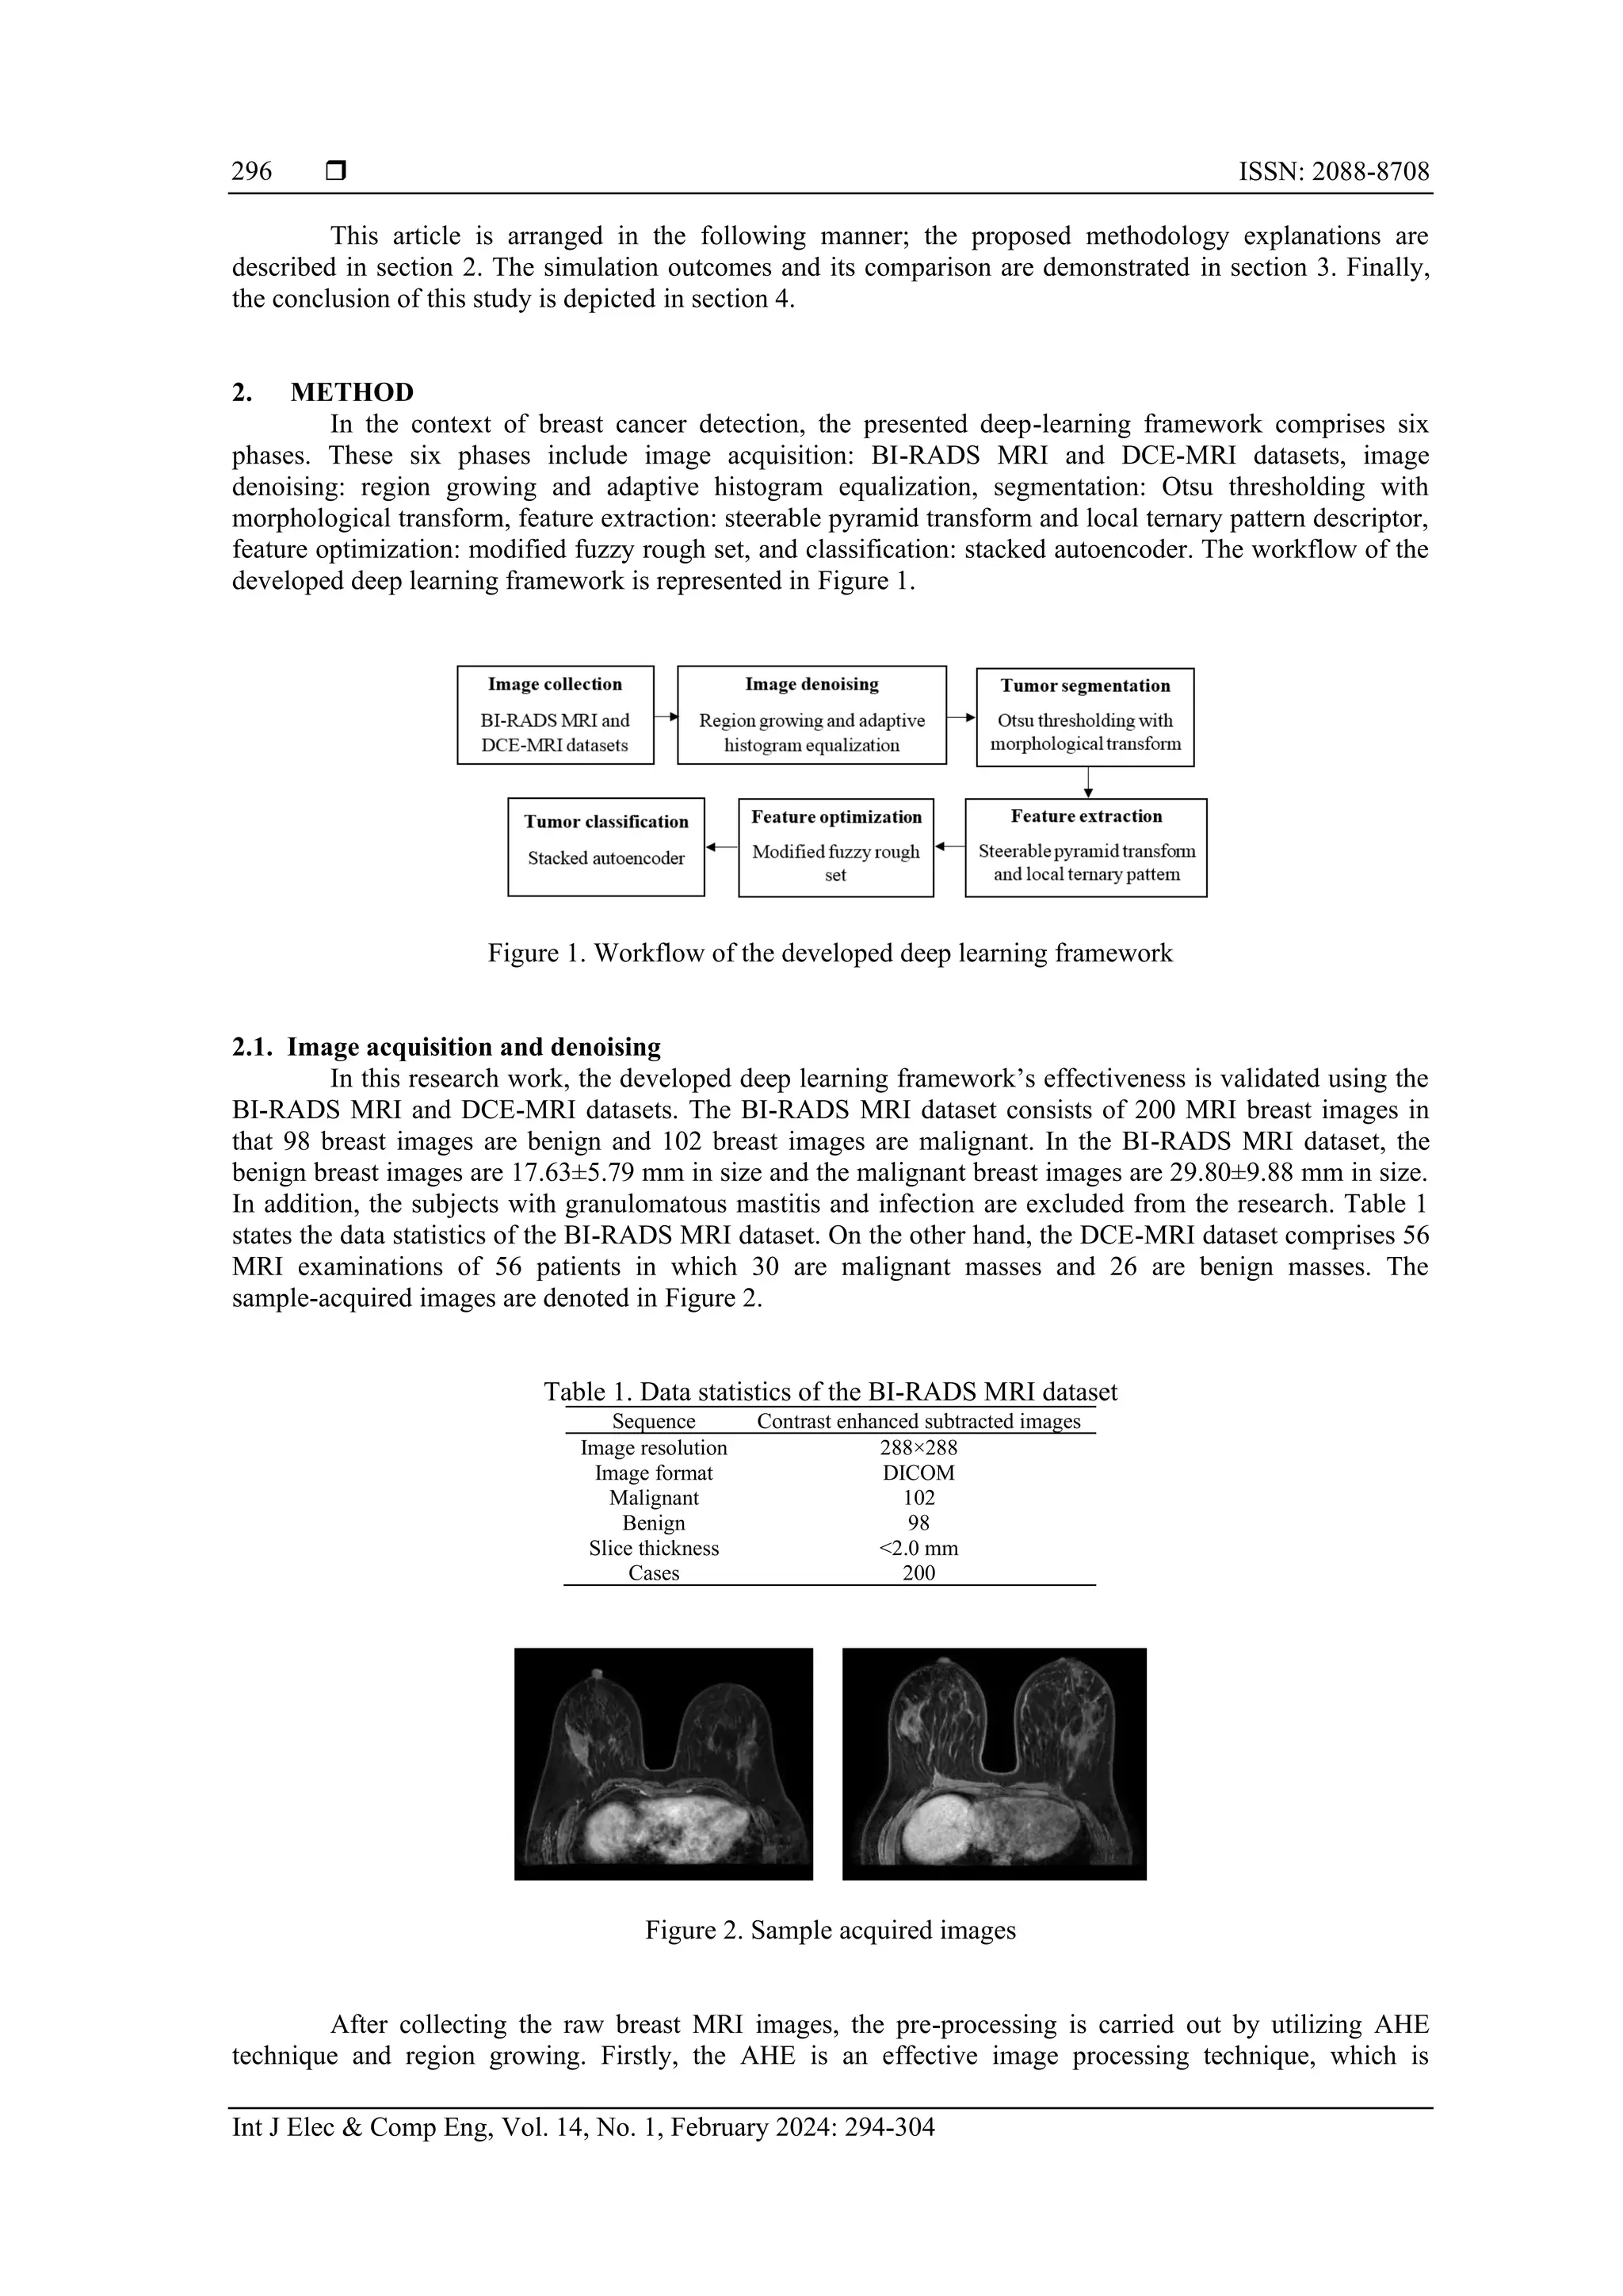
2.2. Tumor segmentation
After denoising the breast images, the tumor segmentation is accomplished by utilizing Otsu
thresholding technique. The Otsu thresholding is an effective and simple segmentation technique, where it
uses maximum class variance values. Related to existing image segmentation techniques, the Otsu
thresholding technique includes advantages like need only smaller storage space, faster processing speed and
ease in implementation. The pixel intensity level of the denoised image 𝐿 is initially determined by
utilizing (1).
𝑃𝐻𝑖
𝑒
=
𝐻𝑖
𝑒
𝑀
, ∑ 𝑃𝐻𝑖
𝑒
= 1
𝑀
𝑖=1 , 𝑒 = {
1,2,3 𝑖𝑓 𝑅𝐺𝐵
1 𝑖𝑓 𝑔𝑟𝑎𝑦𝑠𝑐𝑎𝑙𝑒
(1)
where, 𝐻𝑖
𝑒
indicates the pixel intensity value that corresponds to the intensity levels from 𝑖 until 𝑒, and 𝑃𝐻𝑖
𝑒
represents distribution probability value of the denoised image. Additionally, 𝐸 indicates image components
(grayscale or RGB) and 𝑀 specifies the number of pixel values in the denoised breast images [27]. Next, the
histogram values in the probability distribution are normalized using (2).
𝑤𝑜
𝐸(𝑡ℎ) = ∑ 𝑃𝐻𝑖
𝑒
,
𝑡ℎ
𝑖=1 𝑤1
𝐸(𝑡ℎ) = ∑ 𝑃𝐻𝑖
𝑒
𝐿
𝑖=𝑡ℎ+1 (2)
where, 𝐸1 =
𝑃𝐻1
𝑒
𝑤𝑜
𝑒(𝑡ℎ)
, … . ,
𝑃𝐻𝑡ℎ
𝑒
𝑤𝑜
𝑒(𝑡ℎ)
, 𝐸2 =
𝑃𝐻𝑡ℎ+1
𝑒
𝑤1
𝑒(𝑡ℎ)
, … . . ,
𝑃𝐻𝐿
𝑒
𝑤1
𝑒(𝑡ℎ)
, 𝑤0(𝑡ℎ) 𝑎𝑛𝑑 𝑤1(𝑡ℎ) denotes probability distribution
from 𝐸1 and 𝐸2. Further, calculate the variants and average levels between the classes 𝐶 by utilizing the (3)
and (4).
𝜇0
𝑒
= ∑
𝑖𝑃𝐻𝑖
𝑒
𝑤𝑜
𝑒(𝑡ℎ)
,
𝑡ℎ
𝑖=1 𝜇1
𝑒
= ∑
𝑖𝑃𝐻𝑖
𝑒
𝑤1
𝑒(𝑡ℎ)
,
𝐿
𝑖=𝑡ℎ+1 (3)
𝜎2𝑒
= 𝜎1
𝑒
+ 𝜎2
𝑒
, (4)](https://image.slidesharecdn.com/2833005ijecedbk-240104040109-3b65bac3/75/Modified-fuzzy-rough-set-technique-with-stacked-autoencoder-model-for-magnetic-resonance-imaging-based-breast-cancer-detection-4-2048.jpg)
![ ISSN: 2088-8708
Int J Elec & Comp Eng, Vol. 14, No. 1, February 2024: 294-304
298
where, 𝜎1
𝑒
= 𝑤0
𝑒
(𝜇0
𝑒
+ 𝜇𝑇
𝑒
)2
, 𝜎2
𝑒
= 𝑤1
𝑒
(𝜇1
𝑒
+ 𝜇𝑇
𝑒
)2
, 𝜎2𝑒
represents variants between the classes 𝐶 (benign and
malignant classes), 𝜎1
𝑒
and 𝜎2
𝑒
denotes class variants one and two, and 𝜇0
𝑒
and 𝜇1
𝑒
states average rate for the
class variants one and two. Then, the objective function is calculated utilizing (5).
𝐽(𝑡ℎ) = 𝑚𝑎𝑥( 𝜎2𝑒(𝑡ℎ)) , 0 ≤ 𝑡ℎ𝑖 ≤ 𝐿 − 1, 𝑖 = 1,2,3, … 𝐾 (5)
where, 𝑡ℎ = 𝑡ℎ1, 𝑡ℎ2, … … . 𝑡ℎ𝐾−1 represents a vector, which contains multiple thresholds. The Otsu
thresholding between the class variance function is maximized to achieve the optimum threshold level of
breast image for better tumor segmentation by increasing the objective function. In addition, the
morphological dilation operator is employed on the output images of the Otsu thresholding technique that
utilizes a structural element for expanding and probing the shapes in the output images of the Otsu
thresholding technique. The output images of Otsu thresholding with morphological transform are
graphically represented in Figure 5.
Figure 5. Output images of Otsu thresholding with morphological transform
2.3. Feature extraction with optimization
After tumor segmentation, the feature extraction is performed by utilizing steerable pyramid
transform (SPT) and local ternary pattern (LTP) for extracting the features from the segmented tumor
regions. The SPT is a linear multi-orientation and multi-scale image decomposition method, where the major
portions of the linear transforms are sub-band transforms. Initially, the SPT is an effective image
decomposition method that partitions the segmented tumor images into numerous sub-bands using orientation
and scale, which is calculated using decimation and convolution operations. The sub-bands of the SPT are
rotation invariant and translation that reduce the concern of orthogonal-separable-wavelet-decomposition
[28]. In the SPT method, the segmented image is partitioned into low and high pass sub-bands utilizing the
filters 𝐿0 and 𝐻0. Further, the low pass sub-bands are decomposed into four oriented band-pass sub-bands
utilizing low pass filter 𝐿1 and band pass filters 𝐵0, 𝐵1, 𝐵2, and 𝐵3. Lastly, a robust image representation is
generated with high orientation and scale by increasing the number of pyramid levels and number of image
orientations.
Additionally, the LTP is a three-value texture descriptor for extracting the textual feature vectors
from the segmented images. The LTP labels the image pixels with a threshold value by multiplying and
adding the centre neighborhood image pixels 𝑝𝑐 to generate the new labels. After defining the threshold
value 𝑡, the pixel values within the range of −𝑡 to +𝑡 are considered to assign the value of zero to the image
pixels [29]. The value 1 is assigned to the image pixels, if the value is higher than the threshold value, and the
value -1 is assigned to the image pixels if the value is lower than the center pixel value. The mathematical
expression of the LTP operator is represented in (6).
𝐿𝑇𝑃 = {
1 𝑖𝑓 𝑝𝑖 − 𝑝𝑐 ≥ 𝑡
0 𝑖𝑓 |𝑝𝑖 − 𝑝𝑐| < 𝑡
−1 𝑖𝑓 𝑝𝑖 − 𝑝𝑐 ≤ −𝑡
} (6)
where, 𝑡 indicates user-specified threshold, 𝑝𝑖 denotes neighborhood pixel value and 𝑝𝑐 represents a central
pixel value. The hybrid feature extraction (LTP and SPT) extracts 1536 features from the segmented images.
The dimensions of the extracted feature vectors are decreased by implementing the modified fuzzy rough set
technique. Generally, the fuzzy rough set utilizes two approximations such as lower and upper limits for
feature optimization that ranges between [0, 1]. The conventional fuzzy rough set feature optimization is
employed on nominal, valued, continuous and nominal data, where it significantly handles the data noise.
Several reformulations are carried out in a fuzzy rough set to speed up the calculations. In this manuscript,](https://image.slidesharecdn.com/2833005ijecedbk-240104040109-3b65bac3/75/Modified-fuzzy-rough-set-technique-with-stacked-autoencoder-model-for-magnetic-resonance-imaging-based-breast-cancer-detection-5-2048.jpg)
![Int J Elec & Comp Eng ISSN: 2088-8708
Modified fuzzy rough set technique with stacked autoencoder model for … (Sachin Kumar Mamdy)
299
the modified fuzzy rough set technique is proposed that integrates the fuzzy equivalence and the membership
function of fuzzy c means clustering technique for feature optimization. The modified fuzzy rough set
technique knows the dataset and selects the highly correlated feature vectors of 537 for disease classification.
The flowchart of the modified fuzzy rough set technique is represented in Figure 6.
Figure 6. Flowchart of the modified fuzzy rough set technique
2.4. Classification
After choosing the active features, the stacked autoencoder is applied for classification [30]. The
stacked autoencoder classification technique comprises multi-layer autoencoders that obtain higher-level
representation of the original feature vectors by reconstructing input and its structure. In the input layer, the
original information is encoded for obtaining the higher-level feature vectors of the middle-hidden layer and
then the input information is reconstructed by decoding the information. By minimizing the reconstruction
error, the stacked autoencoder networks are trained. The original training data is considered as 𝑥 and the
hidden layer is mathematically expressed in (7).
𝑦(𝑖)
= 𝑓(𝑊1
𝑇
𝑥(𝑖)
+ 𝑏2
) (7)
where 𝑓 = 𝑡𝑎𝑛ℎ (. ) represents activation function. Further, the output 𝑧 is obtained by decoding the original
information, which is mathematically represented in (8). Then, the objective is minimized for training the
autoencoder that is defined in (9).
𝑧(𝑖)
= 𝑊2
𝑇
𝑦(𝑖)
+ 𝑏2
≈ 𝑥(𝑖)
(8)
𝐽(𝑋, 𝑍) =
1
2
∑ ‖𝑥(𝑖)
− 𝑧(𝑖)
‖
2
𝑀
𝑖=1 (9)
The stacked autoencoder is trained on the basis of layer-by-layer greedy method. Particularly, the
feature vector of the upper hidden layer is used as the input of the succeeding layers, which is named as pre-
training. Further, the weights of the pre-trained network are connected and then the weights of the final
network are obtained by fine-tuning. The assumed parameters are: maximum iterations: softmax learning is
100, sparsity proportion is 0.15, maximum iterations: SAE learning is 100, L2 weight regularization is 0.004,
sparsity regularization is 4, and a number of hidden layers is 100.
3. RESULTS AND DISCUSSION
In the automated breast cancer detection, the developed rough set based stacked autoencoder
model’s efficacy is simulated by MATLAB 2020. The rough set based stacked autoencoder model’s efficacy](https://image.slidesharecdn.com/2833005ijecedbk-240104040109-3b65bac3/75/Modified-fuzzy-rough-set-technique-with-stacked-autoencoder-model-for-magnetic-resonance-imaging-based-breast-cancer-detection-6-2048.jpg)
![ ISSN: 2088-8708
Int J Elec & Comp Eng, Vol. 14, No. 1, February 2024: 294-304
302
Table 4. Experimental result by changing the classifiers on the DCE-MRI dataset
Classifier Accuracy (%) Sensitivity (%) Specificity (%) PPV (%) NPV (%)
Without feature optimization KNN 82.65 82.11 81.90 85.65 84.70
Random forest 84.32 86.78 85.70 89.90 88.22
Naïve Bayes 93.22 90.99 89 90.11 90.25
Decision tree 94.34 93.21 90.08 92.90 90.33
Stacked autoencoder 95.80 95.65 93.77 95.50 93.70
With feature optimization KNN 90.33 90.90 91.28 90.12 91.40
Random forest 92.38 93.10 92.10 95.50 92.99
Naïve Bayes 96.70 95.84 93.99 96.86 94.34
Decision tree 97.07 96.50 95.08 97.90 96.30
Stacked autoencoder 99.22 98.80 98.91 98.92 98.90
Table 5. Experimental result by changing the feature optimizers on the DCE-MRI dataset
Stacked autoencoder
Optimizers Accuracy (%) Sensitivity (%) Specificity (%) PPV (%) NPV (%)
PSO 93.38 90.11 90.70 90.30 91.32
GWO 94.20 94.84 94.85 92.62 93.68
ABC 95.08 96.40 95.09 93.88 94.11
Modified fuzzy rough set 99.22 98.80 98.91 98.92 98.90
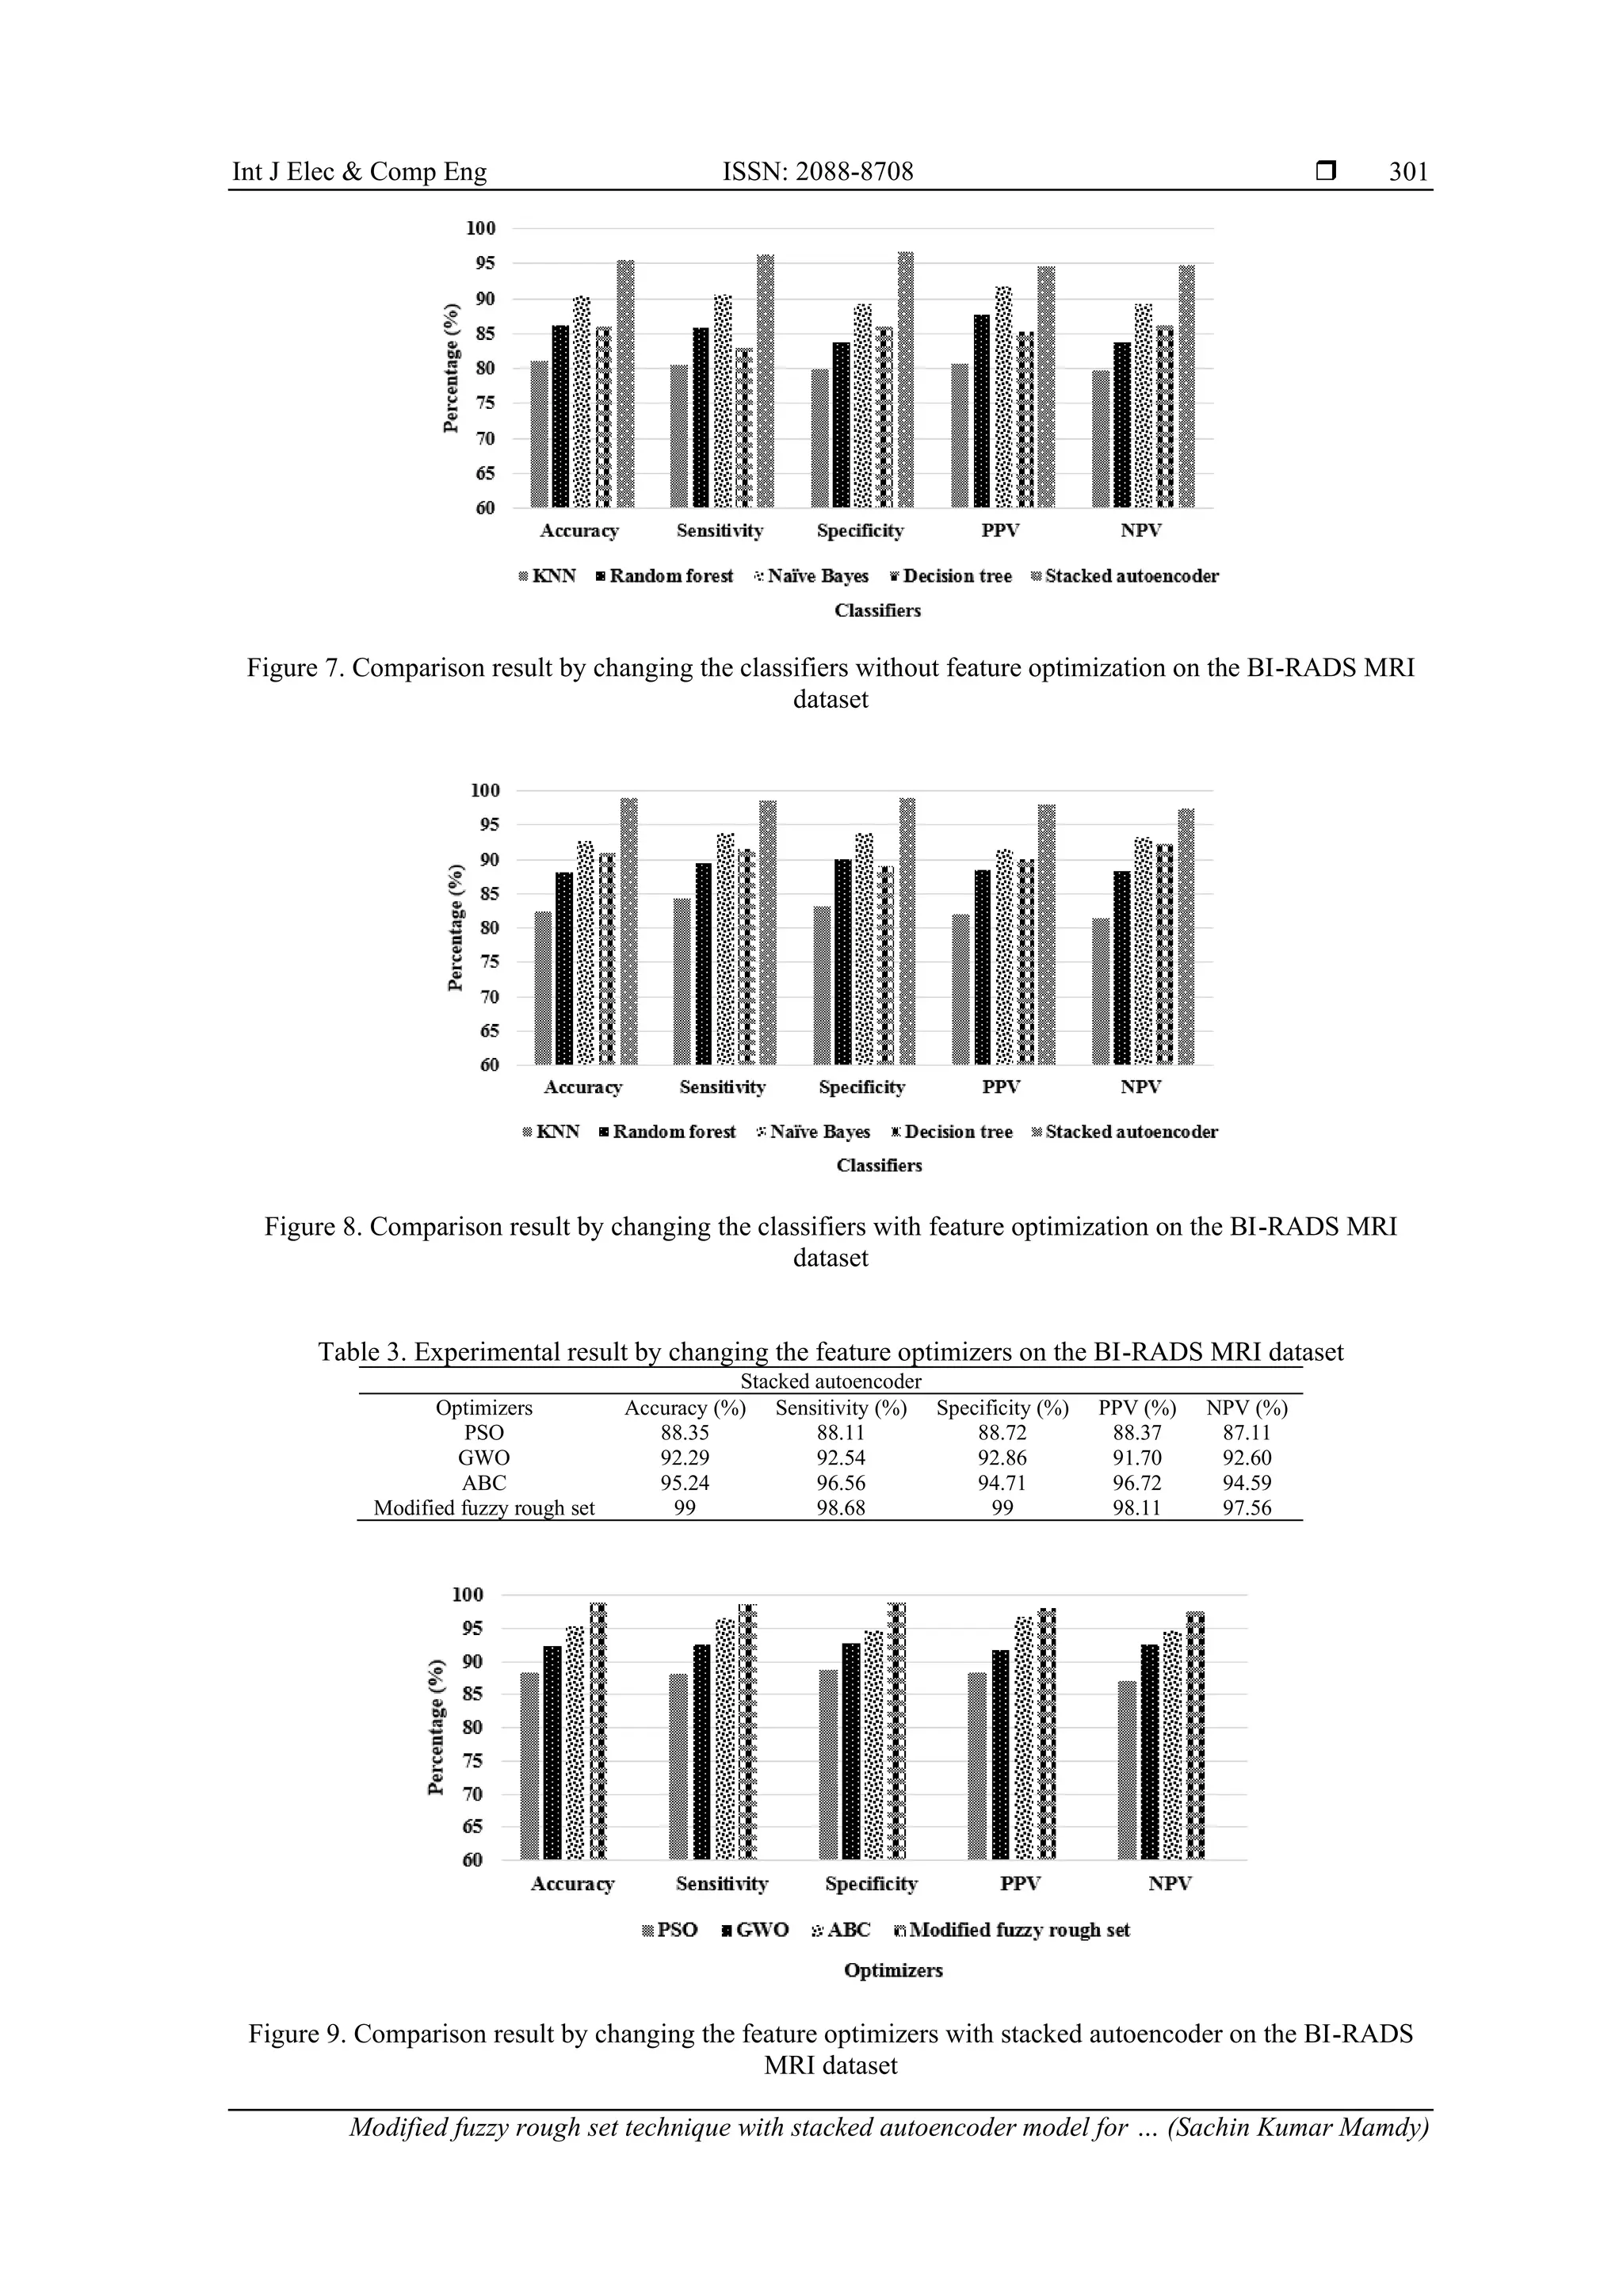
3.2. Comparative analysis
The comparative results of the prior models and the rough set based stacked autoencoder model is
represented in Table 6. Yurttakal et al. [23] presented a deep CNN model for classifying the breast MRI
lesions as malignant and benign. The simulation outcomes demonstrated that the deep CNN model achieved
98.33% of classification accuracy and 96.88% of specificity on the BI-RADS MRI dataset. In addition,
Hizukuri et al. [24] integrated a deep CNN model with Bayesian optimization for effective breast cancer
classification. As depicted in the resulting section, the developed model obtained 92.90% of accuracy and
92.30% of specificity on the DCE-MRI dataset. Compared to the existing deep CNN models, the rough set
based stacked autoencoder model obtained superior performance in breast lesion detection by means of
different evaluation measures.
Table 6. Comparative evaluation between the existing and the proposed rough set based stacked
autoencoder model
Models Dataset Accuracy (%) Specificity (%)
Deep CNN [23] BI-RADS MRI 98.33 96.88
Deep CNN with Bayesian optimization [24] DCE-MRI 92.90 92.30
Rough set based stacked autoencoder model BI-RADS MRI 99 99
DCE-MRI 99.22 98.91
3.3. Discussion
The segmentation, feature optimization, and classification are the vital parts of this research for
precise breast cancer detection with minimal computational time. The Otsu thresholding with morphological
transform is simple and speed in finding the optimal threshold value for separating foreground and
background regions. After feature extraction, the incorporation of the modified fuzzy rough set technique in
the proposed system diminishes the computational time and complexity of the stacked autoencoder by
selecting active features. The computational complexity of the rough set based stacked autoencoder model is
linear 𝑂(𝑁), where 𝑂 indicates the order of magnitude and 𝑁 states input size. The proposed model
consumes 34 and 22 seconds to train and test the BI-RADS MRI and DCE-MRI datasets, which are
minimum related to other comparative classification models. Additionally, the stacked autoencoder easily
and effectively learns non-linear transformation with multiple layers and activation functions for better
disease classification. The computational complexity and training time are the major issues addressed in the
related work section that are effectively overcome by the rough set based stacked autoencoder model.
4. CONCLUSION
In this manuscript, a new rough set based stacked autoencoder model is implemented for effective
breast cancer detection. The aim of this research is to develop a feature optimizer and an effective deep
learning classifier for effective classification of breast cancer. Therefore, the most pre-dominant](https://image.slidesharecdn.com/2833005ijecedbk-240104040109-3b65bac3/75/Modified-fuzzy-rough-set-technique-with-stacked-autoencoder-model-for-magnetic-resonance-imaging-based-breast-cancer-detection-9-2048.jpg)
![Int J Elec & Comp Eng ISSN: 2088-8708
Modified fuzzy rough set technique with stacked autoencoder model for … (Sachin Kumar Mamdy)
303
discriminative feature vectors are selected utilizing the modified fuzzy rough set technique. Further, the
selected features are given as the input to the stacked autoencoder for classifying both the malignant and
benign breast lesions. The proposed rough set based stacked autoencoder model delivers superior
performance in the breast cancer recognition in terms of classification accuracy, PPV, specificity, NPV, and
sensitivity. In the experimental segment, the proposed rough set based stacked autoencoder model obtained
classification accuracy of 99% and 99.22% on the BI-RADS MRI and DCE-MRI datasets. The obtained
experimental outcomes are superior to the conventional classifiers and optimizers. Breast cancer detection by
the proposed rough set based stacked autoencoder model can assist doctors and pathologists in the
classification of abnormalities with maximum accuracy in minimal computational time. In future, a new
ensemble based deep learning model can be included in the proposed system to further detect the sub-stages
of breast cancer.
AUTHOR CONTRIBUTIONS
For this research work all authors’ have equally contributed in Conceptualization, methodology,
validation, resources, writing-original draft preparation, writing-review and editing.
REFERENCES
[1] R. Beňačka, D. Szabóová, Z. Guľašová, Z. Hertelyová, and J. Radoňák, “Classic and new markers in diagnostics and
classification of breast cancer,” Cancers, vol. 14, no. 21, Nov. 2022, doi: 10.3390/cancers14215444.
[2] H. Aljuaid, N. Alturki, N. Alsubaie, L. Cavallaro, and A. Liotta, “Computer-aided diagnosis for breast cancer classification using
deep neural networks and transfer learning,” Computer Methods and Programs in Biomedicine, vol. 223, Aug. 2022, doi:
10.1016/j.cmpb.2022.106951.
[3] M. I. Daoud, S. Abdel-Rahman, T. M. Bdair, M. S. Al-Najar, F. H. Al-Hawari, and R. Alazrai, “Breast tumor classification in
ultrasound images using combined deep and handcrafted features,” Sensors, vol. 20, no. 23, Nov. 2020, doi: 10.3390/s20236838.
[4] T. R. Mahesh, V. V. Kumar, V. Vivek, K. M. K. Raghunath, and G. S. Madhuri, “Early predictive model for breast cancer
classification using blended ensemble learning,” International Journal of System Assurance Engineering and Management, Jun.
2022, doi: 10.1007/s13198-022-01696-0.
[5] G. Murtaza, L. Shuib, A. W. A. Wahab, G. Mujtaba, and G. Raza, “Ensembled deep convolution neural network-based breast
cancer classification with misclassification reduction algorithms,” Multimedia Tools and Applications, vol. 79, no. 25–26, pp.
18447–18479, Jul. 2020, doi: 10.1007/s11042-020-08692-1.
[6] O. J. Egwom, M. Hassan, J. J. Tanimu, M. Hamada, and O. M. Ogar, “An LDA–SVM machine learning model for breast cancer
classification,” BioMedInformatics, vol. 2, no. 3, pp. 345–358, Jun. 2022, doi: 10.3390/biomedinformatics2030022.
[7] S. Boumaraf, X. Liu, C. Ferkous, and X. Ma, “A new computer-aided diagnosis system with modified genetic feature selection for
BI-RADS classification of breast masses in mammograms,” BioMed Research International, vol. 2020, pp. 1–17, May 2020, doi:
10.1155/2020/7695207.
[8] D. Sheth and M. L. Giger, “Artificial intelligence in the interpretation of breast cancer on MRI,” Journal of Magnetic Resonance
Imaging, vol. 51, no. 5, pp. 1310–1324, May 2020, doi: 10.1002/jmri.26878.
[9] M. Desai and M. Shah, “An anatomization on breast cancer detection and diagnosis employing multi-layer perceptron neural network
(MLP) and convolutional neural network (CNN),” Clinical eHealth, vol. 4, pp. 1–11, 2021, doi: 10.1016/j.ceh.2020.11.002.
[10] B. V Divyashree and G. H. Kumar, “Breast cancer mass detection in mammograms using gray difference weight and MSER
detector,” SN Computer Science, vol. 2, no. 2, Apr. 2021, doi: 10.1007/s42979-021-00452-8.
[11] Y. Shen et al., “An interpretable classifier for high-resolution breast cancer screening images utilizing weakly supervised
localization,” Medical Image Analysis, vol. 68, Feb. 2021, doi: 10.1016/j.media.2020.101908.
[12] M. Pavithra, R. Rajmohan, T. A. Kumar, and R. Ramya, “Prediction and classification of breast cancer using discriminative
learning models and techniques,” in Machine Vision Inspection Systems, Volume 2, Wiley, 2021, pp. 241–262.
[13] N. M. ud Din, R. A. Dar, M. Rasool, and A. Assad, “Breast cancer detection using deep learning: Datasets, methods, and
challenges ahead,” Computers in Biology and Medicine, vol. 149, Oct. 2022, doi: 10.1016/j.compbiomed.2022.106073.
[14] V. K. Singh et al., “Breast tumor segmentation and shape classification in mammograms using generative adversarial and
convolutional neural network,” Expert Systems with Applications, vol. 139, Jan. 2020, doi: 10.1016/j.eswa.2019.112855.
[15] A. M. Ibraheem, K. H. Rahouma, and H. F. A. Hamed, “Automatic MRI Breast tumor detection using discrete wavelet transform
and support vector machines,” in 2019 Novel Intelligent and Leading Emerging Sciences Conference (NILES), Oct. 2019, pp. 88–
91, doi: 10.1109/NILES.2019.8909345.
[16] S. Khan, N. Islam, Z. Jan, I. Ud Din, and J. J. P. C. Rodrigues, “A novel deep learning based framework for the detection and
classification of breast cancer using transfer learning,” Pattern Recognition Letters, vol. 125, pp. 1–6, Jul. 2019, doi:
10.1016/j.patrec.2019.03.022.
[17] D. A. Ragab, O. Attallah, M. Sharkas, J. Ren, and S. Marshall, “A framework for breast cancer classification using multi-
DCNNs,” Computers in Biology and Medicine, vol. 131, Apr. 2021, doi: 10.1016/j.compbiomed.2021.104245.
[18] S. A. Alanazi et al., “Boosting breast cancer detection using convolutional neural network,” Journal of Healthcare Engineering,
pp. 1–11, Apr. 2021, doi: 10.1155/2021/5528622.
[19] H. Fang, H. Fan, S. Lin, Z. Qing, and F. R. Sheykhahmad, “Automatic breast cancer detection based on optimized neural network
using whale optimization algorithm,” International Journal of Imaging Systems and Technology, vol. 31, no. 1, pp. 425–438, Mar.
2021, doi: 10.1002/ima.22468.
[20] M. Gravina, S. Marrone, M. Sansone, and C. Sansone, “DAE-CNN: Exploiting and disentangling contrast agent effects for breast
lesions classification in DCE-MRI,” Pattern Recognition Letters, vol. 145, pp. 67–73, May 2021, doi:
10.1016/j.patrec.2021.01.023.
[21] N. Chouhan, A. Khan, J. Z. Shah, M. Hussnain, and M. W. Khan, “Deep convolutional neural network and emotional learning
based breast cancer detection using digital mammography,” Computers in Biology and Medicine, vol. 132, May 2021, doi:
10.1016/j.compbiomed.2021.104318.](https://image.slidesharecdn.com/2833005ijecedbk-240104040109-3b65bac3/75/Modified-fuzzy-rough-set-technique-with-stacked-autoencoder-model-for-magnetic-resonance-imaging-based-breast-cancer-detection-10-2048.jpg)
![ ISSN: 2088-8708
Int J Elec & Comp Eng, Vol. 14, No. 1, February 2024: 294-304
304
[22] A. Khamparia et al., “Diagnosis of breast cancer based on modern mammography using hybrid transfer learning,”
Multidimensional Systems and Signal Processing, vol. 32, no. 2, pp. 747–765, Apr. 2021, doi: 10.1007/s11045-020-00756-7.
[23] A. H. Yurttakal, H. Erbay, T. İkizceli, and S. Karaçavuş, “Detection of breast cancer via deep convolution neural networks using
MRI images,” Multimedia Tools and Applications, vol. 79, no. 21–22, pp. 15555–15573, Jun. 2020, doi: 10.1007/s11042-019-
7479-6.
[24] A. Hizukuri, R. Nakayama, M. Nara, M. Suzuki, and K. Namba, “Computer-aided diagnosis scheme for distinguishing between
benign and malignant masses on breast DCE-MRI images using deep convolutional neural network with bayesian optimization,”
Journal of Digital Imaging, vol. 34, no. 1, pp. 116–123, Feb. 2021, doi: 10.1007/s10278-020-00394-2.
[25] U. K. Acharya and S. Kumar, “Genetic algorithm based adaptive histogram equalization (GAAHE) technique for medical image
enhancement,” Optik, vol. 230, Mar. 2021, doi: 10.1016/j.ijleo.2021.166273.
[26] T. Sadad, A. Munir, T. Saba, and A. Hussain, “Fuzzy C-means and region growing based classification of tumor from
mammograms using hybrid texture feature,” Journal of Computational Science, vol. 29, pp. 34–45, Nov. 2018, doi:
10.1016/j.jocs.2018.09.015.
[27] Z. Y. Tan, S. N. Basah, H. Yazid, and M. J. A. Safar, “Performance analysis of Otsu thresholding for sign language
segmentation,” Multimedia Tools and Applications, vol. 80, no. 14, pp. 21499–21520, Jun. 2021, doi: 10.1007/s11042-021-
10688-4.
[28] R. Biswas, S. Roy, and A. Biswas, “MRI and CT image indexing and retrieval using steerable pyramid transform and local
neighborhood difference pattern,” International Journal of Computers and Applications, vol. 44, no. 11, pp. 1005–1014, Nov.
2022, doi: 10.1080/1206212X.2022.2092937.
[29] M. O. Divya and E. R. Vimina, “Content based image retrieval with multi-channel LBP and colour features,” International
Journal of Applied Pattern Recognition, vol. 6, no. 2, 2020, doi: 10.1504/IJAPR.2020.10033780.
[30] M. Yu, T. Quan, Q. Peng, X. Yu, and L. Liu, “A model-based collaborate filtering algorithm based on stacked AutoEncoder,”
Neural Computing and Applications, vol. 34, no. 4, pp. 2503–2511, Feb. 2022, doi: 10.1007/s00521-021-05933-8.
BIOGRAPHIES OF AUTHORS
Sachin Kumar Mamdy completed B.E. from PDA college of Engineering,
Kalaburagi under VTU, Belagavi in the year 2010 and completed M. Tech from JNTU
Hyderabad in the year 2013. He has presented two papers in international conference. He can
be contacted at email: msachin834@gmail.com.
Vishwanath Petli completed his M.E from PDA Dollege of Engineering,
Gulbarga University, Gulbarga (Karnataka) in the year 2003 and completed his Ph. D. in the
year 2017 from NIMS University, Jaipur (Rajasthan). Presently working as Associate
Professor in the department of Electronics and Communication Engineering since 1998. His
area of interest are image processing and embedded system. He has published four papers in
international journals and presented one paper in international conference. He can be contacted
at email: vishalpetli73@gmail.com.](https://image.slidesharecdn.com/2833005ijecedbk-240104040109-3b65bac3/75/Modified-fuzzy-rough-set-technique-with-stacked-autoencoder-model-for-magnetic-resonance-imaging-based-breast-cancer-detection-11-2048.jpg)