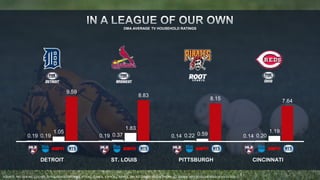
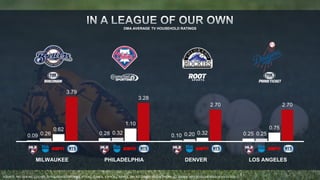
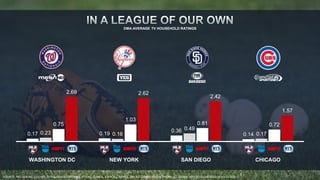
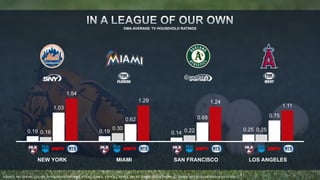
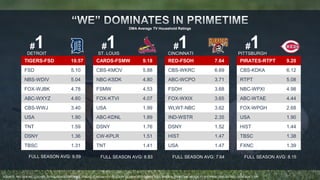
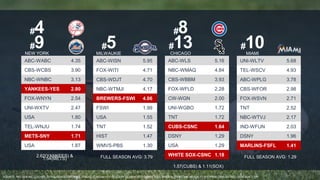
SlideShare a Scribd company logo
1 of 45
9% 
OTHE 
R 
43% 
30% 
7% 7% 4% 
SOURCE: 2013 FSMG CONSUMER RESEARCH: THE STATE OF BASEBALL FANDOM, Q2_1 WHICH OF THE FOLLOWING PRO SPORTS IS BEST DESCRIBED BY EACH OF THE FOLLOWING WORDS AND PHRASES? (I.E. THE MOST ALL-AMERICAN)
28 US MLB teams 
Over 4,000 live games 
Pre, In-game, Post
MLB saw an incredible resurgence in the heartland last year. Home towns like Detroit, Cleveland and Kansas City had history 
breaking ratings. It proves it’s anyone’s game to win, just ask the Pirates. In 2014, every team in the nation will put their gloves down 
to applaud fellow immortal Derek Jeter, even after he has beat‘em all. Whether this is the year of pitching vs. hitting, the year teams 
make their mark by shutting out a series or winning it in a ‘rubber match’, to players redeeming themselves and 
to rookies hitting it out of the park, nothing fits like a hand in a glove like baseball & America.
A50+ FEMA 
LE 
64% 
MEN 
49% 
A18-49 
* 
SOURCE: SCARBOROUGH, MULTI-MARKET 2013, RELEASE 2 TOTAL, AUG 2012-SEP 2013. HTS = WATCHED AN HTS RSN PAST 7 DAYS AND HOME TEAM MLB ON CABLE TV IN THE PAST 12 MONTHS. GENERIC = SPORTS WATCHED ON 
CABLE TV NETWORKS IN THE PAST 12 MONTHS WAS REGULAR SEASON MLB. | *SOURCE: NIELSEN NSI, LIVE+SD, DATA THROUGH 2013 MLB SEASON. DATA FOR HOME DMA (26 TEAMS), 21 LPM MARKETS.
The information on the following slide is from Scarborough only and leans 
more toward the pro male demographic. 
While the other demographic slide has both Scarborough and Nielsen 
information mixed together to create more of a male/female balance. 
Please use this slide if you have a client who has male centric brands.
A50+ FEMA 
SOURCE: SCARBOROUGH, MULTI-MARKET 2013, RELEASE 2 TOTAL, AUG 2012-SEP 2013. HTS = WATCHED AN HTS RSN PAST 7 DAYS AND HOME TEAM MLB ON CABLE TV 
IN THE PAST 12 MONTHS. GENERIC = SPORTS WATCHED ON CABLE TV NETWORKS IN THE PAST 12 MONTHS WAS REGULAR SEASON MLB. 
29% 
SINGLE MEN 
AVG HHI 71.8K 
76% 
MEN 
49% 
A18-49 
LE
SOURCE: 22% MORE ATTENTION (2013 FOX SPORTS FAN SEGMENTATION) 
SOURCE: 2.7X MORE TRUST THAN PRIME TIME (2013 MLB HOME TEAM FAN SMITHGEIGER ENGAGEMENT STUDY) 
SOURCE: +2x MORE LIKELY TO PURCHASE (2013 MLB HOME TEAM FAN SMITHGEIGER ENGAGEMENT STUDY) 
SOURCE: 61% SPEND MORE FOR HIGH QUALITY PRODUCTS (2013 FOX SPORTS FAN SEGMENTATION) 
SOURCE: 2.7X MORE LIKELY TO RECOMMEND & 2.7X FEEL MORE LOYAL 
(2013 MLB HOME TEAM FAN SMITHGEIGER ENGAGEMENT STUDY) 
2.7x 
More trust in home team ads 
than primetime 
+2X 
More likely to 
purchase a product 
2.7x 
More likely to 
recommend a product 
22% 
Pay more attention to all or 
most ads in live local games 
vs. generic games 
61% 
Are willing to spend more 
for high quality products 
2.7x 
Feel more loyal 
to a brand
35% 
FAMILY 
56% 
CO-VIEWING 
SOURCE: 2012 SMITHGEIGER MLB ENAGEMENT STUDY, Q7, 13, 18 – PREFERENCE OF WATCHING HOME MLB GAMES WITH 
21% 
FRIEND 
S
SOURCE: MLB HAS AN AVERAGE OF 150 GAMES OUT OF REGULAR SEASON 162 
92%
4.7M 
SOURCE: FOR ESPN, ESPN2, TBS, MLBN, AND ALL OTHER CABLE NETS: PUBLISHED INDUSTRY SOURCES 
SOURCE: FOR HTS: NIELSEN NSI PROJECTED TO A COVERAGE UNIVERSE 
890K 
490K 290K 190K
For the following two slides, please use one or the other 
(not both) to speak to the unbalanced nature of the number 
of games OR the number of time these teams appeared. 
There are notes below each slide to aid in your explanation 
of the content.
Your brand does not have the ability to connect with and establish 
relationships with all teams and their home team fans throughout the 
season with a national game buy! 
0% 1% 2% 6% 7% 8% 9% 11% 14% 16% 18% 23% 27% 
SOURCE: NIELSEN, OVERNIGHT DATA, ESPN, TBS 2013 SEASON
+378% 
ADVANTAGE IN REACH 
36.06M 
7.54 
M 
SOURCE: NIELSEN NSI. 19 DMA’S. 22 HTS TEAMS. GROSS REACH BASED ON EQUALLY BALANCED 50 UNIT SCHEDULES MEASURED ON HTS 
(VARIOUS HOME TEAMS) AND ESPN (MLB MON., WED., & SUN.) JULY 16TH THROUGH AUGUST 12TH 2012. ADULTS 25-54 
4.7 88% 
ADVANTAGE IN 
FREQUENCY 
2.5
1.05 
DMA AVERAGE TV HOUSEHOLD RATINGS 
1.83 
0.59 
0.19 0.19 0.19 0.37 0.14 0.22 0.14 0.20 
1.19 
9.59 
8.83 
8.15 7.64 
DETROIT ST. LOUIS PITTSBURGH CINCINNATI 
SOURCE: NIELSEN NSI, LIVE+SD, TV HOUSEHOLD RATINGS, HTS ALL GAMES, ESPN ALL GAMES, TBS ALL GAMES, MLB NETWORK ALL GAMES, 2013 REGULAR SEASON 4/1/13-9/29/13.
7.26 
DMA AVERAGE TV HOUSEHOLD RATINGS 
6.39 6.34 
1.43 1.14 0.91 0.84 
0.23 0.24 0.20 0.46 0.10 0.25 0.24 0.19 
5.55 
BOSTON KANSAS CITY BALTIMORE CLEVELAND 
SOURCE: NIELSEN NSI, LIVE+SD, TV HOUSEHOLD RATINGS, HTS ALL GAMES, ESPN ALL GAMES, TBS ALL GAMES, MLB NETWORK ALL GAMES, 2013 REGULAR SEASON 4/1/13-9/29/13.
DMA AVERAGE TV HOUSEHOLD RATINGS 
1.00 0.75 0.64 
0.27 0.08 0.16 0.46 0.21 0.17 0.24 0.21 
1.20 
4.93 
4.62 
4.23 4.12 
TAMPA DALLAS MINNEAPOLIS ATLANTA 
SOURCE: NIELSEN NSI, LIVE+SD, TV HOUSEHOLD RATINGS, HTS ALL GAMES, ESPN ALL GAMES, TBS ALL GAMES, MLB NETWORK ALL GAMES, 2013 REGULAR SEASON 4/1/13-9/29/13.
1.20 
DMA AVERAGE TV HOUSEHOLD RATINGS 
4.07 3.95 3.87 3.81 
0.68 0.64 0.81 
0.24 0.21 0.14 0.22 0.18 0.25 0.28 0.39 
ATLANTA SAN FRANCISCO SEATTLE PHOENIX 
SOURCE: NIELSEN NSI, LIVE+SD, TV HOUSEHOLD RATINGS, HTS ALL GAMES, ESPN ALL GAMES, TBS ALL GAMES, MLB NETWORK ALL GAMES, 2013 REGULAR SEASON 4/1/13-9/29/13.
0.62 
DMA AVERAGE TV HOUSEHOLD RATINGS 
1.10 
0.32 0.32 
0.09 0.26 0.28 0.10 0.20 0.25 0.25 
0.75 
3.79 
3.28 
2.70 2.70 
MILWAUKEE PHILADELPHIA DENVER LOS ANGELES 
SOURCE: NIELSEN NSI, LIVE+SD, TV HOUSEHOLD RATINGS, HTS ALL GAMES, ESPN ALL GAMES, TBS ALL GAMES, MLB NETWORK ALL GAMES, 2013 REGULAR SEASON 4/1/13-9/29/13.
0.17 0.19 
DMA AVERAGE TV HOUSEHOLD RATINGS 
0.36 
0.49 
0.23 0.16 0.14 
0.17 
0.75 
1.03 
0.81 0.72 
2.69 2.62 
2.42 
1.57 
WASHINGTON DC NEW YORK SAN DIEGO CHICAGO 
SOURCE: NIELSEN NSI, LIVE+SD, TV HOUSEHOLD RATINGS, HTS ALL GAMES, ESPN ALL GAMES, TBS ALL GAMES, MLB NETWORK ALL GAMES, 2013 REGULAR SEASON 4/1/13-9/29/13.
DMA AVERAGE TV HOUSEHOLD RATINGS 
0.19 0.19 0.14 
0.25 
0.16 
0.30 0.22 0.25 
1.03 
0.62 0.68 0.75 
1.54 
1.29 1.24 
1.11 
NEW YORK MIAMI SAN FRANCISCO LOS ANGELES 
SOURCE: NIELSEN NSI, LIVE+SD, TV HOUSEHOLD RATINGS, HTS ALL GAMES, ESPN ALL GAMES, TBS ALL GAMES, MLB NETWORK ALL GAMES, 2013 REGULAR SEASON 4/1/13-9/29/13.
DMA AVERAGE TV HOUSEHOLD RATINGS 
0.72 
0.17 0.18 
0.14 0.08 
0.37 
1.11 
0.39 
CHICAGO HOUSTON 
SOURCE: NIELSEN NSI, LIVE+SD, TV HOUSEHOLD RATINGS, HTS ALL GAMES, ESPN ALL GAMES, TBS ALL GAMES, MLB NETWORK ALL GAMES, 2013 REGULAR SEASON 4/1/13-9/29/13.
4% 5% 8% 8% 
2013 vs. 2012 
15% 18% 20% 24% 28% 30% 31% 
41% 43% 
70% 
SOURCE: NIELSEN NSI, LIVE+SD, TV HOUSEHOLD RATINGS, MLB ON RSNS, 2013 REGULAR SEASON VS. REGULAR SEASON 2012
The following slides for baseball are the final, full regular season 
ratings for the 2012-2013 season. Please use these slides as they 
are formatted to match this year’s upfront design. 
The research team releases 3 editions of the ratings per season 
per league. These generally fall within this timeframe: 
• Quarter season 
• Half season/All-Star week 
• Full regular season 
Please see the research folder on the SharePoint for all 
Home Team Dominance presentation releases that match your 
client’s needs.
#1 
DETROIT 
TIGERS-FSD 10.57 
FSD 5.10 
NBS-WDIV 5.04 
FOX-WJBK 4.78 
ABC-WXYZ 4.60 
CBS-WWJ 3.40 
USA 1.90 
TNT 1.59 
DSNY 1.36 
TBSC 1.31 
FULL SEASON AVG: 9.59 
DMA Average TV Household Ratings 
#1 
ST. LOUIS 
CARDS-FSMW 9.18 
CBS-KMOV 5.88 
NBC-KSDK 4.80 
FSMW 4.53 
FOX-KTVI 4.07 
USA 1.99 
ABC-KDNL 1.89 
DSNY 1.76 
CW-KPLR 1.51 
TNT 1.41 
FULL SEASON AVG: 8.83 
#1 
CINCINNATI 
RED-FSOH 7.64 
CBS-WKRC 6.69 
ABC-WCPO 3.71 
FSOH 3.68 
FOX-WXIX 3.65 
WLWT-NBC 3.62 
IND-WSTR 2.35 
DSNY 1.52 
HIST 1.47 
USA 1.47 
FULL SEASON AVG: 7.64 
#1 
PITTSBURGH 
PIRATES-RTPT 9.20 
CBS-KDKA 6.12 
RTPT 5.08 
NBC-WPXI 4.98 
ABC-WTAE 4.44 
FOX-WPGH 2.68 
USA 1.90 
HIST 1.44 
TBSC 1.38 
FXNC 1.39 
FULL SEASON AVG: 8.15 
SOURCE: NIELSEN NSI, LIVE+SD, TV HOUSEHOLD RATINGS, TABLES CONTAIN HTS REGULAR SEASON 2013 GAMES THAT AIRED IN PRIMETIME (M-SUN 7-11P). PRIMETIME DEFINED AS M-SUN 7-11P
#1 
BOSTON 
RED SOX-NESN 7.65 
CBS-WBZ 4.56 
NESN 4.34 
ABC-WCVB 3.92 
NBC-WHDH 3.78 
FOX-WFXT 2.33 
USA 1.80 
TBSC 1.24 
TNT 1.20 
DSNY 1.08 
FULL SEASON AVG: 7.26 
#1 
DMA Average TV Household Ratings 
BALTIMORE 
ORIOLES-MASN 6.88 
CBS-WJZ 5.40 
NBC-WBAL 4.77 
FOX-WBFF 2.99 
ABC-WMAR 2.26 
MASN 2.09 
USA 1.71 
IND-WUTB 1.46 
TBSC 1.44 
DSNY 1.39 
FULL SEASON AVG: 6.34 
#1 
KANSAS CITY 
ROYALS-FSKC 6.82 
CBS-KCTV 6.15 
ABC-KMBC 4.93 
FOX-WDAF 4.31 
NBC-KSHB 3.81 
FSKC 3.16 
USA 1.75 
HIST 1.40 
ESPN 1.38 
FXNC 1.38 
FULL SEASON AVG: 6.39 
#1 
CLEVELAND 
INDIANS-STO 6.07 
FOX-WJW 4.15 
CBS-WOIO 4.14 
ABC-WEWS 4.01 
NBC-WKYC 3.95 
STO 2.89 
USA 2.03 
TNT 1.62 
TBSC 1.45 
HIST 1.30 
FULL SEASON AVG: 5.55 
SOURCE: NIELSEN NSI, LIVE+SD, TV HOUSEHOLD RATINGS, TABLES CONTAIN HTS REGULAR SEASON 2013 GAMES THAT AIRED IN PRIMETIME (M-SUN 7-11P). PRIMETIME DEFINED AS M-SUN 7-11P
#1 
TAMPA 
RAYS-SUN 5.38 
CBS-WTSP 5.17 
NBC-WFLA 3.17 
FOX-WTVT 3.08 
ABC-WFTS 3.04 
SUN 2.67 
USA 2.02 
TNT 1.94 
FXNC 1.77 
IND-WMOR 1.49 
FULL SEASON AVG: 4.93 
DMA Average TV Household Ratings 
#1 
DALLAS 
RANGER-FSS 4.87 
CBS-KTVT 4.27 
ABC-WFAA 3.65 
NBC-KXAS 3.48 
UNI-KUVN 3.21 
FOX-KDFW 2.98 
FSS 1.90 
DSNY 1.62 
TNT 1.37 
USA 1.20 
FULL SEASON AVG: 4.62 
#1 
SEATTLE 
MARINERS-RTNW 4.62 
ABC-KOMO 3.98 
CBS-KIRO 3.86 
NBC-KING 3.68 
FOX-KCPQ 2.59 
RTNW 1.95 
TNT 1.26 
HIST 1.23 
IND-KONG 1.13 
IND-KZJO 1.11 
FULL SEASON AVG: 3.87 
#1 
PHOENIX 
D’BACKS-FSA 4.06 
CBS-KPHO 3.70 
NBC-KPNX 3.50 
ABC-KNXV 3.12 
FOX-KSAZ 2.91 
UNI-KTVW 2.23 
FSA 1.72 
IND-KTVK 1.67 
DSNY 1.46 
USA 1.24 
FULL SEASON AVG: 3.81 
SOURCE: NIELSEN NSI, LIVE+SD, TV HOUSEHOLD RATINGS, TABLES CONTAIN HTS REGULAR SEASON 2013 GAMES THAT AIRED IN PRIMETIME (M-SUN 7-11P). PRIMETIME DEFINED AS M-SUN 7-11P
#2 
ATLANTA 
ABC-WSB 5.60 
BRAVES-SPSO 4.63 
BRAVES-FSSO 4.37 
FOX-WAGA 3.20 
NBC-WXIA 3.04 
CBS-WGCL 2.74 
TNT 1.80 
DSNY 1.77 
USA 1.62 
ESPN 1.50 
4.12(FSSO) & 4.07(SPSO) 
#3 
MINNESOTA 
CBS-WCCO 6.16 
NBC-KARE 4.91 
TWINS-FSNO 4.47 
ABC-KSTP 3.85 
FOX-KMSP 3.00 
FSNO 2.35 
HIST 1.32 
HGTV 1.19 
IND-WFTC 1.10 
USA 1.04 
FULL SEASON AVG: 4.23 
#1 
#8 
SAN 
FRANCISCO 
GIANTS-CSBA 4.67 
ABC-KGO 3.14 
CBS-KPIX 3.03 
FOX-KTVU 2.95 
NBC-KNTV 2.50 
CSBA 1.67 
KDTV-UNI 1.58 
ATHLETICS-CSCA 1.37 
TNT 1.10 
KSTS-TEL 0.98 
3.95(GIANTS) & 
1.24(ATHLETICS) 
#3 
#12 
LOS ANGELES 
UNI-KMEX 3.99 
ABC-KABC 3.56 
DODGERS-FSPT 2.93 
CBS-KCBS 2.89 
NBC-KNBC 2.73 
FOX-KTTV 2.02 
DSNY 1.79 
KCAL 1.75 
PTZD 1.68 
TNT 1.41 
ANGELS-FSW 1.24 
2.70(DODGERS) & 
1.11(ANGELS) 
SOURCE: NIELSEN NSI, LIVE+SD, TV HOUSEHOLD RATINGS, TABLES CONTAIN HTS REGULAR SEASON 2013 GAMES THAT AIRED IN PRIMETIME (M-SUN 7-11P). PRIMETIME DEFINED AS M-SUN 7-11P
#3 
PHILADELPHI 
A 
ABC-WPVI 5.37 
CBS-KYW 4.49 
PHILLIES-CSN 3.43 
NBC-WCAU 3.33 
FOX-WTXF 2.46 
WPHL 2.15 
USA 1.88 
TNT 1.55 
ZCSN 1.44 
DSNY 1.38 
FULL SEASON AVG: 3.28 
#3 
DMA Average TV Household Ratings 
SAN DIEGO 
CBS-KFMB 3.78 
NBC-KNSD 3.66 
PADRES-FSSD 2.87 
ABC-KGTV 2.79 
FOX-KSWB 2.25 
KUSI 2.08 
DSNY 1.79 
XHAS-TEL 1.62 
TNT 1.39 
PBS-KPBS 1.30 
FULL SEASON AVG: 2.42 
#4 
DENVER 
NBC-KUSA 4.72 
CBS-KCNC 4.50 
ABC-KMGH 3.18 
ROCKIES-RTRM 2.90 
FOX-KDVR 1.97 
UNI-KCEC 1.32 
IND-KTVD 1.29 
RTRM 1.25 
CW-KWGN 1.05 
TNT 0.98 
FULL SEASON AVG: 2.70 
#4 
WASHINGTON 
DC 
NBC-WRC 3.75 
ABC-WJLA 3.26 
CBS-WUSA 3.18 
NAT’LS-MASN 2.84 
FOX-WTTG 2.80 
USA 1.65 
DSNY 1.57 
TNT 1.53 
IND-WDCA 1.31 
ESPN 1.19 
FULL SEASON AVG: 2.69 
SOURCE: NIELSEN NSI, LIVE+SD, TV HOUSEHOLD RATINGS, TABLES CONTAIN HTS REGULAR SEASON 2013 GAMES THAT AIRED IN PRIMETIME (M-SUN 7-11P). PRIMETIME DEFINED AS M-SUN 7-11P
#4 
#9 
NEW YORK 
ABC-WABC 4.35 
CBS-WCBS 3.90 
NBC-WNBC 3.13 
YANKEES-YES 2.80 
FOX-WNYN 2.54 
UNI-WXTV 2.47 
USA 1.80 
TEL-WNJU 1.74 
METS-SNY 1.71 
USA 1.87 
2.62(YANKEES) & 
1.54(METS) 
#8 
#13 
CHICAGO 
ABC-WLS 5.16 
NBC-WMAQ 4.84 
CBS-WBBM 3.93 
FOX-WFLD 2.28 
CW-WGN 2.00 
UNI-WGBO 1.72 
TNT 1.72 
CUBS-CSNC 1.64 
DSNY 1.29 
USA 1.29 
WHITE SOX-CSNC 1.18 
1.57(CUBS) & 1.11(SOX) 
#5 
MILWAUKIE 
ABC-WISN 5.95 
FOX-WITI 4.71 
CBS-WDJT 4.70 
NBC-WTMJI 4.17 
BREWERS-FSWI 4.06 
FSWI 1.99 
USA 1.55 
TNT 1.52 
HIST 1.47 
WMVS-PBS 1.30 
FULL SEASON AVG: 3.79 
#10 
MIAMI 
UNI-WLTV 5.68 
TEL-WSCV 4.93 
ABC-WPLG 3.78 
CBS-WFOR 2.98 
FOX-WSVN 2.71 
TNT 2.52 
NBC-WTVJ 2.17 
IND-WFUN 2.03 
DSNY 1.96 
MARLINS-FSFL 1.41 
FULL SEASON AVG: 1.29 
SOURCE: NIELSEN NSI, LIVE+SD, TV HOUSEHOLD RATINGS, TABLES CONTAIN HTS REGULAR SEASON 2013 GAMES THAT AIRED IN PRIMETIME (M-SUN 7-11P). PRIMETIME DEFINED AS M-SUN 7-11P
Please see the video library on SharePoint for these MLB case 
study video files: 
• Chevron 
• Subway 
• Head & Shoulders
Reach fans in their seats and suites and in high traffic areas like the 
concourse, bars and lounges, and at concessions stands 
• The seamless in-stadium complement to 
your television presence 
• Available in 21 MLB venues 
• Almost 10,000 screens 
• Reaches 36MM+ engaged, upscale 
MLB fans annually 
• Nielsen measured fan engagement 
• Provides video advertising, sponsored 
partnerships, in-venue experiences, 
social media activations
Citi Field 
Yankee Stadium 
Angels Stadium 
Wrigley Field 
US Cellular Field 
Rangers Stadium 
AT&T Park 
Oakland Alameda Stadium 
Fenway Park 
Turner Field 
Comerica Park 
Safeco Field 
Chase Field 
Tropicana Field 
Target Field 
Marlins Ballpark 
Progressive Field 
PNC Park 
Kaufman Stadium 
Miller Park 
Great American Ballpark
SCOREBOARD 
Client 
Logo 
• Video content ideas: 
• Idea One 
• Idea Two
• Featured on 450+ OF THE MOST PROMINENT NEWS SITES 
across the country including: NY Times, NY Daily News, LA Times, 
Chicago Tribune, Philadelphia Inquirer, Dallas Morning News & 
Boston Globe 
• Delivers PASSIONATE LOCAL fans, aggregated into the largest 
national audience in digital video 
• 21MM sports video uniques monthly and over 
200MM video streams per month (comScore April 2014) 
• ESPN 15MM 
• Yahoo! Sports 12MM 
• MLB.com 12MM
• Buy a specific sport, 
region/market or day-part 
• :15/:30 custom spots to appear 
in video pre roll 
• Post roll bumpers 
• Companion banners 
• Overlays 
BRAND 
PRE-ROLL 
LOGO 
INTEGRATION 
CUSTOM 
VIDEO 
OVERLAY 
COMPANION BANNER
Holidays are Happy. Happy New Year, Happy Father’s Day, 
Happy Memorial Day, etc.. Opening day of baseball has always 
been a happy celebration. A time of optimism, joy and the 
“We’ll win it this year!” Happy opening Week is the perfect 
intersection for a brand who wants to be part of one of 
America’s biggest annual celebrations. 
‘The Driver’ isn’t necessarily the MVP of the game, he’s 
potentially more valuable. He’s measured by leadership & 
the little things, not just day-to-day statistics & 
performance. Associating the game’s top drivers is with 
your brand puts you in the leadership position seat.
#1 We’re structured to deliver hyper-local content on 
a national scale. 
#2 
#3 
The tribes we tap into trust us, love us and 
return to our product year after year. 
We’re immune to the industry woes and hiccups 
that plague other entertainment channels 
because sports fans are addicts! 
#4 Invest early. 
HEART+BRAND=RESULTS
Baseball is All American 
SOURCE: On-line survey of MLB fans in February 2013, Smith Geiger 
• 2117 total respondents 
• 74% Male/26% Female 
• Age 18-49 
< PREVIOUS SLIDE 
OTHE 
R
• 22% pay more attention to all or most ads in live local games vs. generic games 
Source: 2013 Fox Sports Fan Segmentation, 3209 respondents; Q1/Q2/Q2_1 (row 
772), Attention Paid to Advertisements: 22% pay attention to all or most of the 
advertisements in live sporting event (local team) vs. 18% for live sporting event 
(teams outside your area). 
• 2.7x more trust in home team ads than prime time 
Source: 2013 MLB Home Team Fan SmithGeiger Engagement Study, 11,467 TV 
viewers in 12 markets Atlanta, Boston, Charlotte, Cincinnati, Columbus, Dallas, 
Detroit, Los Angeles, Minneapolis/St. Paul, Phoenix, San Francisco, St. Louis. Field 
date September 2013. Average income $79k; “Local sports viewers trust home team 
ads at 2.7 times the rate of prime time viewers watching their favorite shows. RSN 
MLB game 35% vs. favorite show in prime time 13%.” 
< PREVIOUS SLIDE 
• +2x more likely to purchase a product 
Source: 2013 MLB Home Team Fan SmithGeiger Engagement Study, 11,467 TV 
viewers in 12 markets Atlanta, Boston, Charlotte, Cincinnati, Columbus, Dallas, 
Detroit, Los Angeles, Minneapolis/St. Paul, phoenix, San Francisco, St. Louis. Field 
date September 2013. Average income $79k; “Home team fans are more than twice 
as likely as prime time viewers to buy a product they see advertised. RSN MLB game 
32% vs. favorite show in prime time 14%.” 
• 61% are willing to spend more for high quality products 
Source: 2013 Fox Sports Fan Segmentation, 3209 respondents; Q42 (row 1201), 
Work & Money: I am willing to spend more for high quality products. 
• 2.7x more likely to recommend a product 
Source: 2013 MLB Home Team Fan SmithGeiger Engagement Study, 11,467 TV viewers in 
12 markets Atlanta, Boston, Charlotte, Cincinnati, Columbus, Dallas, Detroit, Los Angeles, 
Minneapolis/St. Paul, Phoenix, San Francisco, St. Louis. Field date September 2013. 
Average income $79k; “Home team fans are 2.7 times more likely than prime time viewers to 
feel loyalty to a brand. RSN MLB game 32% vs. favorite show in prime time 12%.” 
• 2.7x feel more loyal to a brand 
Source: (Same as above); “Home team fans are 2.7 times more likely than prime time 
viewers to recommend a product. RSN MLB game 32% vs. favorite show in prime time 12%.”
You can find all of the videos from the upfront on the SharePoint. 
They can be found in folder: Video library > HTS > 2014
2 
Client 
Logo 
• Video content ideas: 
• Idea One 
• Idea Two 
Place a PNG of your 
client’s logo here 
You can change the 
color of the box to 
more closely match 
your client’s branding 
If you have unique 
content ideas, you can 
type them. 
You can change the 
color of the box to 
more closely match 
your client’s branding 
4 
vs. 
Create a more custom 
scoreboard if you have 
specific teams you 
might want to 
highlight.
SCOREBOARD 
Client 
Logo 
If you have a video 
mock-up of creative or 
a client’s commercial 
spot, you can place 
that video in this area 
to show how the 
content will live. 
This gameflow video 
is for reference only!

More Related Content

Similar to MLB vertical

Ncaa basketball 4.28.15 final
Ncaa basketball 4.28.15 finalNcaa basketball 4.28.15 final
Ncaa basketball 4.28.15 finalCox Media
 
May - June 2015 Bud Light Highlight Document
May - June 2015 Bud Light Highlight DocumentMay - June 2015 Bud Light Highlight Document
May - June 2015 Bud Light Highlight Documenteehrhard77
 
2015 upfront-v1
2015 upfront-v12015 upfront-v1
2015 upfront-v1HTS Sports
 
Mlb 4.28.15 final
Mlb 4.28.15 finalMlb 4.28.15 final
Mlb 4.28.15 finalCox Media
 
2008-09 Division One Sports Portfolio
2008-09 Division One Sports Portfolio2008-09 Division One Sports Portfolio
2008-09 Division One Sports Portfolioeweireter
 
Diamond Dollars Case Competition 2014
Diamond Dollars Case Competition 2014Diamond Dollars Case Competition 2014
Diamond Dollars Case Competition 2014Jeremy Losak
 
2009 Rangers Media Kit
2009 Rangers Media Kit2009 Rangers Media Kit
2009 Rangers Media Kitsjpuccinelli
 
7-Eleven and Cal Berkeley
7-Eleven and Cal Berkeley 7-Eleven and Cal Berkeley
7-Eleven and Cal Berkeley cocoadiva
 
Tv Newsletter Week of 11.12.10
Tv Newsletter Week of 11.12.10Tv Newsletter Week of 11.12.10
Tv Newsletter Week of 11.12.10caratsf
 
10 Year Rewind - There's Always Next Year
10 Year Rewind - There's Always Next Year10 Year Rewind - There's Always Next Year
10 Year Rewind - There's Always Next YearBrianTodd38
 
New York Red Bulls Pitch Deck
New York Red Bulls Pitch DeckNew York Red Bulls Pitch Deck
New York Red Bulls Pitch DeckKeith Stewart
 
Major League Baseball
Major League BaseballMajor League Baseball
Major League Baseballguest9db120
 
Diamond Dollars 2015 Presentation
Diamond Dollars 2015 PresentationDiamond Dollars 2015 Presentation
Diamond Dollars 2015 PresentationGregory Ackerman
 
Nfl 4.28.15 final
Nfl 4.28.15 finalNfl 4.28.15 final
Nfl 4.28.15 finalCox Media
 
Swot Analysis of the NBA
Swot Analysis of the NBASwot Analysis of the NBA
Swot Analysis of the NBAJordan Meleski
 

Similar to MLB vertical (20)

NBA vertical
NBA verticalNBA vertical
NBA vertical
 
NHL Vertical
NHL VerticalNHL Vertical
NHL Vertical
 
Ncaa basketball 4.28.15 final
Ncaa basketball 4.28.15 finalNcaa basketball 4.28.15 final
Ncaa basketball 4.28.15 final
 
May - June 2015 Bud Light Highlight Document
May - June 2015 Bud Light Highlight DocumentMay - June 2015 Bud Light Highlight Document
May - June 2015 Bud Light Highlight Document
 
2015 upfront-v1
2015 upfront-v12015 upfront-v1
2015 upfront-v1
 
Mlb 4.28.15 final
Mlb 4.28.15 finalMlb 4.28.15 final
Mlb 4.28.15 final
 
2008-09 Division One Sports Portfolio
2008-09 Division One Sports Portfolio2008-09 Division One Sports Portfolio
2008-09 Division One Sports Portfolio
 
Diamond Dollars Case Competition 2014
Diamond Dollars Case Competition 2014Diamond Dollars Case Competition 2014
Diamond Dollars Case Competition 2014
 
2009 Rangers Media Kit
2009 Rangers Media Kit2009 Rangers Media Kit
2009 Rangers Media Kit
 
7-Eleven and Cal Berkeley
7-Eleven and Cal Berkeley 7-Eleven and Cal Berkeley
7-Eleven and Cal Berkeley
 
designsample1
designsample1designsample1
designsample1
 
Tv Newsletter Week of 11.12.10
Tv Newsletter Week of 11.12.10Tv Newsletter Week of 11.12.10
Tv Newsletter Week of 11.12.10
 
10 Year Rewind - There's Always Next Year
10 Year Rewind - There's Always Next Year10 Year Rewind - There's Always Next Year
10 Year Rewind - There's Always Next Year
 
New York Red Bulls Pitch Deck
New York Red Bulls Pitch DeckNew York Red Bulls Pitch Deck
New York Red Bulls Pitch Deck
 
Major League Baseball
Major League BaseballMajor League Baseball
Major League Baseball
 
Diamond Dollars 2015 Presentation
Diamond Dollars 2015 PresentationDiamond Dollars 2015 Presentation
Diamond Dollars 2015 Presentation
 
Nfl 4.28.15 final
Nfl 4.28.15 finalNfl 4.28.15 final
Nfl 4.28.15 final
 
PMM HTS 2016
PMM HTS 2016PMM HTS 2016
PMM HTS 2016
 
NESN 2011 V2
NESN 2011 V2NESN 2011 V2
NESN 2011 V2
 
Swot Analysis of the NBA
Swot Analysis of the NBASwot Analysis of the NBA
Swot Analysis of the NBA
 

Recently uploaded

办理学位证(KCL文凭证书)伦敦国王学院毕业证成绩单原版一模一样
办理学位证(KCL文凭证书)伦敦国王学院毕业证成绩单原版一模一样办理学位证(KCL文凭证书)伦敦国王学院毕业证成绩单原版一模一样
办理学位证(KCL文凭证书)伦敦国王学院毕业证成绩单原版一模一样7pn7zv3i
 
Chennai Call Girls Anna Nagar Phone 🍆 8250192130 👅 celebrity escorts service
Chennai Call Girls Anna Nagar Phone 🍆 8250192130 👅 celebrity escorts serviceChennai Call Girls Anna Nagar Phone 🍆 8250192130 👅 celebrity escorts service
Chennai Call Girls Anna Nagar Phone 🍆 8250192130 👅 celebrity escorts servicevipmodelshub1
 
Atlanta Dream Exec Dan Gadd on Driving Fan Engagement and Growth, Serving the...
Atlanta Dream Exec Dan Gadd on Driving Fan Engagement and Growth, Serving the...Atlanta Dream Exec Dan Gadd on Driving Fan Engagement and Growth, Serving the...
Atlanta Dream Exec Dan Gadd on Driving Fan Engagement and Growth, Serving the...Neil Horowitz
 
Presentation: The symbols of the Olympic Games
Presentation: The symbols of the Olympic  GamesPresentation: The symbols of the Olympic  Games
Presentation: The symbols of the Olympic Gamesluciavilafernandez
 
ppt on Myself, Occupation and my Interest
ppt on Myself, Occupation and my Interestppt on Myself, Occupation and my Interest
ppt on Myself, Occupation and my InterestNagaissenValaydum
 
JORNADA 4 LIGA MURO 2024TUXTEPEC1234.pdf
JORNADA 4 LIGA MURO 2024TUXTEPEC1234.pdfJORNADA 4 LIGA MURO 2024TUXTEPEC1234.pdf
JORNADA 4 LIGA MURO 2024TUXTEPEC1234.pdfArturo Pacheco Alvarez
 
Croatia vs Italy UEFA Euro 2024 Croatia's Checkered Legacy on Display in New ...
Croatia vs Italy UEFA Euro 2024 Croatia's Checkered Legacy on Display in New ...Croatia vs Italy UEFA Euro 2024 Croatia's Checkered Legacy on Display in New ...
Croatia vs Italy UEFA Euro 2024 Croatia's Checkered Legacy on Display in New ...Eticketing.co
 
Plan d'orientations stratégiques rugby féminin
Plan d'orientations stratégiques rugby fémininPlan d'orientations stratégiques rugby féminin
Plan d'orientations stratégiques rugby fémininThibaut TATRY
 
France's UEFA Euro 2024 Ambitions Amid Coman's Injury.docx
France's UEFA Euro 2024 Ambitions Amid Coman's Injury.docxFrance's UEFA Euro 2024 Ambitions Amid Coman's Injury.docx
France's UEFA Euro 2024 Ambitions Amid Coman's Injury.docxEuro Cup 2024 Tickets
 
Indian Premiere League 2024 by livecricline
Indian Premiere League 2024 by livecriclineIndian Premiere League 2024 by livecricline
Indian Premiere League 2024 by livecriclineLive Cric Line
 
VIP Kolkata Call Girl Liluah 👉 8250192130 Available With Room
VIP Kolkata Call Girl Liluah 👉 8250192130  Available With RoomVIP Kolkata Call Girl Liluah 👉 8250192130  Available With Room
VIP Kolkata Call Girl Liluah 👉 8250192130 Available With Roomdivyansh0kumar0
 
Italy vs Albania Tickets: Italy's Quest for Euro Cup Germany History, Defendi...
Italy vs Albania Tickets: Italy's Quest for Euro Cup Germany History, Defendi...Italy vs Albania Tickets: Italy's Quest for Euro Cup Germany History, Defendi...
Italy vs Albania Tickets: Italy's Quest for Euro Cup Germany History, Defendi...Eticketing.co
 
大学假文凭《原版英国Imperial文凭》帝国理工学院毕业证制作成绩单修改
大学假文凭《原版英国Imperial文凭》帝国理工学院毕业证制作成绩单修改大学假文凭《原版英国Imperial文凭》帝国理工学院毕业证制作成绩单修改
大学假文凭《原版英国Imperial文凭》帝国理工学院毕业证制作成绩单修改atducpo
 
Dubai Call Girls Bikni O528786472 Call Girls Dubai Ebony
Dubai Call Girls Bikni O528786472 Call Girls Dubai EbonyDubai Call Girls Bikni O528786472 Call Girls Dubai Ebony
Dubai Call Girls Bikni O528786472 Call Girls Dubai Ebonyhf8803863
 
8377087607 ☎, Cash On Delivery Call Girls Service In Hauz Khas Delhi Enjoy 24/7
8377087607 ☎, Cash On Delivery Call Girls Service In Hauz Khas Delhi Enjoy 24/78377087607 ☎, Cash On Delivery Call Girls Service In Hauz Khas Delhi Enjoy 24/7
8377087607 ☎, Cash On Delivery Call Girls Service In Hauz Khas Delhi Enjoy 24/7dollysharma2066
 
Tableaux 9ème étape circuit fédéral 2024
Tableaux 9ème étape circuit fédéral 2024Tableaux 9ème étape circuit fédéral 2024
Tableaux 9ème étape circuit fédéral 2024HechemLaameri
 
Resultados del Campeonato mundial de Marcha por equipos Antalya 2024
Resultados del Campeonato mundial de Marcha por equipos Antalya 2024Resultados del Campeonato mundial de Marcha por equipos Antalya 2024
Resultados del Campeonato mundial de Marcha por equipos Antalya 2024Judith Chuquipul
 
大学学位办理《原版美国USD学位证书》圣地亚哥大学毕业证制作成绩单修改
大学学位办理《原版美国USD学位证书》圣地亚哥大学毕业证制作成绩单修改大学学位办理《原版美国USD学位证书》圣地亚哥大学毕业证制作成绩单修改
大学学位办理《原版美国USD学位证书》圣地亚哥大学毕业证制作成绩单修改atducpo
 

Recently uploaded (20)

办理学位证(KCL文凭证书)伦敦国王学院毕业证成绩单原版一模一样
办理学位证(KCL文凭证书)伦敦国王学院毕业证成绩单原版一模一样办理学位证(KCL文凭证书)伦敦国王学院毕业证成绩单原版一模一样
办理学位证(KCL文凭证书)伦敦国王学院毕业证成绩单原版一模一样
 
Chennai Call Girls Anna Nagar Phone 🍆 8250192130 👅 celebrity escorts service
Chennai Call Girls Anna Nagar Phone 🍆 8250192130 👅 celebrity escorts serviceChennai Call Girls Anna Nagar Phone 🍆 8250192130 👅 celebrity escorts service
Chennai Call Girls Anna Nagar Phone 🍆 8250192130 👅 celebrity escorts service
 
Atlanta Dream Exec Dan Gadd on Driving Fan Engagement and Growth, Serving the...
Atlanta Dream Exec Dan Gadd on Driving Fan Engagement and Growth, Serving the...Atlanta Dream Exec Dan Gadd on Driving Fan Engagement and Growth, Serving the...
Atlanta Dream Exec Dan Gadd on Driving Fan Engagement and Growth, Serving the...
 
Presentation: The symbols of the Olympic Games
Presentation: The symbols of the Olympic  GamesPresentation: The symbols of the Olympic  Games
Presentation: The symbols of the Olympic Games
 
ppt on Myself, Occupation and my Interest
ppt on Myself, Occupation and my Interestppt on Myself, Occupation and my Interest
ppt on Myself, Occupation and my Interest
 
JORNADA 4 LIGA MURO 2024TUXTEPEC1234.pdf
JORNADA 4 LIGA MURO 2024TUXTEPEC1234.pdfJORNADA 4 LIGA MURO 2024TUXTEPEC1234.pdf
JORNADA 4 LIGA MURO 2024TUXTEPEC1234.pdf
 
Croatia vs Italy UEFA Euro 2024 Croatia's Checkered Legacy on Display in New ...
Croatia vs Italy UEFA Euro 2024 Croatia's Checkered Legacy on Display in New ...Croatia vs Italy UEFA Euro 2024 Croatia's Checkered Legacy on Display in New ...
Croatia vs Italy UEFA Euro 2024 Croatia's Checkered Legacy on Display in New ...
 
young Call girls in Moolchand 🔝 9953056974 🔝 Delhi escort Service
young Call girls in Moolchand 🔝 9953056974 🔝 Delhi escort Serviceyoung Call girls in Moolchand 🔝 9953056974 🔝 Delhi escort Service
young Call girls in Moolchand 🔝 9953056974 🔝 Delhi escort Service
 
Plan d'orientations stratégiques rugby féminin
Plan d'orientations stratégiques rugby fémininPlan d'orientations stratégiques rugby féminin
Plan d'orientations stratégiques rugby féminin
 
France's UEFA Euro 2024 Ambitions Amid Coman's Injury.docx
France's UEFA Euro 2024 Ambitions Amid Coman's Injury.docxFrance's UEFA Euro 2024 Ambitions Amid Coman's Injury.docx
France's UEFA Euro 2024 Ambitions Amid Coman's Injury.docx
 
Stunning ➥8448380779▻ Call Girls In Delhi Cantt Delhi NCR
Stunning ➥8448380779▻ Call Girls In Delhi Cantt Delhi NCRStunning ➥8448380779▻ Call Girls In Delhi Cantt Delhi NCR
Stunning ➥8448380779▻ Call Girls In Delhi Cantt Delhi NCR
 
Indian Premiere League 2024 by livecricline
Indian Premiere League 2024 by livecriclineIndian Premiere League 2024 by livecricline
Indian Premiere League 2024 by livecricline
 
VIP Kolkata Call Girl Liluah 👉 8250192130 Available With Room
VIP Kolkata Call Girl Liluah 👉 8250192130  Available With RoomVIP Kolkata Call Girl Liluah 👉 8250192130  Available With Room
VIP Kolkata Call Girl Liluah 👉 8250192130 Available With Room
 
Italy vs Albania Tickets: Italy's Quest for Euro Cup Germany History, Defendi...
Italy vs Albania Tickets: Italy's Quest for Euro Cup Germany History, Defendi...Italy vs Albania Tickets: Italy's Quest for Euro Cup Germany History, Defendi...
Italy vs Albania Tickets: Italy's Quest for Euro Cup Germany History, Defendi...
 
大学假文凭《原版英国Imperial文凭》帝国理工学院毕业证制作成绩单修改
大学假文凭《原版英国Imperial文凭》帝国理工学院毕业证制作成绩单修改大学假文凭《原版英国Imperial文凭》帝国理工学院毕业证制作成绩单修改
大学假文凭《原版英国Imperial文凭》帝国理工学院毕业证制作成绩单修改
 
Dubai Call Girls Bikni O528786472 Call Girls Dubai Ebony
Dubai Call Girls Bikni O528786472 Call Girls Dubai EbonyDubai Call Girls Bikni O528786472 Call Girls Dubai Ebony
Dubai Call Girls Bikni O528786472 Call Girls Dubai Ebony
 
8377087607 ☎, Cash On Delivery Call Girls Service In Hauz Khas Delhi Enjoy 24/7
8377087607 ☎, Cash On Delivery Call Girls Service In Hauz Khas Delhi Enjoy 24/78377087607 ☎, Cash On Delivery Call Girls Service In Hauz Khas Delhi Enjoy 24/7
8377087607 ☎, Cash On Delivery Call Girls Service In Hauz Khas Delhi Enjoy 24/7
 
Tableaux 9ème étape circuit fédéral 2024
Tableaux 9ème étape circuit fédéral 2024Tableaux 9ème étape circuit fédéral 2024
Tableaux 9ème étape circuit fédéral 2024
 
Resultados del Campeonato mundial de Marcha por equipos Antalya 2024
Resultados del Campeonato mundial de Marcha por equipos Antalya 2024Resultados del Campeonato mundial de Marcha por equipos Antalya 2024
Resultados del Campeonato mundial de Marcha por equipos Antalya 2024
 
大学学位办理《原版美国USD学位证书》圣地亚哥大学毕业证制作成绩单修改
大学学位办理《原版美国USD学位证书》圣地亚哥大学毕业证制作成绩单修改大学学位办理《原版美国USD学位证书》圣地亚哥大学毕业证制作成绩单修改
大学学位办理《原版美国USD学位证书》圣地亚哥大学毕业证制作成绩单修改
 

MLB vertical

  • 1.
  • 2. 9% OTHE R 43% 30% 7% 7% 4% SOURCE: 2013 FSMG CONSUMER RESEARCH: THE STATE OF BASEBALL FANDOM, Q2_1 WHICH OF THE FOLLOWING PRO SPORTS IS BEST DESCRIBED BY EACH OF THE FOLLOWING WORDS AND PHRASES? (I.E. THE MOST ALL-AMERICAN)
  • 3. 28 US MLB teams Over 4,000 live games Pre, In-game, Post
  • 4. MLB saw an incredible resurgence in the heartland last year. Home towns like Detroit, Cleveland and Kansas City had history breaking ratings. It proves it’s anyone’s game to win, just ask the Pirates. In 2014, every team in the nation will put their gloves down to applaud fellow immortal Derek Jeter, even after he has beat‘em all. Whether this is the year of pitching vs. hitting, the year teams make their mark by shutting out a series or winning it in a ‘rubber match’, to players redeeming themselves and to rookies hitting it out of the park, nothing fits like a hand in a glove like baseball & America.
  • 5. A50+ FEMA LE 64% MEN 49% A18-49 * SOURCE: SCARBOROUGH, MULTI-MARKET 2013, RELEASE 2 TOTAL, AUG 2012-SEP 2013. HTS = WATCHED AN HTS RSN PAST 7 DAYS AND HOME TEAM MLB ON CABLE TV IN THE PAST 12 MONTHS. GENERIC = SPORTS WATCHED ON CABLE TV NETWORKS IN THE PAST 12 MONTHS WAS REGULAR SEASON MLB. | *SOURCE: NIELSEN NSI, LIVE+SD, DATA THROUGH 2013 MLB SEASON. DATA FOR HOME DMA (26 TEAMS), 21 LPM MARKETS.
  • 6. The information on the following slide is from Scarborough only and leans more toward the pro male demographic. While the other demographic slide has both Scarborough and Nielsen information mixed together to create more of a male/female balance. Please use this slide if you have a client who has male centric brands.
  • 7. A50+ FEMA SOURCE: SCARBOROUGH, MULTI-MARKET 2013, RELEASE 2 TOTAL, AUG 2012-SEP 2013. HTS = WATCHED AN HTS RSN PAST 7 DAYS AND HOME TEAM MLB ON CABLE TV IN THE PAST 12 MONTHS. GENERIC = SPORTS WATCHED ON CABLE TV NETWORKS IN THE PAST 12 MONTHS WAS REGULAR SEASON MLB. 29% SINGLE MEN AVG HHI 71.8K 76% MEN 49% A18-49 LE
  • 8. SOURCE: 22% MORE ATTENTION (2013 FOX SPORTS FAN SEGMENTATION) SOURCE: 2.7X MORE TRUST THAN PRIME TIME (2013 MLB HOME TEAM FAN SMITHGEIGER ENGAGEMENT STUDY) SOURCE: +2x MORE LIKELY TO PURCHASE (2013 MLB HOME TEAM FAN SMITHGEIGER ENGAGEMENT STUDY) SOURCE: 61% SPEND MORE FOR HIGH QUALITY PRODUCTS (2013 FOX SPORTS FAN SEGMENTATION) SOURCE: 2.7X MORE LIKELY TO RECOMMEND & 2.7X FEEL MORE LOYAL (2013 MLB HOME TEAM FAN SMITHGEIGER ENGAGEMENT STUDY) 2.7x More trust in home team ads than primetime +2X More likely to purchase a product 2.7x More likely to recommend a product 22% Pay more attention to all or most ads in live local games vs. generic games 61% Are willing to spend more for high quality products 2.7x Feel more loyal to a brand
  • 9. 35% FAMILY 56% CO-VIEWING SOURCE: 2012 SMITHGEIGER MLB ENAGEMENT STUDY, Q7, 13, 18 – PREFERENCE OF WATCHING HOME MLB GAMES WITH 21% FRIEND S
  • 10. SOURCE: MLB HAS AN AVERAGE OF 150 GAMES OUT OF REGULAR SEASON 162 92%
  • 11. 4.7M SOURCE: FOR ESPN, ESPN2, TBS, MLBN, AND ALL OTHER CABLE NETS: PUBLISHED INDUSTRY SOURCES SOURCE: FOR HTS: NIELSEN NSI PROJECTED TO A COVERAGE UNIVERSE 890K 490K 290K 190K
  • 12. For the following two slides, please use one or the other (not both) to speak to the unbalanced nature of the number of games OR the number of time these teams appeared. There are notes below each slide to aid in your explanation of the content.
  • 13. Your brand does not have the ability to connect with and establish relationships with all teams and their home team fans throughout the season with a national game buy! 0% 1% 2% 6% 7% 8% 9% 11% 14% 16% 18% 23% 27% SOURCE: NIELSEN, OVERNIGHT DATA, ESPN, TBS 2013 SEASON
  • 14. SOURCE: NIELSEN, OVERNIGHT DATA, ESPN, TBS 2013 SEASON
  • 15. +378% ADVANTAGE IN REACH 36.06M 7.54 M SOURCE: NIELSEN NSI. 19 DMA’S. 22 HTS TEAMS. GROSS REACH BASED ON EQUALLY BALANCED 50 UNIT SCHEDULES MEASURED ON HTS (VARIOUS HOME TEAMS) AND ESPN (MLB MON., WED., & SUN.) JULY 16TH THROUGH AUGUST 12TH 2012. ADULTS 25-54 4.7 88% ADVANTAGE IN FREQUENCY 2.5
  • 16. 1.05 DMA AVERAGE TV HOUSEHOLD RATINGS 1.83 0.59 0.19 0.19 0.19 0.37 0.14 0.22 0.14 0.20 1.19 9.59 8.83 8.15 7.64 DETROIT ST. LOUIS PITTSBURGH CINCINNATI SOURCE: NIELSEN NSI, LIVE+SD, TV HOUSEHOLD RATINGS, HTS ALL GAMES, ESPN ALL GAMES, TBS ALL GAMES, MLB NETWORK ALL GAMES, 2013 REGULAR SEASON 4/1/13-9/29/13.
  • 17. 7.26 DMA AVERAGE TV HOUSEHOLD RATINGS 6.39 6.34 1.43 1.14 0.91 0.84 0.23 0.24 0.20 0.46 0.10 0.25 0.24 0.19 5.55 BOSTON KANSAS CITY BALTIMORE CLEVELAND SOURCE: NIELSEN NSI, LIVE+SD, TV HOUSEHOLD RATINGS, HTS ALL GAMES, ESPN ALL GAMES, TBS ALL GAMES, MLB NETWORK ALL GAMES, 2013 REGULAR SEASON 4/1/13-9/29/13.
  • 18. DMA AVERAGE TV HOUSEHOLD RATINGS 1.00 0.75 0.64 0.27 0.08 0.16 0.46 0.21 0.17 0.24 0.21 1.20 4.93 4.62 4.23 4.12 TAMPA DALLAS MINNEAPOLIS ATLANTA SOURCE: NIELSEN NSI, LIVE+SD, TV HOUSEHOLD RATINGS, HTS ALL GAMES, ESPN ALL GAMES, TBS ALL GAMES, MLB NETWORK ALL GAMES, 2013 REGULAR SEASON 4/1/13-9/29/13.
  • 19. 1.20 DMA AVERAGE TV HOUSEHOLD RATINGS 4.07 3.95 3.87 3.81 0.68 0.64 0.81 0.24 0.21 0.14 0.22 0.18 0.25 0.28 0.39 ATLANTA SAN FRANCISCO SEATTLE PHOENIX SOURCE: NIELSEN NSI, LIVE+SD, TV HOUSEHOLD RATINGS, HTS ALL GAMES, ESPN ALL GAMES, TBS ALL GAMES, MLB NETWORK ALL GAMES, 2013 REGULAR SEASON 4/1/13-9/29/13.
  • 20. 0.62 DMA AVERAGE TV HOUSEHOLD RATINGS 1.10 0.32 0.32 0.09 0.26 0.28 0.10 0.20 0.25 0.25 0.75 3.79 3.28 2.70 2.70 MILWAUKEE PHILADELPHIA DENVER LOS ANGELES SOURCE: NIELSEN NSI, LIVE+SD, TV HOUSEHOLD RATINGS, HTS ALL GAMES, ESPN ALL GAMES, TBS ALL GAMES, MLB NETWORK ALL GAMES, 2013 REGULAR SEASON 4/1/13-9/29/13.
  • 21. 0.17 0.19 DMA AVERAGE TV HOUSEHOLD RATINGS 0.36 0.49 0.23 0.16 0.14 0.17 0.75 1.03 0.81 0.72 2.69 2.62 2.42 1.57 WASHINGTON DC NEW YORK SAN DIEGO CHICAGO SOURCE: NIELSEN NSI, LIVE+SD, TV HOUSEHOLD RATINGS, HTS ALL GAMES, ESPN ALL GAMES, TBS ALL GAMES, MLB NETWORK ALL GAMES, 2013 REGULAR SEASON 4/1/13-9/29/13.
  • 22. DMA AVERAGE TV HOUSEHOLD RATINGS 0.19 0.19 0.14 0.25 0.16 0.30 0.22 0.25 1.03 0.62 0.68 0.75 1.54 1.29 1.24 1.11 NEW YORK MIAMI SAN FRANCISCO LOS ANGELES SOURCE: NIELSEN NSI, LIVE+SD, TV HOUSEHOLD RATINGS, HTS ALL GAMES, ESPN ALL GAMES, TBS ALL GAMES, MLB NETWORK ALL GAMES, 2013 REGULAR SEASON 4/1/13-9/29/13.
  • 23. DMA AVERAGE TV HOUSEHOLD RATINGS 0.72 0.17 0.18 0.14 0.08 0.37 1.11 0.39 CHICAGO HOUSTON SOURCE: NIELSEN NSI, LIVE+SD, TV HOUSEHOLD RATINGS, HTS ALL GAMES, ESPN ALL GAMES, TBS ALL GAMES, MLB NETWORK ALL GAMES, 2013 REGULAR SEASON 4/1/13-9/29/13.
  • 24. 4% 5% 8% 8% 2013 vs. 2012 15% 18% 20% 24% 28% 30% 31% 41% 43% 70% SOURCE: NIELSEN NSI, LIVE+SD, TV HOUSEHOLD RATINGS, MLB ON RSNS, 2013 REGULAR SEASON VS. REGULAR SEASON 2012
  • 25. The following slides for baseball are the final, full regular season ratings for the 2012-2013 season. Please use these slides as they are formatted to match this year’s upfront design. The research team releases 3 editions of the ratings per season per league. These generally fall within this timeframe: • Quarter season • Half season/All-Star week • Full regular season Please see the research folder on the SharePoint for all Home Team Dominance presentation releases that match your client’s needs.
  • 26. #1 DETROIT TIGERS-FSD 10.57 FSD 5.10 NBS-WDIV 5.04 FOX-WJBK 4.78 ABC-WXYZ 4.60 CBS-WWJ 3.40 USA 1.90 TNT 1.59 DSNY 1.36 TBSC 1.31 FULL SEASON AVG: 9.59 DMA Average TV Household Ratings #1 ST. LOUIS CARDS-FSMW 9.18 CBS-KMOV 5.88 NBC-KSDK 4.80 FSMW 4.53 FOX-KTVI 4.07 USA 1.99 ABC-KDNL 1.89 DSNY 1.76 CW-KPLR 1.51 TNT 1.41 FULL SEASON AVG: 8.83 #1 CINCINNATI RED-FSOH 7.64 CBS-WKRC 6.69 ABC-WCPO 3.71 FSOH 3.68 FOX-WXIX 3.65 WLWT-NBC 3.62 IND-WSTR 2.35 DSNY 1.52 HIST 1.47 USA 1.47 FULL SEASON AVG: 7.64 #1 PITTSBURGH PIRATES-RTPT 9.20 CBS-KDKA 6.12 RTPT 5.08 NBC-WPXI 4.98 ABC-WTAE 4.44 FOX-WPGH 2.68 USA 1.90 HIST 1.44 TBSC 1.38 FXNC 1.39 FULL SEASON AVG: 8.15 SOURCE: NIELSEN NSI, LIVE+SD, TV HOUSEHOLD RATINGS, TABLES CONTAIN HTS REGULAR SEASON 2013 GAMES THAT AIRED IN PRIMETIME (M-SUN 7-11P). PRIMETIME DEFINED AS M-SUN 7-11P
  • 27. #1 BOSTON RED SOX-NESN 7.65 CBS-WBZ 4.56 NESN 4.34 ABC-WCVB 3.92 NBC-WHDH 3.78 FOX-WFXT 2.33 USA 1.80 TBSC 1.24 TNT 1.20 DSNY 1.08 FULL SEASON AVG: 7.26 #1 DMA Average TV Household Ratings BALTIMORE ORIOLES-MASN 6.88 CBS-WJZ 5.40 NBC-WBAL 4.77 FOX-WBFF 2.99 ABC-WMAR 2.26 MASN 2.09 USA 1.71 IND-WUTB 1.46 TBSC 1.44 DSNY 1.39 FULL SEASON AVG: 6.34 #1 KANSAS CITY ROYALS-FSKC 6.82 CBS-KCTV 6.15 ABC-KMBC 4.93 FOX-WDAF 4.31 NBC-KSHB 3.81 FSKC 3.16 USA 1.75 HIST 1.40 ESPN 1.38 FXNC 1.38 FULL SEASON AVG: 6.39 #1 CLEVELAND INDIANS-STO 6.07 FOX-WJW 4.15 CBS-WOIO 4.14 ABC-WEWS 4.01 NBC-WKYC 3.95 STO 2.89 USA 2.03 TNT 1.62 TBSC 1.45 HIST 1.30 FULL SEASON AVG: 5.55 SOURCE: NIELSEN NSI, LIVE+SD, TV HOUSEHOLD RATINGS, TABLES CONTAIN HTS REGULAR SEASON 2013 GAMES THAT AIRED IN PRIMETIME (M-SUN 7-11P). PRIMETIME DEFINED AS M-SUN 7-11P
  • 28. #1 TAMPA RAYS-SUN 5.38 CBS-WTSP 5.17 NBC-WFLA 3.17 FOX-WTVT 3.08 ABC-WFTS 3.04 SUN 2.67 USA 2.02 TNT 1.94 FXNC 1.77 IND-WMOR 1.49 FULL SEASON AVG: 4.93 DMA Average TV Household Ratings #1 DALLAS RANGER-FSS 4.87 CBS-KTVT 4.27 ABC-WFAA 3.65 NBC-KXAS 3.48 UNI-KUVN 3.21 FOX-KDFW 2.98 FSS 1.90 DSNY 1.62 TNT 1.37 USA 1.20 FULL SEASON AVG: 4.62 #1 SEATTLE MARINERS-RTNW 4.62 ABC-KOMO 3.98 CBS-KIRO 3.86 NBC-KING 3.68 FOX-KCPQ 2.59 RTNW 1.95 TNT 1.26 HIST 1.23 IND-KONG 1.13 IND-KZJO 1.11 FULL SEASON AVG: 3.87 #1 PHOENIX D’BACKS-FSA 4.06 CBS-KPHO 3.70 NBC-KPNX 3.50 ABC-KNXV 3.12 FOX-KSAZ 2.91 UNI-KTVW 2.23 FSA 1.72 IND-KTVK 1.67 DSNY 1.46 USA 1.24 FULL SEASON AVG: 3.81 SOURCE: NIELSEN NSI, LIVE+SD, TV HOUSEHOLD RATINGS, TABLES CONTAIN HTS REGULAR SEASON 2013 GAMES THAT AIRED IN PRIMETIME (M-SUN 7-11P). PRIMETIME DEFINED AS M-SUN 7-11P
  • 29. #2 ATLANTA ABC-WSB 5.60 BRAVES-SPSO 4.63 BRAVES-FSSO 4.37 FOX-WAGA 3.20 NBC-WXIA 3.04 CBS-WGCL 2.74 TNT 1.80 DSNY 1.77 USA 1.62 ESPN 1.50 4.12(FSSO) & 4.07(SPSO) #3 MINNESOTA CBS-WCCO 6.16 NBC-KARE 4.91 TWINS-FSNO 4.47 ABC-KSTP 3.85 FOX-KMSP 3.00 FSNO 2.35 HIST 1.32 HGTV 1.19 IND-WFTC 1.10 USA 1.04 FULL SEASON AVG: 4.23 #1 #8 SAN FRANCISCO GIANTS-CSBA 4.67 ABC-KGO 3.14 CBS-KPIX 3.03 FOX-KTVU 2.95 NBC-KNTV 2.50 CSBA 1.67 KDTV-UNI 1.58 ATHLETICS-CSCA 1.37 TNT 1.10 KSTS-TEL 0.98 3.95(GIANTS) & 1.24(ATHLETICS) #3 #12 LOS ANGELES UNI-KMEX 3.99 ABC-KABC 3.56 DODGERS-FSPT 2.93 CBS-KCBS 2.89 NBC-KNBC 2.73 FOX-KTTV 2.02 DSNY 1.79 KCAL 1.75 PTZD 1.68 TNT 1.41 ANGELS-FSW 1.24 2.70(DODGERS) & 1.11(ANGELS) SOURCE: NIELSEN NSI, LIVE+SD, TV HOUSEHOLD RATINGS, TABLES CONTAIN HTS REGULAR SEASON 2013 GAMES THAT AIRED IN PRIMETIME (M-SUN 7-11P). PRIMETIME DEFINED AS M-SUN 7-11P
  • 30. #3 PHILADELPHI A ABC-WPVI 5.37 CBS-KYW 4.49 PHILLIES-CSN 3.43 NBC-WCAU 3.33 FOX-WTXF 2.46 WPHL 2.15 USA 1.88 TNT 1.55 ZCSN 1.44 DSNY 1.38 FULL SEASON AVG: 3.28 #3 DMA Average TV Household Ratings SAN DIEGO CBS-KFMB 3.78 NBC-KNSD 3.66 PADRES-FSSD 2.87 ABC-KGTV 2.79 FOX-KSWB 2.25 KUSI 2.08 DSNY 1.79 XHAS-TEL 1.62 TNT 1.39 PBS-KPBS 1.30 FULL SEASON AVG: 2.42 #4 DENVER NBC-KUSA 4.72 CBS-KCNC 4.50 ABC-KMGH 3.18 ROCKIES-RTRM 2.90 FOX-KDVR 1.97 UNI-KCEC 1.32 IND-KTVD 1.29 RTRM 1.25 CW-KWGN 1.05 TNT 0.98 FULL SEASON AVG: 2.70 #4 WASHINGTON DC NBC-WRC 3.75 ABC-WJLA 3.26 CBS-WUSA 3.18 NAT’LS-MASN 2.84 FOX-WTTG 2.80 USA 1.65 DSNY 1.57 TNT 1.53 IND-WDCA 1.31 ESPN 1.19 FULL SEASON AVG: 2.69 SOURCE: NIELSEN NSI, LIVE+SD, TV HOUSEHOLD RATINGS, TABLES CONTAIN HTS REGULAR SEASON 2013 GAMES THAT AIRED IN PRIMETIME (M-SUN 7-11P). PRIMETIME DEFINED AS M-SUN 7-11P
  • 31. #4 #9 NEW YORK ABC-WABC 4.35 CBS-WCBS 3.90 NBC-WNBC 3.13 YANKEES-YES 2.80 FOX-WNYN 2.54 UNI-WXTV 2.47 USA 1.80 TEL-WNJU 1.74 METS-SNY 1.71 USA 1.87 2.62(YANKEES) & 1.54(METS) #8 #13 CHICAGO ABC-WLS 5.16 NBC-WMAQ 4.84 CBS-WBBM 3.93 FOX-WFLD 2.28 CW-WGN 2.00 UNI-WGBO 1.72 TNT 1.72 CUBS-CSNC 1.64 DSNY 1.29 USA 1.29 WHITE SOX-CSNC 1.18 1.57(CUBS) & 1.11(SOX) #5 MILWAUKIE ABC-WISN 5.95 FOX-WITI 4.71 CBS-WDJT 4.70 NBC-WTMJI 4.17 BREWERS-FSWI 4.06 FSWI 1.99 USA 1.55 TNT 1.52 HIST 1.47 WMVS-PBS 1.30 FULL SEASON AVG: 3.79 #10 MIAMI UNI-WLTV 5.68 TEL-WSCV 4.93 ABC-WPLG 3.78 CBS-WFOR 2.98 FOX-WSVN 2.71 TNT 2.52 NBC-WTVJ 2.17 IND-WFUN 2.03 DSNY 1.96 MARLINS-FSFL 1.41 FULL SEASON AVG: 1.29 SOURCE: NIELSEN NSI, LIVE+SD, TV HOUSEHOLD RATINGS, TABLES CONTAIN HTS REGULAR SEASON 2013 GAMES THAT AIRED IN PRIMETIME (M-SUN 7-11P). PRIMETIME DEFINED AS M-SUN 7-11P
  • 32. Please see the video library on SharePoint for these MLB case study video files: • Chevron • Subway • Head & Shoulders
  • 33. Reach fans in their seats and suites and in high traffic areas like the concourse, bars and lounges, and at concessions stands • The seamless in-stadium complement to your television presence • Available in 21 MLB venues • Almost 10,000 screens • Reaches 36MM+ engaged, upscale MLB fans annually • Nielsen measured fan engagement • Provides video advertising, sponsored partnerships, in-venue experiences, social media activations
  • 34. Citi Field Yankee Stadium Angels Stadium Wrigley Field US Cellular Field Rangers Stadium AT&T Park Oakland Alameda Stadium Fenway Park Turner Field Comerica Park Safeco Field Chase Field Tropicana Field Target Field Marlins Ballpark Progressive Field PNC Park Kaufman Stadium Miller Park Great American Ballpark
  • 35. SCOREBOARD Client Logo • Video content ideas: • Idea One • Idea Two
  • 36. • Featured on 450+ OF THE MOST PROMINENT NEWS SITES across the country including: NY Times, NY Daily News, LA Times, Chicago Tribune, Philadelphia Inquirer, Dallas Morning News & Boston Globe • Delivers PASSIONATE LOCAL fans, aggregated into the largest national audience in digital video • 21MM sports video uniques monthly and over 200MM video streams per month (comScore April 2014) • ESPN 15MM • Yahoo! Sports 12MM • MLB.com 12MM
  • 37. • Buy a specific sport, region/market or day-part • :15/:30 custom spots to appear in video pre roll • Post roll bumpers • Companion banners • Overlays BRAND PRE-ROLL LOGO INTEGRATION CUSTOM VIDEO OVERLAY COMPANION BANNER
  • 38. Holidays are Happy. Happy New Year, Happy Father’s Day, Happy Memorial Day, etc.. Opening day of baseball has always been a happy celebration. A time of optimism, joy and the “We’ll win it this year!” Happy opening Week is the perfect intersection for a brand who wants to be part of one of America’s biggest annual celebrations. ‘The Driver’ isn’t necessarily the MVP of the game, he’s potentially more valuable. He’s measured by leadership & the little things, not just day-to-day statistics & performance. Associating the game’s top drivers is with your brand puts you in the leadership position seat.
  • 39. #1 We’re structured to deliver hyper-local content on a national scale. #2 #3 The tribes we tap into trust us, love us and return to our product year after year. We’re immune to the industry woes and hiccups that plague other entertainment channels because sports fans are addicts! #4 Invest early. HEART+BRAND=RESULTS
  • 40.
  • 41. Baseball is All American SOURCE: On-line survey of MLB fans in February 2013, Smith Geiger • 2117 total respondents • 74% Male/26% Female • Age 18-49 < PREVIOUS SLIDE OTHE R
  • 42. • 22% pay more attention to all or most ads in live local games vs. generic games Source: 2013 Fox Sports Fan Segmentation, 3209 respondents; Q1/Q2/Q2_1 (row 772), Attention Paid to Advertisements: 22% pay attention to all or most of the advertisements in live sporting event (local team) vs. 18% for live sporting event (teams outside your area). • 2.7x more trust in home team ads than prime time Source: 2013 MLB Home Team Fan SmithGeiger Engagement Study, 11,467 TV viewers in 12 markets Atlanta, Boston, Charlotte, Cincinnati, Columbus, Dallas, Detroit, Los Angeles, Minneapolis/St. Paul, Phoenix, San Francisco, St. Louis. Field date September 2013. Average income $79k; “Local sports viewers trust home team ads at 2.7 times the rate of prime time viewers watching their favorite shows. RSN MLB game 35% vs. favorite show in prime time 13%.” < PREVIOUS SLIDE • +2x more likely to purchase a product Source: 2013 MLB Home Team Fan SmithGeiger Engagement Study, 11,467 TV viewers in 12 markets Atlanta, Boston, Charlotte, Cincinnati, Columbus, Dallas, Detroit, Los Angeles, Minneapolis/St. Paul, phoenix, San Francisco, St. Louis. Field date September 2013. Average income $79k; “Home team fans are more than twice as likely as prime time viewers to buy a product they see advertised. RSN MLB game 32% vs. favorite show in prime time 14%.” • 61% are willing to spend more for high quality products Source: 2013 Fox Sports Fan Segmentation, 3209 respondents; Q42 (row 1201), Work & Money: I am willing to spend more for high quality products. • 2.7x more likely to recommend a product Source: 2013 MLB Home Team Fan SmithGeiger Engagement Study, 11,467 TV viewers in 12 markets Atlanta, Boston, Charlotte, Cincinnati, Columbus, Dallas, Detroit, Los Angeles, Minneapolis/St. Paul, Phoenix, San Francisco, St. Louis. Field date September 2013. Average income $79k; “Home team fans are 2.7 times more likely than prime time viewers to feel loyalty to a brand. RSN MLB game 32% vs. favorite show in prime time 12%.” • 2.7x feel more loyal to a brand Source: (Same as above); “Home team fans are 2.7 times more likely than prime time viewers to recommend a product. RSN MLB game 32% vs. favorite show in prime time 12%.”
  • 43. You can find all of the videos from the upfront on the SharePoint. They can be found in folder: Video library > HTS > 2014
  • 44. 2 Client Logo • Video content ideas: • Idea One • Idea Two Place a PNG of your client’s logo here You can change the color of the box to more closely match your client’s branding If you have unique content ideas, you can type them. You can change the color of the box to more closely match your client’s branding 4 vs. Create a more custom scoreboard if you have specific teams you might want to highlight.
  • 45. SCOREBOARD Client Logo If you have a video mock-up of creative or a client’s commercial spot, you can place that video in this area to show how the content will live. This gameflow video is for reference only!

Editor's Notes

  1. NBA Brand awareness:2.5x greater real & 23% more attention to an ad in live local games vs. generic games & three commercial pods are 2.5 more effective than traditional pods Trust: 2x more than prime time Purchase intent: 60% more likely to be an early adopter & 60 % more likely to buy a product than the general tv viewer Advocacy & loyalty: 1.7x more likely to recommend a product & 75% choose to watch with friends or family, equally