Download as PDF, PPTX


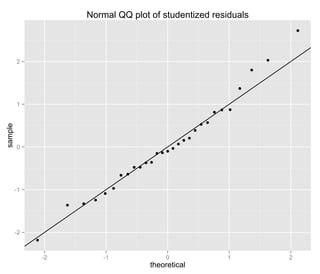

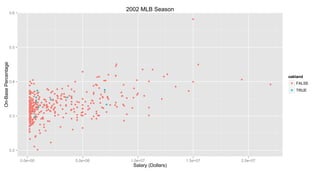
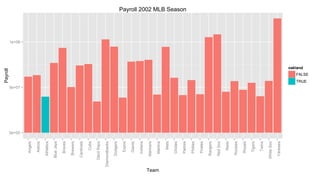
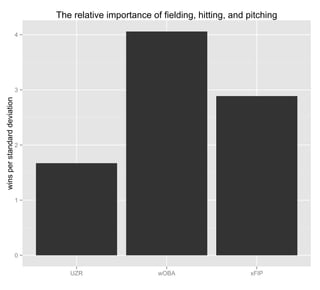
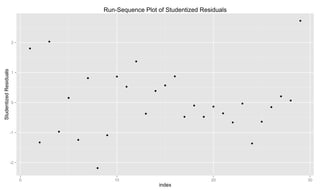


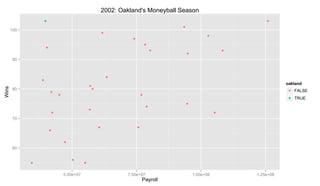


This document contains multiple figures and plots related to baseball statistics and analytics: - A lag plot of studentized residuals from a linear regression model - Normal QQ and histogram plots of studentized residuals - Scatter plots of on-base percentage and salary, team payroll and wins, and player stats like UZR and wOBA vs. salary - A bar plot of the relative importance of different stats like UZR, wOBA, and xFIP on team wins - Time series plots of studentized residuals and run sequences - Plots related to the 2002 Oakland A's "Moneyball" season and the fungibility of MLB players