Download to read offline
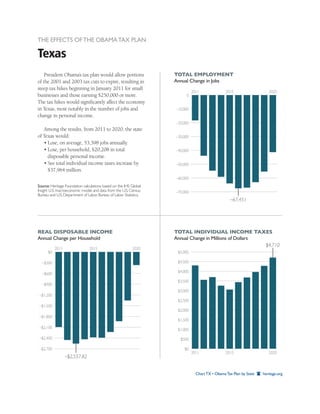
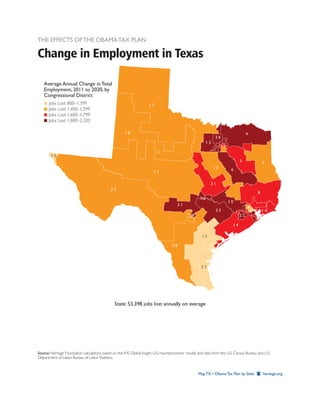

President Obama's tax plan would allow parts of the 2001 and 2003 tax cuts to expire, leading to significant tax increases starting January 2011, which are projected to result in a loss of approximately 53,398 jobs annually in Texas from 2011 to 2020. Additionally, households in Texas would see a drop in disposable personal income by about $20,208, alongside a rise in individual income taxes totaling $37,964 million. These findings are based on calculations from the Heritage Foundation using data from the U.S. Census Bureau and the Department of Labor.


