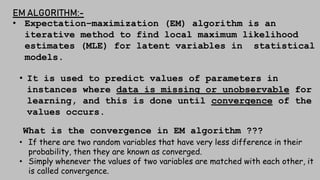
Agenda
• Why there is need for EM algorithm?
• What is EM Algorithm?
• Application of EM algorithm
• Advantages and Diadvantages
• Conclusion
Lets start this with very basic question:
 I tell u three data points [1,2,x] are the draws from
normal distribution N(1,1).
Whats the best guess for x ???
Obiviously best guess for x will be the mean ie 1.
 if tell u three data points [0,1,2] are the draws
from normal distribution N(µ,1).
Whats the best guess for µ ???
Again best guess for µ will be the average ie 1.
 Why there is need for EM algo
 Now if i give u three data points [1,2,x] are the
draws from normal distribution N(µ,1).
Whats the best guess for x and µ ???
In this case we dont know the parameter that generate the
data and also don’t know the data point.
Here We don’t have two pieces of information
simultaneously.
I need one to find another . This gave us the spirit of EM Algorithm
Expectation–maximization (EM) algorithm is an iterative method
to find local maximum likelihood estimates (MLE) for latent
variables in statistical models.It is also referred to as the
latent variable model.
Latent variables
 Variables that you can’t measure ( inferred from observed)
 Unobserved variable / Hidden variables
example:- Regression model
 What is EM Algorithm
Likelihood
• Model which is most likely to have produced our data.
• Measure the goodness of the distribution for a given sample data
Lets understand likelihood with an simple example
70 kgs 85 kgs
55 kgs
µ = 70 kgs
σ = 2.5
0.12
Mathematically we say... L(µ = 70 kgs and σ = 2.5 | person weight is 73 kgs) = 0.12
73 kgs
µ = 73 kgs
σ = 2.5
0.21
70
Now Mathematically likelihood will be..
Distribution 2 :-
Likelihood for this data to
belong to distribution 2 is
HIGH
L(µ = 73 kgs and σ = 2.5 | person weight is 73 kgs) = 0.21
Earlier... L(µ = 70 kgs and σ = 2.5 | person weight is 73 kgs) = 0.12
SAME
CHANGE
Now the question comes that wheater Probablity and likelihood
are same thing or not ????
In general, The answer is YES but In Statistics Likelihood and probability both are
VERY DIFFERENT
HOW ??
PROBABLITY measure chances of event occuring and graphically the area under the fixed
distribution
Mathematically ... P(data | distribution)
LIKELIHOOD measure the goodness of the distribution of given sample data and graphically its
the Y-axis value for the fixed data point and distributions that can be moved
Mathematically ... L(distribution | data)
L(µ = 73 kgs and σ = 2.5 | person weight is 73 kgs) = 0.21
L(µ = 70 kgs and σ = 2.5 | person weight is 73 kgs) = 0.12
How to choose the perfect/good parameter for the given data ???
For that we need MAXIMUM LIKELIHOOD ESTIMATION (MLE)
MAXIMUM LIKELIHOOD ESTIMATES(MLE)
• Method of determining the parameters (mean, standard deviation, etc) of normally
distributed sample data.
• Method of finding the best fitting Distribution over the random sample data.And
it is done my maximizing the likelihood function
sample data
LIKELIHOOD FUNCTION FOR NORMAL DISTRIBUTION
In Summary the mean of the data is the maximum
likelihood estimate for where the center of the
normal distribution should go.
EM ALGORITHM:-
• Expectation–maximization (EM) algorithm is an
iterative method to find local maximum likelihood
estimates (MLE) for latent variables in statistical
models.
• It is used to predict values of parameters in
instances where data is missing or unobservable for
learning, and this is done until convergence of the
values occurs.
What is the convergence in EM algorithm ???
• If there are two random variables that have very less difference in their
probability, then they are known as converged.
• Simply whenever the values of two variables are matched with each other, it
is called convergence.
START
E STEP
M STEP
INITIAL
VALUES
CONVERGED?? STOP
YES
NO
WORKING
Lets talk about E step and M step.
Expectation step (E - step):
• This involves the estimation/guessing of all missing values in
the dataset.
• After E step there should not be any missing value remaining
in the dataset.
Maximization step (M - step):
• This step involves the use of estimated data in the E-step
and updating the parameters.
Repeat E-step and M-step until the convergence of the values occurs.
Now lets ge t the question we have discussed earlier
Given three data points [1,2,x] are the draws from normal
distribution N(µ,1).
Whats the best guess for x and µ ???
Using the EM algorithm
Guess x = 0 µ = 1
x = 1
x = 4/3 µ = 13/9
µ = 4/3
.
.
.
.
.
.
Converge when
µ =
𝟏 + 𝟐 + 𝒙
𝟑
= 𝑥 µ∗ = 𝑥∗ = 1.5
Converged
values
current estimate
µ
x
Application of EM algorithm
The primary aim of the EM algorithm is to estimate the
missing data in the latent variables through observed data
in datasets.
• The EM algorithm is applicable in data clustering in machine learning.
• It is used to estimate the value of the parameter in mixed models such as
the Gaussian Mixture Model.
• It can be used for discovering the values of latent variables
• It can be used as the basis of unsupervised learning of clusters
• It is often used in computer vision and NLP (Natural language processing
PROS
• It is very easy to implement the first two basic steps of the EM algorithm in
various machine learning problems, which are E-step and M- step.
• It is mostly guaranteed that likelihood will enhance after each iteration.
• It often generates a solution for the M-step in the closed form.
CONS
• It has slow convergence.
• It makes convergence to the local optima only
CONCLUSION
• In real-world applications of machine learning, the expectation-maximization (EM)
algorithm plays a significant role in determining the local maximum likelihood
estimates (MLE) for unobservable variables in statistical models.
• It is often used for the latent variables, i.e., to estimate the latent variables through
observed data in datasets. It is generally completed in two important steps, i.e., the
expectation step (E-step) and the Maximization step (M-Step), where E-step is used
to estimate the missing data in datasets, and M-step is used to update the
parameters after the complete data is generated in E-step.
• Further, the importance of the EM algorithm can be seen in various applications
such as data clustering, natural language processing (NLP), computer vision,
image reconstruction, structural engineering, etc.
THANK YOU

ML PRESENTATION (1).pptx

  • 2.
    Agenda • Why thereis need for EM algorithm? • What is EM Algorithm? • Application of EM algorithm • Advantages and Diadvantages • Conclusion
  • 3.
    Lets start thiswith very basic question:  I tell u three data points [1,2,x] are the draws from normal distribution N(1,1). Whats the best guess for x ??? Obiviously best guess for x will be the mean ie 1.  if tell u three data points [0,1,2] are the draws from normal distribution N(µ,1). Whats the best guess for µ ??? Again best guess for µ will be the average ie 1.  Why there is need for EM algo
  • 4.
     Now ifi give u three data points [1,2,x] are the draws from normal distribution N(µ,1). Whats the best guess for x and µ ??? In this case we dont know the parameter that generate the data and also don’t know the data point. Here We don’t have two pieces of information simultaneously. I need one to find another . This gave us the spirit of EM Algorithm
  • 5.
    Expectation–maximization (EM) algorithmis an iterative method to find local maximum likelihood estimates (MLE) for latent variables in statistical models.It is also referred to as the latent variable model. Latent variables  Variables that you can’t measure ( inferred from observed)  Unobserved variable / Hidden variables example:- Regression model  What is EM Algorithm
  • 6.
    Likelihood • Model whichis most likely to have produced our data. • Measure the goodness of the distribution for a given sample data Lets understand likelihood with an simple example 70 kgs 85 kgs 55 kgs µ = 70 kgs σ = 2.5 0.12 Mathematically we say... L(µ = 70 kgs and σ = 2.5 | person weight is 73 kgs) = 0.12 73 kgs
  • 7.
    µ = 73kgs σ = 2.5 0.21 70 Now Mathematically likelihood will be.. Distribution 2 :- Likelihood for this data to belong to distribution 2 is HIGH L(µ = 73 kgs and σ = 2.5 | person weight is 73 kgs) = 0.21 Earlier... L(µ = 70 kgs and σ = 2.5 | person weight is 73 kgs) = 0.12 SAME CHANGE
  • 8.
    Now the questioncomes that wheater Probablity and likelihood are same thing or not ???? In general, The answer is YES but In Statistics Likelihood and probability both are VERY DIFFERENT HOW ??
  • 9.
    PROBABLITY measure chancesof event occuring and graphically the area under the fixed distribution Mathematically ... P(data | distribution) LIKELIHOOD measure the goodness of the distribution of given sample data and graphically its the Y-axis value for the fixed data point and distributions that can be moved Mathematically ... L(distribution | data) L(µ = 73 kgs and σ = 2.5 | person weight is 73 kgs) = 0.21 L(µ = 70 kgs and σ = 2.5 | person weight is 73 kgs) = 0.12 How to choose the perfect/good parameter for the given data ??? For that we need MAXIMUM LIKELIHOOD ESTIMATION (MLE)
  • 10.
    MAXIMUM LIKELIHOOD ESTIMATES(MLE) •Method of determining the parameters (mean, standard deviation, etc) of normally distributed sample data. • Method of finding the best fitting Distribution over the random sample data.And it is done my maximizing the likelihood function sample data
  • 11.
    LIKELIHOOD FUNCTION FORNORMAL DISTRIBUTION
  • 12.
    In Summary themean of the data is the maximum likelihood estimate for where the center of the normal distribution should go.
  • 13.
    EM ALGORITHM:- • Expectation–maximization(EM) algorithm is an iterative method to find local maximum likelihood estimates (MLE) for latent variables in statistical models. • It is used to predict values of parameters in instances where data is missing or unobservable for learning, and this is done until convergence of the values occurs. What is the convergence in EM algorithm ??? • If there are two random variables that have very less difference in their probability, then they are known as converged. • Simply whenever the values of two variables are matched with each other, it is called convergence.
  • 14.
  • 15.
    Lets talk aboutE step and M step. Expectation step (E - step): • This involves the estimation/guessing of all missing values in the dataset. • After E step there should not be any missing value remaining in the dataset. Maximization step (M - step): • This step involves the use of estimated data in the E-step and updating the parameters. Repeat E-step and M-step until the convergence of the values occurs.
  • 16.
    Now lets get the question we have discussed earlier Given three data points [1,2,x] are the draws from normal distribution N(µ,1). Whats the best guess for x and µ ??? Using the EM algorithm Guess x = 0 µ = 1 x = 1 x = 4/3 µ = 13/9 µ = 4/3 . . . . . .
  • 17.
    Converge when µ = 𝟏+ 𝟐 + 𝒙 𝟑 = 𝑥 µ∗ = 𝑥∗ = 1.5 Converged values
  • 18.
  • 19.
    Application of EMalgorithm The primary aim of the EM algorithm is to estimate the missing data in the latent variables through observed data in datasets. • The EM algorithm is applicable in data clustering in machine learning. • It is used to estimate the value of the parameter in mixed models such as the Gaussian Mixture Model. • It can be used for discovering the values of latent variables • It can be used as the basis of unsupervised learning of clusters • It is often used in computer vision and NLP (Natural language processing
  • 20.
    PROS • It isvery easy to implement the first two basic steps of the EM algorithm in various machine learning problems, which are E-step and M- step. • It is mostly guaranteed that likelihood will enhance after each iteration. • It often generates a solution for the M-step in the closed form. CONS • It has slow convergence. • It makes convergence to the local optima only
  • 21.
    CONCLUSION • In real-worldapplications of machine learning, the expectation-maximization (EM) algorithm plays a significant role in determining the local maximum likelihood estimates (MLE) for unobservable variables in statistical models. • It is often used for the latent variables, i.e., to estimate the latent variables through observed data in datasets. It is generally completed in two important steps, i.e., the expectation step (E-step) and the Maximization step (M-Step), where E-step is used to estimate the missing data in datasets, and M-step is used to update the parameters after the complete data is generated in E-step. • Further, the importance of the EM algorithm can be seen in various applications such as data clustering, natural language processing (NLP), computer vision, image reconstruction, structural engineering, etc.
  • 22.