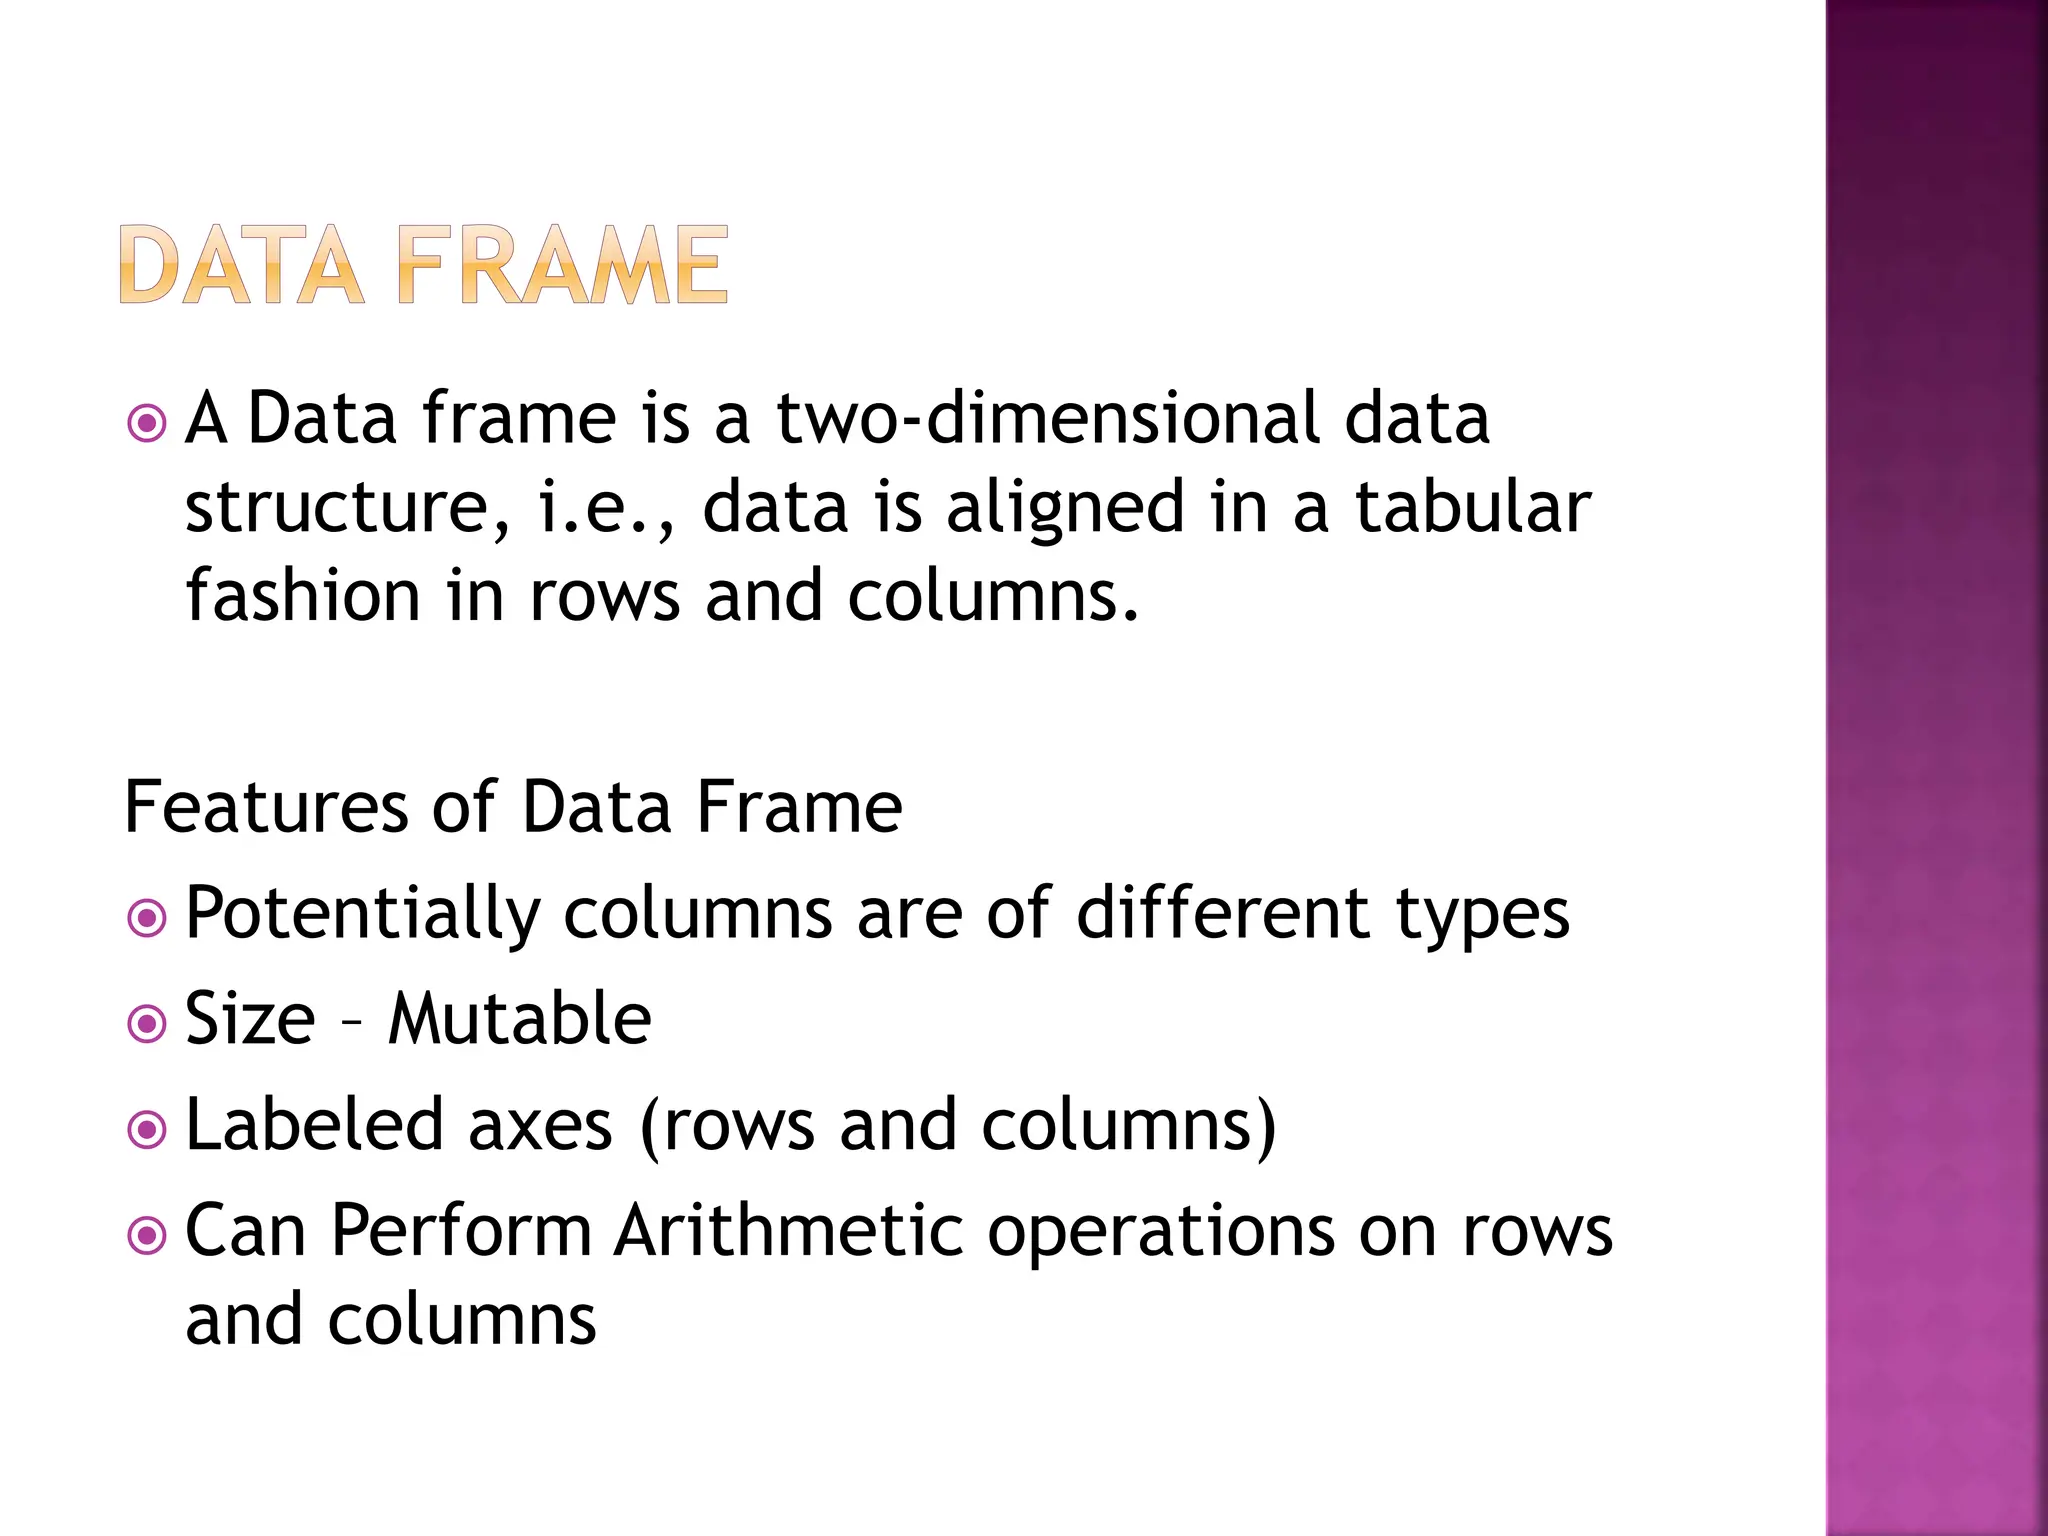
The document discusses various data manipulation techniques in pandas such as creating, filtering, joining and merging DataFrames. Some key points:
- Pandas DataFrames can be created from lists, dictionaries or other DataFrames and allow storing and manipulating tabular data.
- Common operations include filtering rows based on conditions, aggregating using functions like mean(), sorting values, and joining/merging DataFrames on indexes.
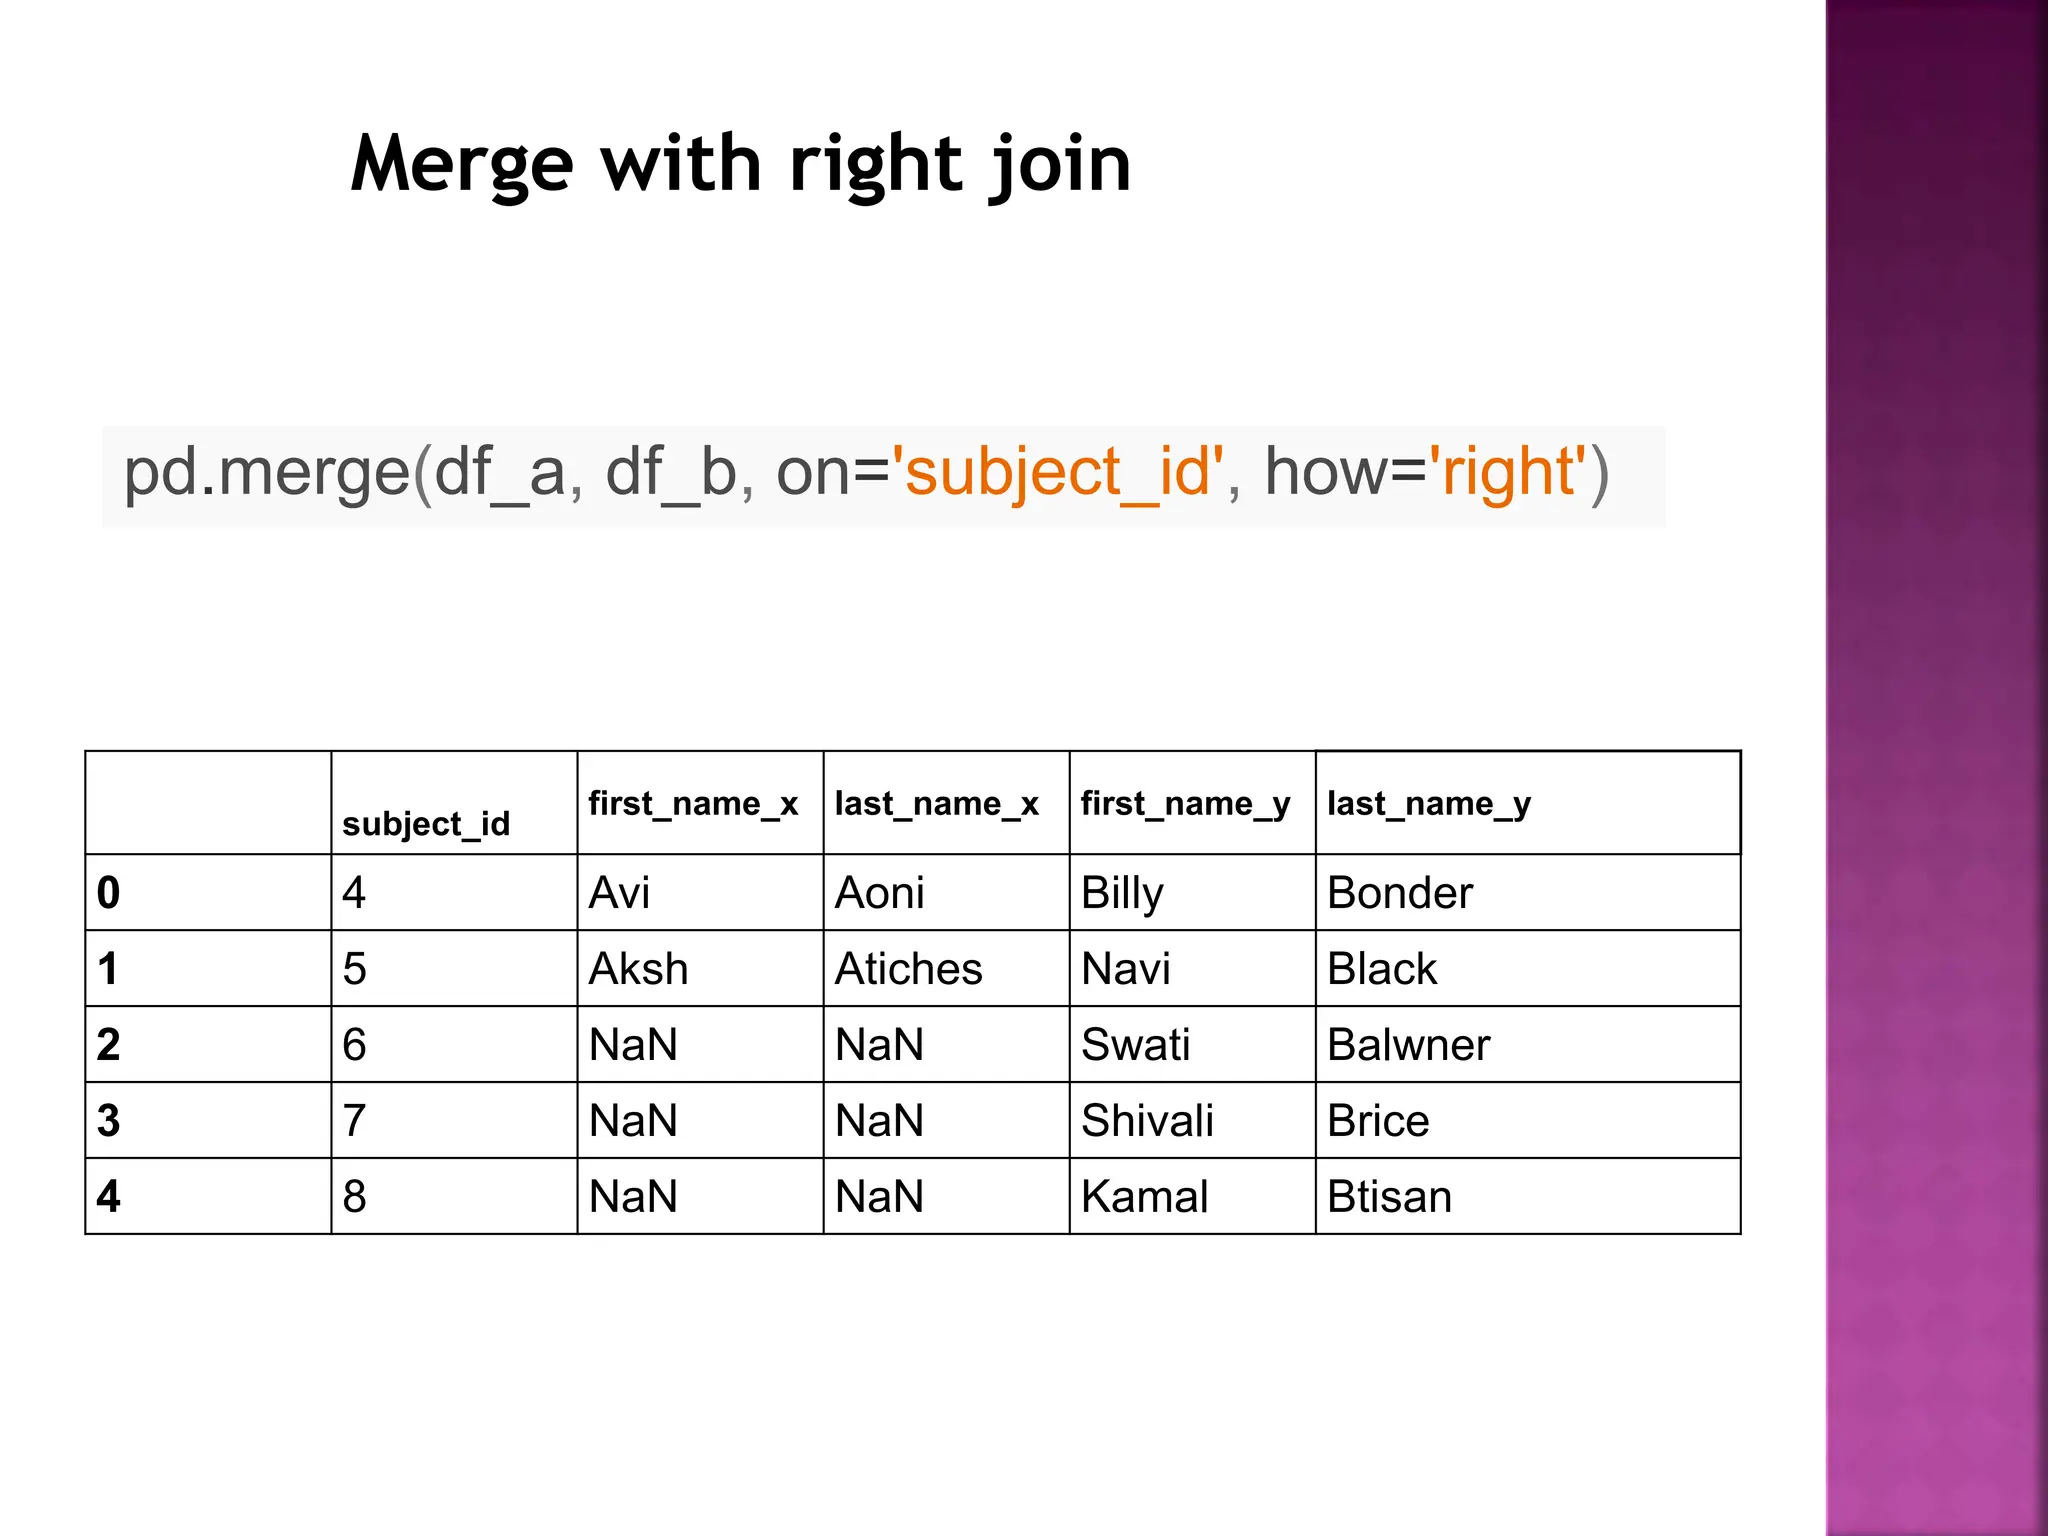
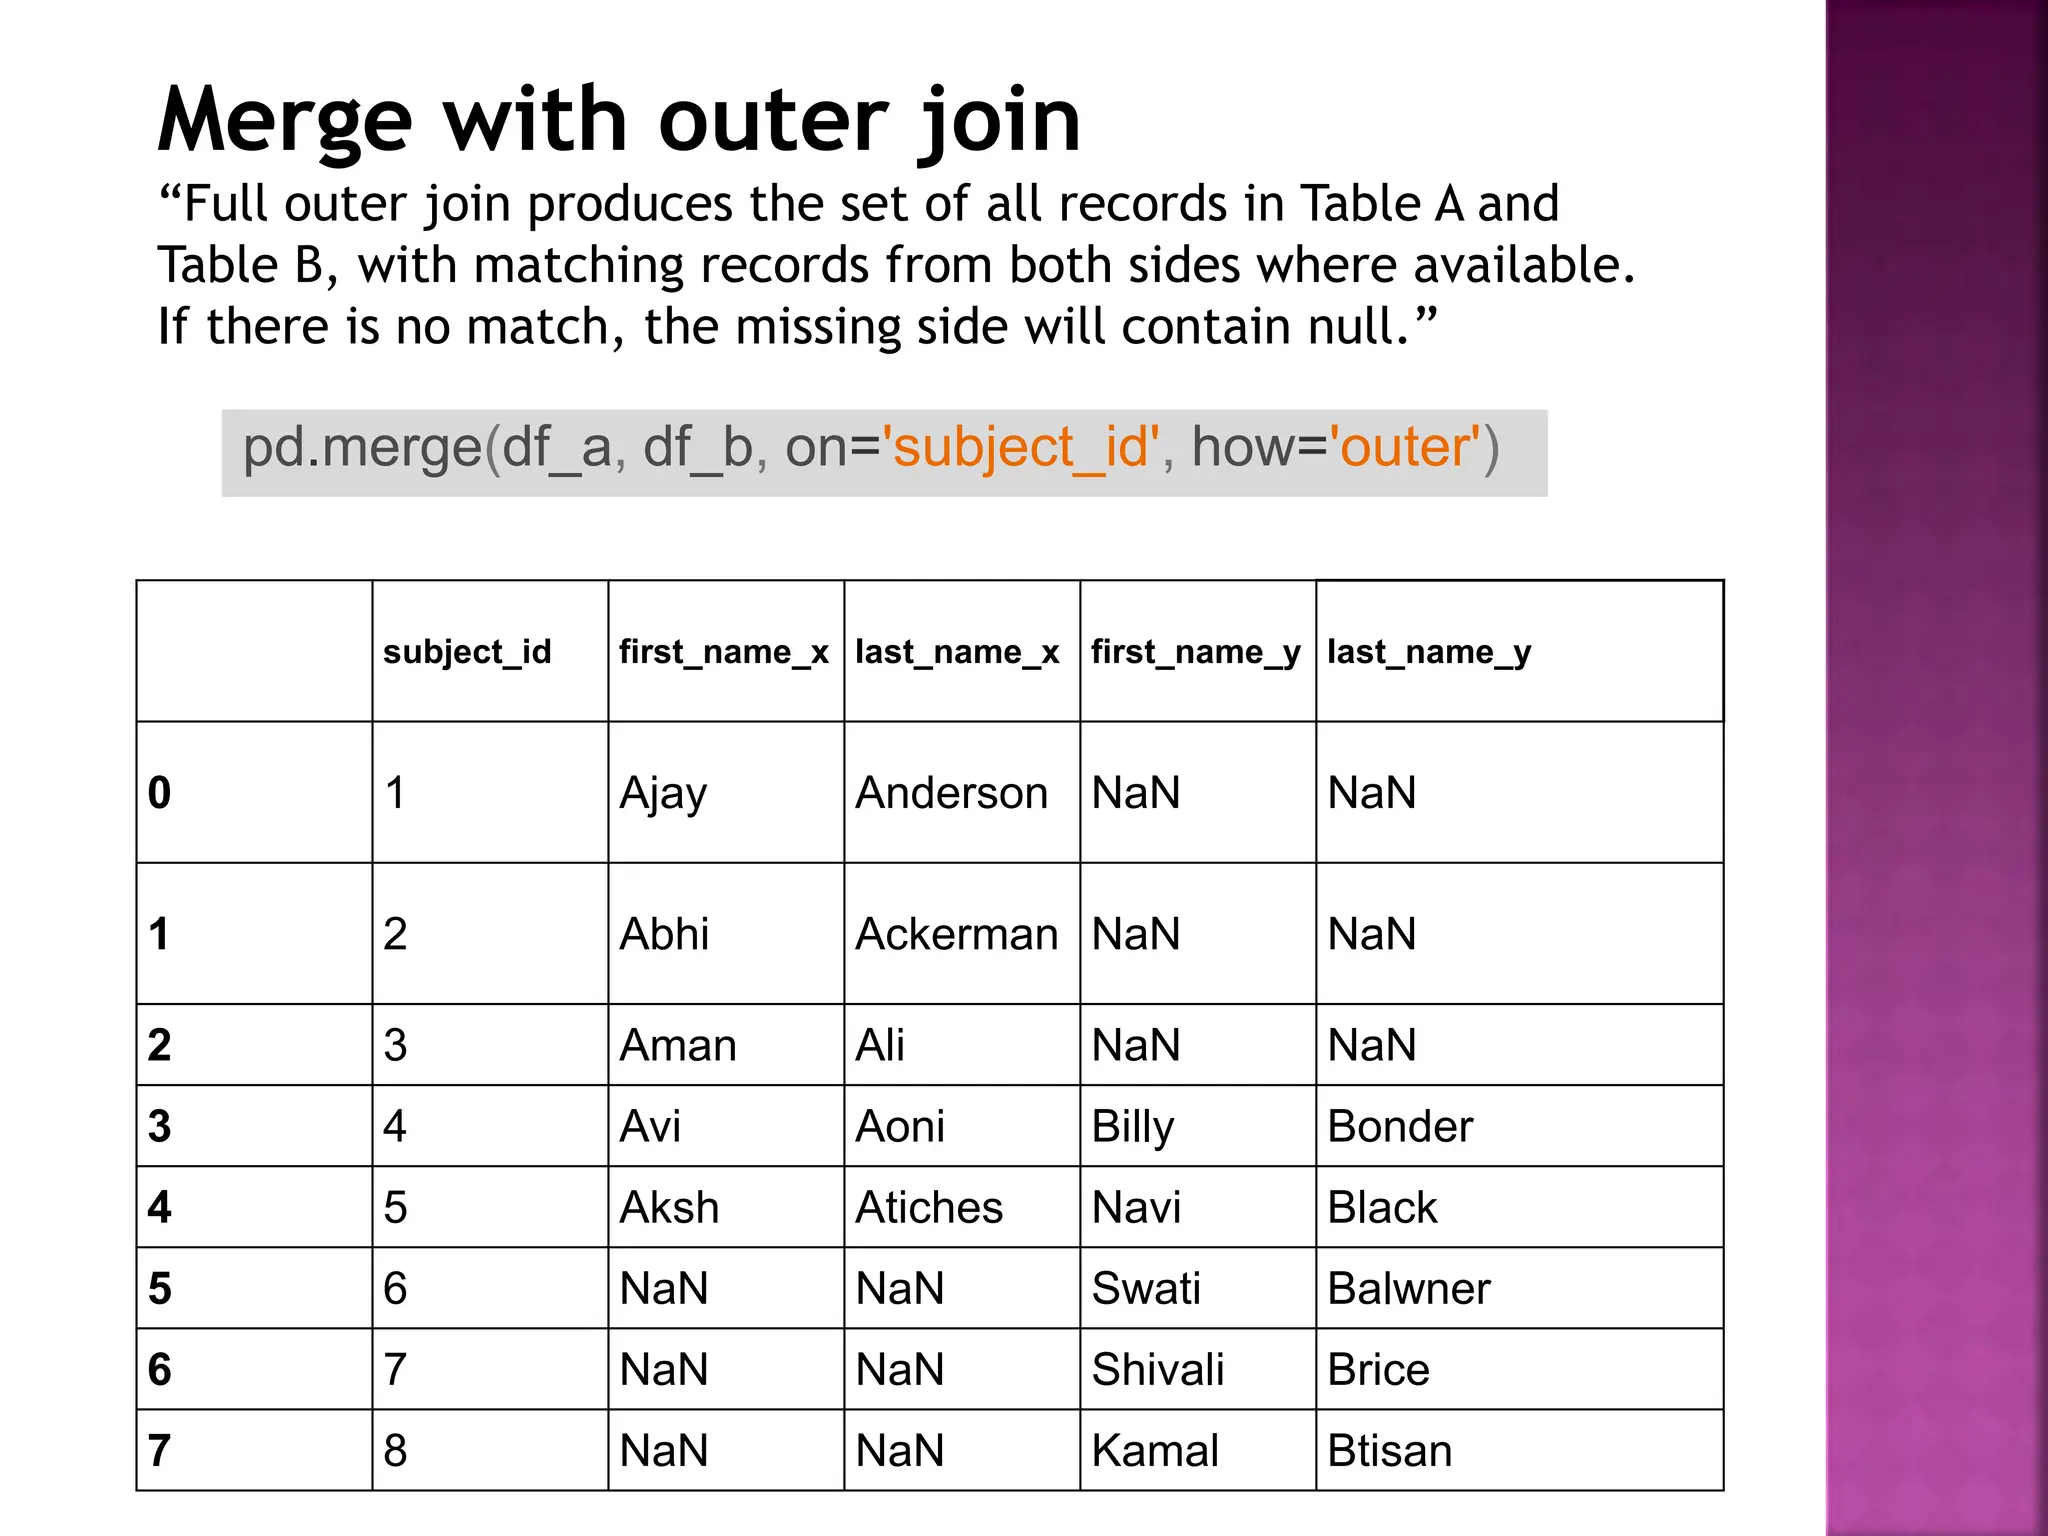
- DataFrames support different types of joins like inner, outer, left and right joins to combine data from multiple tables.

![For Python programming language the most
popular library for working with 1d/2d data sets
is Pandas.
For 1D data such as a sequence of
numbers pandas.Series object is very
appropriate.
Output:
For 2D data such object is
called pandas.DataFrame.
3D data
#list
myList = ["The", "earth", "revolves", "around", "sun"]
print(myList) #printing list
['The', 'earth', 'revolves', 'around', 'sun']](https://image.slidesharecdn.com/pandas-240318143011-dda71d6f/75/Presentation-on-Pandas-in-_-detail-pptx-2-2048.jpg)
![ A pandas DataFrame can be created using the
following constructor −
pandas.DataFrame( data, index, columns, dtype, copy)
•Create an Empty DataFrame
A basic DataFrame, which can be created is an Empty Dataframe.
Example:
#import the pandas library and aliasing as pd
import pandas as pd
df = pd.DataFrame()
print df
Its output is as follows −
Empty DataFrame Columns: [] Index: []](https://image.slidesharecdn.com/pandas-240318143011-dda71d6f/75/Presentation-on-Pandas-in-_-detail-pptx-5-2048.jpg)
![Its Output is as follows:
import pandas as pd
data = [['Aman',10],[‘Ajay',12],[‘Abhi',13]]
df = pd.DataFrame(data,columns=['Name','Age'],dtype=float)
print df
Name Age
0 Aman 10.0
1 Ajay 12.0
2 Abhi 13.0](https://image.slidesharecdn.com/pandas-240318143011-dda71d6f/75/Presentation-on-Pandas-in-_-detail-pptx-6-2048.jpg)
![Output
import pandas as pd
names = ['Bob','Jessica','Mary','John','Mel']
births = [968, 155, 77, 578, 973]
BabyDataSet = list(zip(names,births))
print(BabyDataSet)
df = pd.DataFrame(data = BabyDataSet, columns=['Names', 'Births'])
print(df)
df.to_csv('demo.csv')
[('Bob', 968), ('Jessica', 155), ('Mary', 77), ('John', 578), ('Mel', 973)]
Names Births
0 Bob 968
1Jessica 155
2 Mary 77
3 John 578
4 Mel 973](https://image.slidesharecdn.com/pandas-240318143011-dda71d6f/75/Presentation-on-Pandas-in-_-detail-pptx-7-2048.jpg)
![ Output
import pandas as pd
d = {'one' : pd.Series([1, 2, 3], index=['a', 'b', 'c']), 'two' : pd.Series([1, 2, 3, 4], index=['a', 'b', 'c', 'd'])}
df = pd.DataFrame(d)
# Adding a new column to an existing DataFrame object with column label by passing new series
print ("Adding a new column by passing as Series:")
df['three']=pd.Series([10,20,30],index=['a','b','c'])
print df
print ("Adding a new column using the existing columns in DataFrame:")
df['four']=df['one']+df['three']
print df
Adding a new column by passing as Series:
one two three
a 1.0 1 10.0
b 2.0 2 20.0
c 3.0 3 30.0
d NaN 4 NaN
Adding a new column using the existing columns in DataFrame:
one two three four
a 1.0 1 10.0 11.0
b 2.0 2 20.0 22.0
c 3.0 3 30.0 33.0
d NaN 4 NaN](https://image.slidesharecdn.com/pandas-240318143011-dda71d6f/75/Presentation-on-Pandas-in-_-detail-pptx-8-2048.jpg)
![# importing pandas as pd
import pandas as pd
# Creating the dataframe
df = pd.DataFrame({"A":[12, 4, 5, None, 1],
"B":[7, 2, 54, 3, None],
"C":[20, 16, 11, 3, 8],
"D":[14, 3, None, 2, 6]})
# skip the Na values while finding the maximum
df.max(axis = 1)
Output:
Max() is used to find the maximum value .
Similarly , to find the minimum value we use min() in place of max()](https://image.slidesharecdn.com/pandas-240318143011-dda71d6f/75/Presentation-on-Pandas-in-_-detail-pptx-9-2048.jpg)
![Mean Function in Python pandas
(Dataframe, Row and column wise mean)
mean() – Mean Function in python pandas is used to calculate the
arithmetic mean of a given set of numbers, mean of a data frame
,mean of column and mean of rows .
import pandas as pd
import numpy as np
#Create a DataFrame
d = { 'Name':['Alisa','Bobby','Cathrine','Madonna','Rocky',
'Sebastian','Jaqluine', 'Rahul','David','Andrew','Ajay','Teresa'],
'Score1':[62,47,55,74,31,77,85,63,42,32,71,57],
'Score2':[89,87,67,55,47,72,76,79,44,92,99,69]}
df = pd.DataFrame(d)
df
# mean of the dataframe
df.mean()
Output:
Score1 58.0
Score2 73.0
dtype: float64](https://image.slidesharecdn.com/pandas-240318143011-dda71d6f/75/Presentation-on-Pandas-in-_-detail-pptx-10-2048.jpg)
![from pandas import DataFrame
import pandas as pd
d = {'one':[2,3,1,4,5], 'two':[5,4,3,2,1], 'letter':['a','a','b','b','c']}
df = DataFrame(d)
test = df.sort_values(['one'], ascending=[False])
the output is:
letter one two
2 b 1 3
0 a 2 5
1 a 3 4
3 b 4 2
4 c 5 1
Sorting :
If ascending=False , data will be sorted in descending order.
Otherwise, by default the data will be sorted in ascending
order.](https://image.slidesharecdn.com/pandas-240318143011-dda71d6f/75/Presentation-on-Pandas-in-_-detail-pptx-11-2048.jpg)
![Groupby
name age
employme
nt_status state
Anush 23emp pb
Ankush 32unemp pb
Alisha 21emp pb
Rohit 34emp hp
Komal 26unemp hr
Karthik 29emp hr
import pandas as pd
import numpy as np
df1 =
pd.read_csv('datasets/stackdata
setexample.csv')
print(df1)
#print
(df1.groupby(["state"])[['name']].
count())
j=df1['state'].value_counts()
print(j)
name age employment_status state
0 Anush 23 emp pb
1 Ankush 32 unemp pb
2 Alisha 21 emp pb
3 Rohit 34 emp hp
4 Komal 26 unemp hr
5 Karthik 29 emp hr
name
state
hp 1
hr 2
pb 3
pb 3
Hr 2
hp 1
Name: state, dtype: int64
Output:](https://image.slidesharecdn.com/pandas-240318143011-dda71d6f/75/Presentation-on-Pandas-in-_-detail-pptx-12-2048.jpg)
![Drop Duplicate and missing value
A B C
foo 0A
foo 1A
foo 1B
bar 1A
foo 0A
Aman CSE Python
Anu IT
Anuradha CSE PHP
Nisha BigData
Pankaj CSE
Ankit Java
Rohit IT Android
Anu IT
Duplicate data
Missing data
import pandas as pd
df = pd.read_csv('datasetsdropduplicatesexample.csv')
print(df)
ee=df.drop_duplicates()
#print(ee) #check whole row for duplicacy
e=df.drop_duplicates(subset=['A', 'C'])
print(e) #drop rows which match on columns A and C
e.to_csv("aaa.csv")
import pandas as pd
#if we want to write 0 in those columns which have nan
#df = pd.read_csv('datasets/dropnaexample.csv')
df = pd.read_csv('datasets/dropnaexample.csv', header=None)
print(df)
df_drop_missing = df.dropna()
#print(df_drop_missing)
df_fill = df.fillna(1) #you can fill any number
print(df_fill)](https://image.slidesharecdn.com/pandas-240318143011-dda71d6f/75/Presentation-on-Pandas-in-_-detail-pptx-13-2048.jpg)
![Filters
name year salary
0Aman 2017 40000
1Raman 2017 24000
2Anita 2017 31000
3Kajal 2017 20000
4Arun 2017 30000
5Aman 2017 25000
import pandas as pd
import numpy as np
df = pd.read_csv('datasets/filtersexample.csv')
#print(df)
filtered = df.query('salary>30000') #salary greater than 30,000
#print(filtered)
df_filtered = df[(df.salary >= 30000) & (df.year == 2017)]
#print(df_filtered)
#print(df.salary.unique()) # list of unique items
#print(df.name.nunique()) #give the count of unque values
Unnamed: 0 name year salary
0 0 Aman 2017 40000
1 1 Raman 2017 24000
2 2 Anita 2017 31000
3 3 Kajal 2017 20000
4 4 Arun 2017 30000
5 5 Aman 2017 25000
Unnamed: 0 name year salary
0 0 Aman 2017 40000
2 2 Anita 2017 31000
Unnamed: 0 name year salary
0 0 Aman 2017 40000
2 2 Anita 2017 31000
4 4 Arun 2017 30000
[40000 24000 31000 20000 30000 25000]
5
Output:](https://image.slidesharecdn.com/pandas-240318143011-dda71d6f/75/Presentation-on-Pandas-in-_-detail-pptx-14-2048.jpg)

![subject_id
first_nam
e
last_name
0 4 Billy Bonder
1 5 Navi Black
2 6 Swati Balwner
3 7 Shivali Brice
4 8 Kamal Btisan
df_new = pd.concat([df_a, df_b])
df_new
subject_id first_name
last_name
0 1 Ajay Anderson
1 2 Abhi Ackerman
2 3 Aman Ali
3 4 Avi Aoni
4 5 Aksh Atiches
0 4 Billy Bonder
1 5 Navi Black
2 6 Swati Balwner
3 7 Shivali Brice
4 8 Kamal Btisan
df_a df_b
df_new
subject_id first_name last_name
0 1 Ajay Anderson
1 2 Abhi Ackerman
2 3 Aman Ali
3 4 Avi Aoni
4 5 Aksh Atiches](https://image.slidesharecdn.com/pandas-240318143011-dda71d6f/75/Presentation-on-Pandas-in-_-detail-pptx-16-2048.jpg)
![pd.concat([df_a, df_b], axis=1)
subject_id first_name last_name subject_id first_name last_name
0 1 Ajay Anderson 4 Billy Bonder
1 2 Abhi Ackerman 5 Navi Black
2 3 Aman Ali 6 Swati Balwner
3 4 Avi Aoni 7 Shivali Brice
4 5 Aksh Atiches 8 Kamal Btisan](https://image.slidesharecdn.com/pandas-240318143011-dda71d6f/75/Presentation-on-Pandas-in-_-detail-pptx-17-2048.jpg)