1. 1
Mkoani District Food Security Profile
1.0 Background
Mkoani district lies in Southern part of Pemba covering an area of 207 km2 . It is bordered
by Chakechake district to the North and the Indian Ocean to the South, West and East.
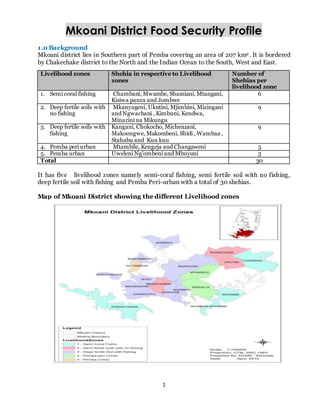
It has five livelihood zones namely semi-coral fishing, semi fertile soil with no fishing,
deep fertile soil with fishing and Pemba Peri-urban with a total of 30 shehias.
Map of Mkoani District showing the different Livelihood zones
Livelihood zones Shehia in respective to Livelihood
zones
Number of
Shehias per
livelihood zone
1. Semi coral fishing Chambani, Mwambe, Shamiani, Mtangani,
Kisiwa panza and Jombwe
6
2. Deep fertile soils with
no fishing
Mkanyageni, Ukutini, Mjimbini, Mizingani
and Ngwachani , Kimbuni, Kendwa,
Minazini na Mikungu
9
3. Deep fertile soils with
fishing
Kangani, Chokocho, Michenzani,
Makoongwe, Makombeni, Shidi , Wambaa ,
Stahabu and Kuu kuu
9
4. Pemba peri urban Mtambile, Kengeja and Changaweni 3
5. Pemba urban Uweleni Ng’ombeni and Mbuyuni 3
Total 30
2. 2
2.0: Demographic characteristics:
Although the estimated district
population size increased from
96,633 in 2004/05 to 116,129 in
2009/10, the proportion slightly
declined by 0.1 at 9.1 percent in
2009/10. The mean household
size also increased from 5.5 in
2005 to 5.7 in 2010 above the
national average of 5.5. There
has been a marked increase in
the percentage of female
headed households from 19.3
percent in 2004 to 17.5
percent in 2009/10. However,
the mean age dependency
ratio also slightly declined
from 1.21 to 1.14 in the same
period. Overall, the number of
household heads increased by
26.3% i.e. from 17,474 in
2004/05 to 22,074 by 2010.
Between 2004 and 2010, the
population density (number of
persons per Km2 increased by
20.4 percent i.e. from 467 to
561.
4.0 Socio-economic status
Agricultural labour force in
Mkoani district declined from
52.7% in 2004/05 to 48.6% in
2009/10. One in ten adult
persons in the district is
employed by Government while
only 2.7 percent of the
population is employed in the
private sector. About seven in
ten households are engaged in
Agriculture, livestock and
fishing in Mkoani district. In
2010, a total of 2 percent of the
households were not actively
employed due to either old-age
or underage, sickness and /or disability. Unemployment accounted for 2.6 in 2005.
Food security statistics , Mkoani district
Indicators 2004/05 2009/10
Demographic characteristics
Population size (2008 estimate) 96,633 116,129
% of Total Population 9.2 9.1
Population density 467 561
Population growth rate (%) X X
Households (#,%) 19,355(10.9)
Mean household size 5.5 5.7
%of child orphans (Lost >1parent) X 2.50
Average No. ofpersons per sleeping
room
X 2.3
Mean Age dependency ratio 1.21 1.14
% of Population <18 years orphaned 6.9 2.5
Mean proportion ofdependants 0.5 X
% of female-headed households(>15
years )
19.3 17 .5
# of female headed households 3,372 3,863
# of household heads 17,474 22,074
Human DevelopmentIndex X X
Socio-Economic status
(Employment) 2004/05 2009/10
Employment-Cash 31,939
% adults engaged in
Agric/livestock/fishing
52.7 48.6
% households engaged in
Agric/livestock/fishing
71.0
% of households engaged in Fishing 8.9
% of households employed by
Government
13.0
% of households self employed 8.4
% of Public sector (males & females)
employed 12.8 10.6
% of Private sector (males & females)
employed 2.7 2.7
% of unemployment rate 2.6
% of population (15-64) not active( old,
young, sick, disabled)
0.9
% of households not active( old, young,
sick, disabled)
2.0
3. 3
50 Household Assets &
Income Source and
Expenditure
By 2009/10, total Mean
Household Per Capita
Expenditure for 28 days
declined by 1.87 percent at
Tsh.35, 381. Similarly, total
Mean Household
Expenditure for 28 days
slowed down from Tsh.
35,577 to Tsh.30,836. In
2004/05, three in ten
households owned cattle
while one in ten households
kept goats in Mkoani
district.
6.0 Household income
Over the last five
years, the Agricultural
share of income also
slumped by 1 percent
at 29.3 percent in
2009/10. Total Mean
Annual Income also
declined by Tsh244,
991(20%) in between
2004/05-2009/10.
However, there was a
huge in increase in
the mean Per Capita
Annual / Monthly
Household Income
(TShs.) from 186,278
upto 326,506 though
still lower than the
national average of
483520(HBS,
2009/10.
7.0 Poverty and Inequality
Households Assets &Income Source
% households Owning cattle 31.6 X
% households Owning goats or sheep 11.8 X
% households owning chicken 80.9 X
% households Owning Land or Field 7 2.1 X
% Households owning fishing
equipment
9.3 X
% of households with a member with a
bank account
2.6 4.4
Households having present working
capital
X X
Average household Expenditures
Total Mean Household Per Capita
Expenditure per capita for 28 days
40,791 35,381
Total Median Household Per Capita
Expenditure (28 days)
35,577 30,836
Total Mean Household Expenditure for
28 days
225,577 201,655
Total Low Per Capita Expenditure for 28
days
24,407 22,045
Total High Per Capita Expenditure for
28 days
7 0,222 7 1,908
Household Income 2004/05 2009/10
Mean Annual Income Per Earner by
Male(Tsh)
1,806,485 1,447,703
Mean Annual Income Per Earner by
female(Tsh)
539,248 425,582
Total Mean Annual Income (Tsh)
1,205,775 960,784
% of Agricultural share of income 30.3 29.3
Mean Per Capita Annual / Monthly
Household Income (TShs.) 186,278 326,506
Poverty and Inequality
% Population below the Food Poverty line
(Head count ratio)
7 .26 21.46
% Population below the basic needs poverty
line (Head count ratio)
42.08 52.27
Food poverty headcount gap 0.93 4.48
Basic needs poverty gap 9.38 16.45
Gini Coefficient 0.23 0.27
Generalized Entropy (GE)(2) of dist. Per
Capita Expenditure
0.11 0.13
Total number of Food Poor Persons 7 ,015 27,001
Total number of Basic Needs Persons 40,667 65,761
% of Basic Needs Poor persons 7 .8 11.6
% of Food Poor persons 5.0 16.3
% of Total consumption by the poorest (20%) 11.0 9.2
% of Total Consumption by the riches (20%) 35.0
4. 4
Both the number and proportion of food poor persons in Mkoani district tripled between
2004 and 2010. The same trend was observed for the population below the Food Poverty
line. The number of persons below the basic needs poverty line increased from four in
2004/05 tofive in 2009/10.
Similarly, the total number of Basic Needs Persons increased from 40,667 (7.8%) to
65,761(11.6%) during the same period. According to the HBS2009/10, both the food
poverty (headcount) and basics needs gaps sharply rose from 0.93 and 9.38 in 2005 to
4.48 and 16.45 in 2010 respectively. During the same period, Agricultural share of total
income slightly declined by one percent point at 29.3 percent in 2009/10.
Mean Per Capita Annual / Monthly Household Income (TShs.) sharply rose by 75 percent
from Tsh.186,278 to 326,506 between the period 2004 -2010 but mainly among the
middle income class. The gap between the rich and the poor (income inequality) has
widened as reflected by the escalation of the Gini Coefficient from 0.23 to 0.27 percent and
the fall in Generalized Entropy. This fact is attested y the decline in the total consumption
by the bottom poorest (20%) from 11.0 to 9.2 percent in the same period. Programs and
policies promoting even distribution of both income and consumption across the
population are needed.
8.0 Household food
consumption patterns
Food intake and nutrition
Rice, cassava and animal
products (mainly fish) heavily
constitute the major daily diets.
On average, fish is consumed 5
days a week whereas cassava
and rice are consumed 3 and 4
times per week respectively. The
consumption of other body
building foods is very low, for
instance, Meat is consumed
once a month while eggs are
eaten only once in three months
per household. Sweet potatoes,
Vegetables and pulses are least
preferred since they are
consumed only nearly week.
Low intake of certain foods such
as eggs, beans and vegetables is
Food Security
Food consumption patterns
Food demand(MT)
Food Aid (MT)
% of Households consuming 3+ meals per day
40.2 67.3
# of Households consuming 3+ meals per day
7,015
Fisher Index (based on food
prices)/Rural/Urban
1.01/0.91 1.02/0.93
Mean Household Expenditure on Food &
Non-Alcoholic beverages (28 days) Low
Expend. Level
60.5 63.1
% of household consumption expenditure on
food 58.0 58.3
% distribution of Mean per capita Expend (28
days) on F&NAB 40.2 67.3
% households with fewer meals (beyond 7
days)
X
6.9
Food crop production
Number of Agricultural households 12,472(12.9) 16,199 (12.3)
% of households Selling crops 7,222(11.8) X
% of women owning land for Agriculture X 13
%households Owning Land for Agriculture &
Grazing (1-2.9 acres) 49.9 67.8
Total# of Individuals Owning land 12,743 X
5. 5
partly caused by the limited availability and poor consumer preferences. Although, daily
diets vary somewhat according to livelihood zone, a relatively higher proportion of
households do not meet their minimum food requirements. Majority of the households
(98.3%) depend on both firewood and charcoal to prepare their food.
Between 2005 and 2010, the proportion of households consuming three and more meals
per day evidently grew by 27.1 percent ending at 67.3 percent. About 7 percent were
having fewer meals beyond 7 days by 2009/10.
As already noted, Mkoani districts falls in the region of Pemba South. In Pemba South, the
stunting (Height/Age) rose from 27.4% in 2005 to 31.3% in 2010, wasting (Weight/Height)
equally almost doubled from 4.5% in 2005 to 8.4% in 2010. However, underweight
(Weight/Age) slightly declined from 20.2% to
18.6% in the same period. Vitamin A
deficiency (VAD) in children 6-59 months was
37.8% by 2010. Targeted nutritional
improvement actions are required in affected
shehias with severe cases of malnutrition.
With regard to health and sanitation, 85
percent of the households have adequate to
safe drinking water. Households spend on
average 7 minutes on fetching water and an
estimated 117 litres of water are consumed
peer household on a daily basis. The number of
households using toilet facilities doubled from
three in 2004/05HBS to six in 2009/10HBS. It
is worth to note that the proportion of
individuals reporting illness in past month
significantly reduced from 25.5% to 9% and the mean household expenditure on Health
subsequently reduced from 2.2% to 1.8% in the same period. A decline in the disease
burden increased the labour productivity, income earning capacity and reduced health care
costs. This may have positively contributed to the rise in the proportion of households
saving informally from 2.8% to 10.9% and formally from 0.7 % to 2.6 between 2004/05
and 2009/10.
Household food access
Inadequate food access in the period between November and January was reported. While
households locally produce banana, cassava, vegetables and fruits, they heavily rely on
market purchases to access other major foods namely (rice, pulses, beef and milk). Despite
the low purchasing power, mean household expenditure on Food & Non-Alcoholic
beverages (28 days) increased from 60.5% to 63.1% in the last 5 years. The sharply rising
market prices as shown by the low urban Fisher Index of 0.93(based on food prices), do
expose low income households to high incidences of food insecurity and malnutrition in
the district.
Mean number of days of consuming
Specified food in proceeding week in 2009/10
Food Item Mkoani Zanzibar
Meat 0.3 0.6
Fish 4.8 4.5
Eggs 0.1 0.4
Milk 0.4 0.7
Beans/legume types 1.2 1.6
Fruits 1.7 1.9
Cassava 3.2 1.9
Rice 4 4.8
Sweet Potato 0.1 0.4
Vegetables 1.2 1.6
Oil/Oils types 1.3 2.2
6. 6
On average, households involved in saving or Bank Account increased by two at five in
2009/10. In the same way, the
proportion of household members
who took bank loans past year
increased from 0.9% to 4.1%.
9.0 Domestic Food
production
The main food crops grown in the
district include: Cassava, paddy,
bananas, maize, sweet potatoes,
yams, rice whereas the cash crops
are seaweed and cloves.
Crop farming households:
A 201% significant increase in the
proportion of households growing
maize was recorded and the
number of Cassava farming
households increased by 47
percent between 2003/04 and
2007/08. Similar positive changes
in the proportion of households
engaged in the cultivation of other
crops particularly Yams (38%),
Paddy (27%) and Bananas (18%)
were observed.
Crop production and area
planted:
The area planted (ha) of cassava
increased from 5,471 to 5,568
whereas the cassava production in
ha increased from 15,112 to 20,006
between 2003/04 and 2007/08.
However, the proportion of the
both area planted and production
of cassava relative to total coverage
faced a declining trend.
The increase in the area of banana planted from 2,306(17%) to 3,312(24%) was followed by
a significant increase in banana production in (tons) from 7814(18%) to 24,639(16%). In
the same way, Paddy rice also registered a slight increase in the area planted from
3,899(18%) to 5,055(19%) and a similar increase in the quantity harvested from 2,377
Water and sanitation 2004/05 2009/10
% of household within 1 km of drinking water 60.4 55.6
% households spending >1 hour to fetch water X 1
% of households using toilet facilities 34.2 57.1
Average household water consumption (litres) X 117
# of households having access to water 17,474 22,074
% of households within 1 km of drinking water X 84.8
Basic health and nutrition 2006 2007
Wasting less than 2 sd (%) X X
Stunting less than 2 sd (%) X X
Underweight for Age U5 (cases /100 children
weighed)
7.4 6.2
Underfive mortality(#) yr 2002 X X
Vitamin A deficiency among under five years X X
Children <1 year immunized (%) 49.7 in 2007 X
Life expectancy (year) X X
Child mortality rate/1000 live births 68 in 2002 X
Infant mortality rate/1000 live births 97 in 2002 X
Under-fiver mortality rate/1000 live births 158 in 2002 X
Mean household expenditure on Health (28
days)
% mean household expenditure on Health (28 days) 2.2 1.8
% of individuals reporting illness (past month) 25.5 9.0
% distribution of Mean per capita Expend. on
Health (28 days) 2.2 1.5
% mean household expenditure on Health (28 days) X X
Energy supply
% households using Solar 0.1 -
% households using Charcoal and firewood for
cooking 98.1 98.3
Daily mean(kgs) h/hold firewood consumed X 6
% of households with electricity connection for
lighting 6.2 13.4
% of households using charcoal for cooking 5 X
% of households using Firewood for cooking 93.3 X
Savings and Banking Services
% of Households involved in Saving or Bank
Account 2.6 4.4
% of household member who took bank loans past
year
0.90 4.10
% household Member in Formal Saving group
systems 0.7 2.6
% household Member in Informal saving group
system 2.8 10.9
% households reported having Business 15.0 25.0
7. 7
(23%) to 5,848(18%) in the same period. Production of Sweat potato, Yams and Maize
equally increased from 62(0.8%) to 112(0.7%), 44(2.2%) to 31(0.8%) and 65(2.1) and
182(3.4%) respectively. This is attributed to the increase in the area planted of the three
crops. The area planted (ha) of Sweet-potatoes and Maize doubled from 39(0.7%) to
81(1.0%) and 79(3.0%) to 159(3.9%) respectively. Similarly, the area planted of Yams (in
ha) more than doubled from 6(0.4%) in 2003/04 to 14 (0.6%) in 2007//08.
Table 9.1 : Mkoani district, Crop production district
Crop Number of
Households
Quantity Harvested
(tons)
District Yield
(tons/ha)
Actual Planted Area
(ha)
National
Yield
(Mt/ha)
2003
/4
2007/8 2003/4 2,007/8 2003/
4
2007
/8
2003/4 2007/8 200
34
2007
/8
Cassava 9 ,803 1 4 ,4 4 1 1 5 ,1 1 2
(2 2 .2 )
2 0,006(16
.5 )
2 .80 3 .6 5 ,471(16.1) 5,568(14.4
)
2 3.1
Sw eet potato
2 83
3 4 8 6 2 (0.8) 1 1 2 (0.7 ) 1 .6 0 1 .4 3 9 (0.7 ) 81 (1 .0) 1 .5 8 2 .1
Yams 3 9 5 4 4 4 (2 .2 ) 3 1 (0.8) 7 .3 3 2 .2 6 (0.4 ) 1 4 (0.6 ) 1 .3 1 .7
Paddy 10,356 1 3 ,1 7 4 2,377(22.9) 5,848(18.1
)
0.6 1 1 .2 3 ,899
(18.0)
5 ,055(19 ) 0.4 8 1.2
Maize 2 7 9 83 9 6 5 (2 .1 ) 1 82 (3 .4 ) 0.82 1 .1 7 9 (3 .0) 159 (3 .9 ) 1 .1 9 1.22
Banana 8,929 1 0,5 6 7 7 ,814 (17.8) 2 4,639(26
.1 )
3 .3 9 9 .2 2,306 (17.0) 3,312(23.6
)
3 .2 3
Seaweed 2 00 4 6 6 (8.4 ) 1 6 .6 4 2 8 (1 .1 ) 2 .1 4
Cloves 2 ,413 1,059 (28.5) 0.7 7 1,397 (29.2) 0.8
Sorghum 1 6 1 3 0(1 .8) 1 2 9 (1 .5 ) 0.5 2 0.9
Irish potatoes 0 0 0 0 72
Cocoa Yams 3 7 5 3 3 (4 .2 ) 0.8 4 1 (4 .9 ) 0.7 9 0.9
Source: 2002/03 and 2008/09 Agriculture Sample Censuses, OCGS, Zanzibar
Crop Yields:
In Mkoani district, Banana recorded the highest increase in yields from 3.39 to 9.2
tons/ha, followed by Cassava from 2.8 to 3.6 ton/ha, Paddy Rice from 0.61 to 1.2 ton/ha
and maize from 0.82 to 1.1 between the two Agricultural Censuses of 2003/04 and
2007/08.
Area of Land Utilized for Growing Crops and land sufficiency
Mkoani had less than 10% land utilization and the total planted area was 624ha (3%) in the
short-rainy season and 5,506 ha(14%) in the long-rainy season, 10,604ha (14%) under
permanent crops. The total crop growing households in the district was 16,146(12.4%) and
the total land for crop production per household was 1.03ha in 2007/08(Agricultural
Census 2008/09:18-20). More than half of the households (53%) reported land
insufficiency following the low average land available per household. Nearly all usable land
was utilised entirely.
Land Use Patterns:
By 2007/08, the area under permanent mono crops was (6,584ha, 17.1%) and permanent
mixed crops was (2,582 ha, 11.9%). A total of 5,815ha (15.2%) and 297(4.5%) were also
under Temporary mono crops and temporary/mixed crops respectively. In the same year,
8. 8
357ha (2.5%) were under permanent/annual mix, 11ha (5%) were under pasture, 294ha
(8.6%) under fallow and sadly, no land was planted under trees.
Irrigated Agriculture:
About 194(7%) of the planted area was irrigated. An estimated 450(5%) households
practiced irrigation with primarily hand buckets and gravity in 2007/08. Rivers and canals
are the most important source of water for irrigation in Mkoani district.
Crop marketing:
Over 3600 (8%) of the households reported selling crops. Marketing challenges included
low open market price, distant markets and high transport costs.
Agricultural extension service:
Mkoani occupied the 5th position in the proportion of households in Zanzibar (12.5%)
receiving agricultural extension advice by mainly Government, neighbors and newspapers.
10. Livestock and artisanal fishery:
The major livestock in Mkoani were
cattle (16,976,11%),
goats(7,801,11%),chickens(133,521,12),
donkeys(54,15%) and ducks(347,1%).
Fish production declined from 3.9
million tons in 2005 to 3.4 million tons
in 2010. The district occupies the 4th
highest number of goats and also
follows Central district in number of
households rearing goats in Zanzibar.
It had a goat density of 34 goats per
sq.km. Cases of Tick Borne disease
were moderate at3,981(34%)while
nine and two percents of the Cattle
rearing households reported Lumpy
Skin Disease (LSD) and Foot and
Mouth Disease (FMD) respectively.
Livestock rearing households also rose
from 4,831(13.3) in 2004/05 to 6,524 (14.2) in 2007/08.
Mkoani Livestock & fisheries
production
2004/05 2007/08
Total # of hou seholds rearing
liv estock 4831(13.3)
6 ,524 (14.2)
Indigenou s Cattle (#/%) 15589(10.1) 1 6,922(11.3)
Im prov ed dairy cattle (#/%) 146(1.8) 5 4(0.78)
Total # of district Cattle 15,735(9.7) 1 6,976(10.9)
Total # of milked cows in Wet / Dry
Seasons
3,766(8.4)/2,96
3 (8.1)
Hou seholds rearing Cattle 5 ,721(14.5)
# of Indigenou s goats 4,723(9.1) 7 ,801(13.7)
# of Im prov ed dairy goats - -
Total #of households rearing goats 1 ,892(14.4)
Total # and % of district goats 4,723(9.0) 7 ,801(11.3)
Donkey s 0 5 4(15.3)
Indigenou s chickens (#/%) 145,320(15.4) 132,905(14.2)
# of lay ers 6 16(0.47)
# of Broilers -
Total district Chickens (#/%) 145,408(13.7) 133,521(12.4)
Hou seholds rearing chickens 1 0,532(13.2)
Du cks kept - 3 48(1.0)
Eggs produ ced (in m illions)
0.314(2.0)
Fish produ ction (tonnes) 3,911,660(17) 3 ,378.035(13.1)