The document provides examples of student work and analysis on a 7th grade math assessment task involving mixing paints. It includes:
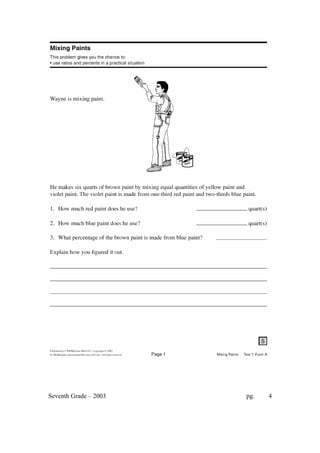
1) Examples of four student solutions, with some students accurately tracking amounts and percentages while others lost track of whole amounts.
2) Analysis of common student errors like providing fractions instead of amounts in quarts or incorrectly thinking the percentage was 66% instead of 33%.
3) A summary of what students understood, such as finding fractional amounts of paint, and areas of difficulty like using fractions versus amounts and tracking part-whole relationships.


![Human Reproduction [ Reproductive System ] Notes @irfanullah_mehar Irfanullah...](https://cdn.slidesharecdn.com/ss_thumbnails/humanreproductionreproductivesystemnotesirfanullahmeharirfanullahmeharjanantantra-260111172350-56e85778-thumbnail.jpg?width=640&height=640&fit=bounds)


