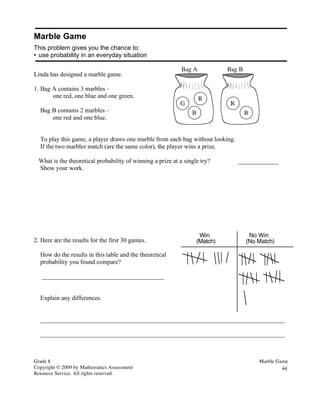
SlideShare a Scribd company logo
Grade 8 Marble Game
Copyright © 2009 by Mathematics Assessment
Resource Service. All rights reserved.
44
Marble Game
This problem gives you the chance to:
• use probability in an everyday situation
Linda has designed a marble game.
1. Bag A contains 3 marbles –
one red, one blue and one green.
Bag B contains 2 marbles –
one red and one blue.
To play this game, a player draws one marble from each bag without looking.
If the two marbles match (are the same color), the player wins a prize.
What is the theoretical probability of winning a prize at a single try? _____________
Show your work.
2. Here are the results for the first 30 games.
How do the results in this table and the theoretical
probability you found compare?
_______________________________________
Explain any differences.
______________________________________________________________________________
______________________________________________________________________________
Win
(Match)
No Win
(No Match)
B
R
G
B
R
Bag A Bag B
Grade 8 Marble Game
Copyright © 2009 by Mathematics Assessment
Resource Service. All rights reserved.
45
3. Linda has designed a second game.
The spinner has nine equal sections.
To play the game, a player spins the spinner.
If the spinner lands on a Gold section,
the player wins a prize.
Does the player have a better chance of winning with
the bag game or the spinner game?
__________________________________________
Explain your reasoning.
______________________________________________________________________________
______________________________________________________________________________
______________________________________________________________________________
7
Red
Red
Red
Red
Gold
Gold
Gold
Gold
Blue
Grade 8
Copyright © 2009 by Mathematics Assessment
Resource Service. All rights reserved.
46
Marble Game Rubric
The core elements of performance required by this task are:
• listed here
Based on these, credit for specific aspects of performance should be assigned as follows points
section
points
1.
Gives correct answer:
!
2
6
=
1
3
Lists all possibilities: RR, RB, BR, BB, GR, GB
p(RR or BB) = 2/6 or 1/3
or
Shows work such as: Probability
!
R" R =
1
3
#
1
2
Probability
!
B" B =
1
3
#
1
2
Probability both same color =
!
1
6
+
1
6
1
1
1
or
1
1
3
2. These results are quite close;
but the number of trials is not large enough to give an accurate estimate.
or
Explains that from these results the experimental probability
=
!
9
30
=
3
10
= 0.3
The theoretical probability = 0.33 recurring
1
1
1
2
3. Gives correct answer: the spinner game
Shows work such as:
the probability of winning on the spinner game is 4/9 = 0.44 recurring
1
1
2
Total Points 7
Grade 8
Copyright © 2009 by Noyce Foundation
All rights reserved.
47
Marble Game
Work the task and look at the rubric. What are the key mathematical ideas being
assessed in this
task?_______________________________________________________
What activities or experiences have students had with probability this year to help
prepare them for the High School Exit Exam?
How do you help students draw or define sample spaces? What models do they know?
Look at student work on part 1. How many of your students put:
1/3 2/3 4/5 2/5 1/5 Red Other
Make a list of models students used to figure out probability:
• Organized list
• Formula
Now look at student work of part 2. How many students:
• Knew the probability was 9/30 or 30%?__________
• Did not compare to the two probabilities?_________
• Thought that winning was unlikely (nonnumerical)?____________
• Thought there were less wins than losses?______________
• Thought the probability was 9/21 or 3/7?_____________
What are some of the big ideas about quantifying probability that your students did not
understand?
Now look at student work on part 3, finding the probability of the spinner. How many of
your students thought
• the spinner was better?________________
• the bag game was better?______________
• they were equal?_____________________
How many of your students did not attempt to quantify the probability for winning the
spinner?_________________
Grade 8
Copyright © 2009 by Noyce Foundation
All rights reserved.
48
Looking at Student Work on Marble Game
Student A is able to make an organized list to show the sample space in part 1 and
quantify the probability. The student does not how to convert the frequency table into a
probability but recognizes that the total is important to the fraction. The student is able to
quantify the probability on the spinner and compare it correctly to the bag game.
Student A
Grade 8
Copyright © 2009 by Noyce Foundation
All rights reserved.
49
Student B is able to get the correct probability, but from drawing the sample space
incorrectly. What error has the student made? The student is able to calculate the
experimental probability from the frequency table and understands that the denominators
need to be the same to compare the two probabilities. However the student makes the
wrong choice when comparing the two. The student has a complete explanation for part
3.
Student B
Grade 8
Copyright © 2009 by Noyce Foundation
All rights reserved.
50
Student C is able to draw a complete sample space and identify the winning choices, the
student even gives the numerical probability. The student does not see the importance of
the numerical probability with the idea of likely, unlikely, and certain, etc. dominating
the thinking. Notice that in part 2 the student doesn’t quantify the experimental
probability. The student does give the correct numerical probability in part 3.
Student C
Grade 8
Copyright © 2009 by Noyce Foundation
All rights reserved.
51
Student D is not very explanatory and relies on numbers. In part 1 the student thinks
about a variety of choices, but lands on the correct probability. In part 2 the student
quantifies the probability, but makes no attempt to compare the probabilities. In part 3
the student finds the numerical probability.
Student D
Grade 8
Copyright © 2009 by Noyce Foundation
All rights reserved.
52
Student E is able to define the sample space and give a definition for finding probability.
The student can’t turn the definition into a numerical expression. Instead the student
quantifies the number of wins. In part 2 the student is also concerned with winning or
losing rather than a numerical expression. The student subtracts wins from losses with
the frequency table, rather than comparing the probability in 1 with the probability in 2.
The student could find the numerical probability for the spinner. How do we help students
to see the relevance for the numerical probability when their focus is on the importance
of winning? What would make this important to them?
Student E
Grade 8
Copyright © 2009 by Noyce Foundation
All rights reserved.
53
Student F gets the correct probability, but for the wrong reasons. The student seems to
think about 2 bags, so 50% and 50% to get 100. Then the student divides by the 3
marbles in the first bag. The student does calculate correctly the experimental
probability. In part 3 the student incorrectly counts the number of sections on the
spinner. The student doesn’t combine the winning choices.
Student F
Grade 8
Copyright © 2009 by Noyce Foundation
All rights reserved.
54
Student G is able to make a list for the sample space, but doesn’t know how to use it to
write a correct probability. The student does not use the total in either part 1 or part 2.
The student doesn’t understand how to set up the probability for the spinner, and instead
seems to compare the reds from the two games.
Student G
Grade 8
Copyright © 2009 by Noyce Foundation
All rights reserved.
55
Student H attempts to draw the sample space, but uses the first bag twice. The student
seems to think that games should be fair, have a 50% chance of winning in part 2. The
student is able to identify the winning spaces on the spinner, but then compares chances
to chances rather than probability.
Student H
Grade 8
Copyright © 2009 by Noyce Foundation
All rights reserved.
56
Student I identifies the winning combinations in part 1, but sets up the probability with
total marbles instead of total possibilities. What experiences help students to understand
the distinction between the two? In part 2 the student seems to compare the winning to
not winning rather than set up a probability. In part 3 the student doesn’t quantify the
fraction for winning on the spinner.
Student I
Grade 8
Copyright © 2009 by Noyce Foundation
All rights reserved.
57
8th
Grade Task 3 Marble Game
Student Task Use probability in an everyday situation.
Core Idea 2
Probability
Apply and deepen understanding of theoretical and empirical
probability.
• Determine theoretical and experimental probabilities and use
these to make predictions about events.
• Represent probabilities as ratios, proportions, decimals or
percents.
• Represent the sample space for a given event in an organized
way.
Mathematics of this task:
• Define a sample space for a game
• Identify winning combinations
• Express theoretical probability numerically
• Convert data from a frequency table to an experimental probability
• Compare probabilities by finding commonality (percents, common denominator)
• Find simple probability for a spinner
Based on teacher observation, this is what eighth graders know and are able to do:
• Determine the game with the best probability of winning
• Identify the probability on a spinner
Areas of difficulty for eighth graders:
• Understanding the difference between marbles and the total possibilities in setting
up the probabilities
• Defining a sample space for a compound event
• Still thinking about likely/ unlikely or wining/losing instead of in terms of
numerical probabilities
• Comparing colors in the bag game and spinner instead of the probabilities
• Using numbers to quantify the probability in the frequency table and spinner
Grade 8
Copyright © 2009 by Noyce Foundation
All rights reserved.
58
The maximum score available for this task is 7 points.
The minimum score for a level 3 response, meeting standards, is 4 points.
More than half the students, 60%, could identify the winning game. Some students, 28%,
could also give the numerical probability for winning the spinner game. About 7% of the
students could find the probability for winning the bag game (their reasoning may not
have been correct). Less than 1% of the students could meet all the demands of the task
including defining the sample space for the bag game and giving the theoretical and
experimental probability and noticing that they were close in value. 40% of the students
scored no points on this task. 92% of the students in the sample with this score attempted
the task.
Grade 8
Copyright © 2009 by Noyce Foundation
All rights reserved.
59
Marble Game
Points Understandings Misunderstandings
0 40% of the students in the
sample got this score. 92% of
them attempted the task.
18% of the students thought the chances of
winning the bag game were better. 10%
thought the chances were the same for both
games. 20% made no attempt to quantify
the probability on the spinner game. Some
students subtracted winning outcomes (4-
2).
1 Students could select the game
with the highest probability of
winning.
Students could not support their reasoning
by quantifying the probability on the
spinner.
2 Students could give the
probability of winning on the
spinner and knew it was a higher
probability than the bag game.
Students could not find the probability for
winning the bag game. 8% thought the
probability was 4/5. 8% thought the
probability was 2/3. 8% thought the
probability was 2/5.
3 Students could work with the
spinner game and find the
probability for the bag game.
Students could not give convincing or
correct justification for their probability.
Many students arrived at a probability of
1/3 using incorrect logic.
4 Students could find the correct
probability for the bag game
with correct reasoning, give the
correct probability for the
spinner game, and compare the
two values.
Students could not write the experimental
probability or compare it to the probability
for the bag game. 13% used the word
unlikely instead of giving a numerical
value. 13% did not attempt this part of the
task. 8% of the students compared winning
to losing in the frequency table instead of
comparing the frequency table to the
theoretical probability in part 1.
7 Students could reason about a
compound event, define the
sample space, and write a
probability. Students could
convert a frequency table into an
experimental probability.
Students could compare
probabilities by converting them
to decimals, percents or fractions
with common denominators.
Students could give a probability
for a simple event like a spinner.
Grade 8
Copyright © 2009 by Noyce Foundation
All rights reserved.
60
Implications for Instruction
Students need more exposure to probability. While in elementary school, students learn
about probability in terms of likelihood, in middles school students should start to make
progress on quantifying probability. Students need to see the difference between odds
(favorable outcomes to unfavorable outcomes) and probability (favorable outcomes to
total possible outcomes).
Before any of this can be determined, students need to be able to develop sample space.
The spinner is easy because all of the spaces were equal size and could be added together.
Students understand generally how to determine probability on a single number cube.
They have trouble with compound events: rolling a die and then rolling a second die or
spinning a spinner; drawing from two different bags. Students need to practice with
strategies like making an organized list or drawing a tree diagram to help them develop
all the possible outcomes. Some students still have trouble distinguishing between the
actual objects used in the event (marbles in the bag) and the outcome of drawing the red
marble.
Some students need to understand that probability is the chance of something happening
rather than winning. Many students were only focused on winning the game. Students
need to think about the difference between theoretical probability and experimental
probability. While many students could quantify the size of the experimental probability,
there was little evidence about the difference between chance and expected values.
Ideas for Action Research
With 40% of the students scoring no points on this task, students need to do some serious
work with the idea of probability. While this isn’t an eighth grade standard, it is tested
on the High School Exit exam. Probability is also an interesting way to help students
review ideas about fractions and decimals, making them feel like they are studying a new
topic.
Before trying to formalize the information, students just need to build up some
experiential knowledge. They need lots of experiences with games of chance. Some
interesting tasks can be found in Chance Encounters by Education Development Center,
Inc.
One group of activities involves describing probabilities as fractions, percents, decimals
and ratios. It is called Designing Mystery Spinner Games. See a part of the activity on
the next page. A different set of activities is to decide if games are Fair. See examples on
following pages. A problem of the month on Fair Games is also available on the SVMI
website: www.svmimac.org
Grade 8
Copyright © 2009 by Noyce Foundation
All rights reserved.
61
How does this activity press students to practice skills such as using fractions, decimals,
and percentages? How does it help students use justification and mathematical
reasoning?
Grade 8
Copyright © 2009 by Noyce Foundation
All rights reserved.
62
Grade 8
Copyright © 2009 by Noyce Foundation
All rights reserved.
63
In this game, students are asked to help Terry decide which is the better game to play.
How does this help students practice basic skills? What strategies do you think students
might use to rank the games?
Grade 8
Copyright © 2009 by Noyce Foundation
All rights reserved.
64
© 2012 Noyce Foundation
Performance Assessment Task
Marble Game
Grade 8 task aligns in part to CCSSM HS Statistics & Probability
Task Description
The task challenges a student to demonstrate an understanding of theoretical and empirical
probability. A student must make sense of these probabilities and be able to represent the sample
space for a given event in an organized manner. A student must be able to represent probabilities as
ratios, proportions, decimals or percents. A student must determine and compare probabilities by
finding commonality such as using percents or finding a common denominator. A student must
determine the game with the best probability of winning.
Common Core State Standards Math ‐ Content Standards
High School – Statistics and Probability ­ Conditional Probability and the Rules of Probability
Understand independence and conditional probability and use them to interpret data.
S‐CP.1 Describe events as subsets of a sample space (the set of outcomes) using characteristics (or
categories) of the outcomes, or as unions, intersections, or complements of other events (“or,” “and,”
“not”).
Common Core State Standards Math – Standards of Mathematical Practice
MP.2 Reason abstractly and quantitatively.
Mathematically proficient students make sense of quantities and their relationships in problem
situations. They bring two complementary abilities to bear on problems involving quantitative
relationships: the ability to decontextualize—to abstract a given situation and represent it
symbolically and manipulate the representing symbols as if they have a life of their own, without
necessarily attending to their referents—and the ability to contextualize, to pause as needed during
the manipulation process in order to probe into the referents for the symbols involved. Quantitative
reasoning entails habits of creating a coherent representation of the problem at hand; considering
the units involved; attending to the meaning of quantities, not just how to compute them; and
knowing and flexibly using different properties of operations and objects.
MP.4 Model with mathematics.
Mathematically proficient students can apply the mathematics they know to solve problems arising
in everyday life, society, and the workplace. In early grades, this might be as simple as writing an
addition equation to describe a situation. In middle grades, a student might apply proportional
reasoning to plan a school event or analyze a problem in the community. By high school, a student
might use geometry to solve a design problem or use a function to describe how one quantity of
interest depends on another. Mathematically proficient students who can apply what they know are
comfortable making assumptions and approximations to simplify a complicated situation, realizing
that these may need revision later. They are able to identify important quantities in a practical
situation and map their relationships using such tools as diagrams, two‐way tables, graphs,
flowcharts and formulas. They can analyze those relationships mathematically to draw conclusions.
They routinely interpret their mathematical results in the context of the situation and reflect on
whether the results make sense, possibly improving the model if it has not served its purpose.
Assessment Results
This task was developed by the Mathematics Assessment Resource Service and administered as part
of a national, normed math assessment. For comparison purposes, teachers may be interested in the
results of the national assessment, including the total points possible for the task, the number of core
points, and the percent of students that scored at standard on the task. Related materials, including
the scoring rubric, student work, and discussions of student understandings and misconceptions on
the task, are included in the task packet.
Grade Level Year Total Points Core Points % At Standard
8 2009 7 4 8 %

More Related Content

Similar to marble game.pdf

STI Course A Closer Look at Singapore Math by Yeap Ban Har
STI Course A Closer Look at Singapore Math by Yeap Ban HarSTI Course A Closer Look at Singapore Math by Yeap Ban Har
STI Course A Closer Look at Singapore Math by Yeap Ban Har
Jimmy Keng
 
Math - ratio and Proportion.pptx
Math - ratio and Proportion.pptxMath - ratio and Proportion.pptx
Math - ratio and Proportion.pptx
Izah Catli
 
Probability distribution of a random variable module
Probability distribution of a random variable moduleProbability distribution of a random variable module
Probability distribution of a random variable module
Melody01082019
 
Introduction to probability
Introduction to probabilityIntroduction to probability
Introduction to probability
CHRIST1O
 
G4ww5 8
G4ww5 8G4ww5 8
G4ww5 8
tuananh1010
 
(7) Lesson 9.5
(7) Lesson 9.5(7) Lesson 9.5
(7) Lesson 9.5
wzuri
 
Math Lit Lessons 2.5 & 2.6
Math Lit Lessons 2.5 & 2.6Math Lit Lessons 2.5 & 2.6
Math Lit Lessons 2.5 & 2.6kathleenalmy
 
Nim games
Nim gamesNim games
Nim games
navajomath
 
DLL_WEEK3_LC39-40.docx
DLL_WEEK3_LC39-40.docxDLL_WEEK3_LC39-40.docx
DLL_WEEK3_LC39-40.docx
nestthecasidsid2
 
Variational worksheets
Variational worksheetsVariational worksheets
Variational worksheets
Juliecadena
 
(7) Lesson 9.7
(7) Lesson 9.7(7) Lesson 9.7
(7) Lesson 9.7
wzuri
 
parallelogram.pdf
parallelogram.pdfparallelogram.pdf
parallelogram.pdf
WendyMadrid3
 
Intro to PSAT Grade 10
Intro to PSAT Grade 10Intro to PSAT Grade 10
Intro to PSAT Grade 10IS Manila
 
Lesson Plan in Mathematics 3
Lesson Plan in Mathematics 3Lesson Plan in Mathematics 3
Lesson Plan in Mathematics 3
Emilio Fer Villa
 
MATH-UNIT-2-GRADE-3-LESSON-51-53 (1).pptx
MATH-UNIT-2-GRADE-3-LESSON-51-53 (1).pptxMATH-UNIT-2-GRADE-3-LESSON-51-53 (1).pptx
MATH-UNIT-2-GRADE-3-LESSON-51-53 (1).pptx
ArleneSon1
 
Use this template to insert your answers for the assignment. Pl.docx
Use this template to insert your answers for the assignment.  Pl.docxUse this template to insert your answers for the assignment.  Pl.docx
Use this template to insert your answers for the assignment. Pl.docx
dickonsondorris
 
Lesson plan in Grade 8 Mathematics Probability Q4W6.docx
Lesson plan in  Grade 8 Mathematics Probability Q4W6.docxLesson plan in  Grade 8 Mathematics Probability Q4W6.docx
Lesson plan in Grade 8 Mathematics Probability Q4W6.docx
CatherineSanchezPart
 

Similar to marble game.pdf (20)

3 math lm q2
3 math lm q23 math lm q2
3 math lm q2
 
STI Course A Closer Look at Singapore Math by Yeap Ban Har
STI Course A Closer Look at Singapore Math by Yeap Ban HarSTI Course A Closer Look at Singapore Math by Yeap Ban Har
STI Course A Closer Look at Singapore Math by Yeap Ban Har
 
Math - ratio and Proportion.pptx
Math - ratio and Proportion.pptxMath - ratio and Proportion.pptx
Math - ratio and Proportion.pptx
 
Probability distribution of a random variable module
Probability distribution of a random variable moduleProbability distribution of a random variable module
Probability distribution of a random variable module
 
Introduction to probability
Introduction to probabilityIntroduction to probability
Introduction to probability
 
Lesson plan drvsr
Lesson plan drvsrLesson plan drvsr
Lesson plan drvsr
 
G4ww5 8
G4ww5 8G4ww5 8
G4ww5 8
 
(7) Lesson 9.5
(7) Lesson 9.5(7) Lesson 9.5
(7) Lesson 9.5
 
Math Lit Lessons 2.5 & 2.6
Math Lit Lessons 2.5 & 2.6Math Lit Lessons 2.5 & 2.6
Math Lit Lessons 2.5 & 2.6
 
Nim games
Nim gamesNim games
Nim games
 
DLL_WEEK3_LC39-40.docx
DLL_WEEK3_LC39-40.docxDLL_WEEK3_LC39-40.docx
DLL_WEEK3_LC39-40.docx
 
EOG Boot Camp
EOG Boot CampEOG Boot Camp
EOG Boot Camp
 
Variational worksheets
Variational worksheetsVariational worksheets
Variational worksheets
 
(7) Lesson 9.7
(7) Lesson 9.7(7) Lesson 9.7
(7) Lesson 9.7
 
parallelogram.pdf
parallelogram.pdfparallelogram.pdf
parallelogram.pdf
 
Intro to PSAT Grade 10
Intro to PSAT Grade 10Intro to PSAT Grade 10
Intro to PSAT Grade 10
 
Lesson Plan in Mathematics 3
Lesson Plan in Mathematics 3Lesson Plan in Mathematics 3
Lesson Plan in Mathematics 3
 
MATH-UNIT-2-GRADE-3-LESSON-51-53 (1).pptx
MATH-UNIT-2-GRADE-3-LESSON-51-53 (1).pptxMATH-UNIT-2-GRADE-3-LESSON-51-53 (1).pptx
MATH-UNIT-2-GRADE-3-LESSON-51-53 (1).pptx
 
Use this template to insert your answers for the assignment. Pl.docx
Use this template to insert your answers for the assignment.  Pl.docxUse this template to insert your answers for the assignment.  Pl.docx
Use this template to insert your answers for the assignment. Pl.docx
 
Lesson plan in Grade 8 Mathematics Probability Q4W6.docx
Lesson plan in  Grade 8 Mathematics Probability Q4W6.docxLesson plan in  Grade 8 Mathematics Probability Q4W6.docx
Lesson plan in Grade 8 Mathematics Probability Q4W6.docx
 

More from WendyMadrid3

Rewardchart.pdf
Rewardchart.pdfRewardchart.pdf
Rewardchart.pdf
WendyMadrid3
 
CUADERNO-DISLEXIA.pdf
CUADERNO-DISLEXIA.pdfCUADERNO-DISLEXIA.pdf
CUADERNO-DISLEXIA.pdf
WendyMadrid3
 
toy trains.pdf
toy trains.pdftoy trains.pdf
toy trains.pdf
WendyMadrid3
 
how old are they.pdf
how old are they.pdfhow old are they.pdf
how old are they.pdf
WendyMadrid3
 
photographs.pdf
photographs.pdfphotographs.pdf
photographs.pdf
WendyMadrid3
 
which is bigger.pdf
which is bigger.pdfwhich is bigger.pdf
which is bigger.pdf
WendyMadrid3
 
mixing paints.pdf
mixing paints.pdfmixing paints.pdf
mixing paints.pdf
WendyMadrid3
 
pizza crusts.pdf
pizza crusts.pdfpizza crusts.pdf
pizza crusts.pdf
WendyMadrid3
 
ducklings.pdf
ducklings.pdfducklings.pdf
ducklings.pdf
WendyMadrid3
 
lawn mowing.pdf
lawn mowing.pdflawn mowing.pdf
lawn mowing.pdf
WendyMadrid3
 
hexagons.pdf
hexagons.pdfhexagons.pdf
hexagons.pdf
WendyMadrid3
 

More from WendyMadrid3 (11)

Rewardchart.pdf
Rewardchart.pdfRewardchart.pdf
Rewardchart.pdf
 
CUADERNO-DISLEXIA.pdf
CUADERNO-DISLEXIA.pdfCUADERNO-DISLEXIA.pdf
CUADERNO-DISLEXIA.pdf
 
toy trains.pdf
toy trains.pdftoy trains.pdf
toy trains.pdf
 
how old are they.pdf
how old are they.pdfhow old are they.pdf
how old are they.pdf
 
photographs.pdf
photographs.pdfphotographs.pdf
photographs.pdf
 
which is bigger.pdf
which is bigger.pdfwhich is bigger.pdf
which is bigger.pdf
 
mixing paints.pdf
mixing paints.pdfmixing paints.pdf
mixing paints.pdf
 
pizza crusts.pdf
pizza crusts.pdfpizza crusts.pdf
pizza crusts.pdf
 
ducklings.pdf
ducklings.pdfducklings.pdf
ducklings.pdf
 
lawn mowing.pdf
lawn mowing.pdflawn mowing.pdf
lawn mowing.pdf
 
hexagons.pdf
hexagons.pdfhexagons.pdf
hexagons.pdf
 

Recently uploaded

GBSN- Microbiology (Lab 3) Gram Staining
GBSN- Microbiology (Lab 3) Gram StainingGBSN- Microbiology (Lab 3) Gram Staining
GBSN- Microbiology (Lab 3) Gram Staining
Areesha Ahmad
 
Earliest Galaxies in the JADES Origins Field: Luminosity Function and Cosmic ...
Earliest Galaxies in the JADES Origins Field: Luminosity Function and Cosmic ...Earliest Galaxies in the JADES Origins Field: Luminosity Function and Cosmic ...
Earliest Galaxies in the JADES Origins Field: Luminosity Function and Cosmic ...
Sérgio Sacani
 
Orion Air Quality Monitoring Systems - CWS
Orion Air Quality Monitoring Systems - CWSOrion Air Quality Monitoring Systems - CWS
Orion Air Quality Monitoring Systems - CWS
Columbia Weather Systems
 
justice-and-fairness-ethics with example
justice-and-fairness-ethics with examplejustice-and-fairness-ethics with example
justice-and-fairness-ethics with example
azzyixes
 
plant biotechnology Lecture note ppt.pptx
plant biotechnology Lecture note ppt.pptxplant biotechnology Lecture note ppt.pptx
plant biotechnology Lecture note ppt.pptx
yusufzako14
 
(May 29th, 2024) Advancements in Intravital Microscopy- Insights for Preclini...
(May 29th, 2024) Advancements in Intravital Microscopy- Insights for Preclini...(May 29th, 2024) Advancements in Intravital Microscopy- Insights for Preclini...
(May 29th, 2024) Advancements in Intravital Microscopy- Insights for Preclini...
Scintica Instrumentation
 
Structural Classification Of Protein (SCOP)
Structural Classification Of Protein  (SCOP)Structural Classification Of Protein  (SCOP)
Structural Classification Of Protein (SCOP)
aishnasrivastava
 
Lateral Ventricles.pdf very easy good diagrams comprehensive
Lateral Ventricles.pdf very easy good diagrams comprehensiveLateral Ventricles.pdf very easy good diagrams comprehensive
Lateral Ventricles.pdf very easy good diagrams comprehensive
silvermistyshot
 
Nutraceutical market, scope and growth: Herbal drug technology
Nutraceutical market, scope and growth: Herbal drug technologyNutraceutical market, scope and growth: Herbal drug technology
Nutraceutical market, scope and growth: Herbal drug technology
Lokesh Patil
 
extra-chromosomal-inheritance[1].pptx.pdfpdf
extra-chromosomal-inheritance[1].pptx.pdfpdfextra-chromosomal-inheritance[1].pptx.pdfpdf
extra-chromosomal-inheritance[1].pptx.pdfpdf
DiyaBiswas10
 
Penicillin...........................pptx
Penicillin...........................pptxPenicillin...........................pptx
Penicillin...........................pptx
Cherry
 
SCHIZOPHRENIA Disorder/ Brain Disorder.pdf
SCHIZOPHRENIA Disorder/ Brain Disorder.pdfSCHIZOPHRENIA Disorder/ Brain Disorder.pdf
SCHIZOPHRENIA Disorder/ Brain Disorder.pdf
SELF-EXPLANATORY
 
Structures and textures of metamorphic rocks
Structures and textures of metamorphic rocksStructures and textures of metamorphic rocks
Structures and textures of metamorphic rocks
kumarmathi863
 
erythropoiesis-I_mechanism& clinical significance.pptx
erythropoiesis-I_mechanism& clinical significance.pptxerythropoiesis-I_mechanism& clinical significance.pptx
erythropoiesis-I_mechanism& clinical significance.pptx
muralinath2
 
Citrus Greening Disease and its Management
Citrus Greening Disease and its ManagementCitrus Greening Disease and its Management
Citrus Greening Disease and its Management
subedisuryaofficial
 
THE IMPORTANCE OF MARTIAN ATMOSPHERE SAMPLE RETURN.
THE IMPORTANCE OF MARTIAN ATMOSPHERE SAMPLE RETURN.THE IMPORTANCE OF MARTIAN ATMOSPHERE SAMPLE RETURN.
THE IMPORTANCE OF MARTIAN ATMOSPHERE SAMPLE RETURN.
Sérgio Sacani
 
Richard's entangled aventures in wonderland
Richard's entangled aventures in wonderlandRichard's entangled aventures in wonderland
Richard's entangled aventures in wonderland
Richard Gill
 
general properties of oerganologametal.ppt
general properties of oerganologametal.pptgeneral properties of oerganologametal.ppt
general properties of oerganologametal.ppt
IqrimaNabilatulhusni
 
Cancer cell metabolism: special Reference to Lactate Pathway
Cancer cell metabolism: special Reference to Lactate PathwayCancer cell metabolism: special Reference to Lactate Pathway
Cancer cell metabolism: special Reference to Lactate Pathway
AADYARAJPANDEY1
 
platelets- lifespan -Clot retraction-disorders.pptx
platelets- lifespan -Clot retraction-disorders.pptxplatelets- lifespan -Clot retraction-disorders.pptx
platelets- lifespan -Clot retraction-disorders.pptx
muralinath2
 

Recently uploaded (20)

GBSN- Microbiology (Lab 3) Gram Staining
GBSN- Microbiology (Lab 3) Gram StainingGBSN- Microbiology (Lab 3) Gram Staining
GBSN- Microbiology (Lab 3) Gram Staining
 
Earliest Galaxies in the JADES Origins Field: Luminosity Function and Cosmic ...
Earliest Galaxies in the JADES Origins Field: Luminosity Function and Cosmic ...Earliest Galaxies in the JADES Origins Field: Luminosity Function and Cosmic ...
Earliest Galaxies in the JADES Origins Field: Luminosity Function and Cosmic ...
 
Orion Air Quality Monitoring Systems - CWS
Orion Air Quality Monitoring Systems - CWSOrion Air Quality Monitoring Systems - CWS
Orion Air Quality Monitoring Systems - CWS
 
justice-and-fairness-ethics with example
justice-and-fairness-ethics with examplejustice-and-fairness-ethics with example
justice-and-fairness-ethics with example
 
plant biotechnology Lecture note ppt.pptx
plant biotechnology Lecture note ppt.pptxplant biotechnology Lecture note ppt.pptx
plant biotechnology Lecture note ppt.pptx
 
(May 29th, 2024) Advancements in Intravital Microscopy- Insights for Preclini...
(May 29th, 2024) Advancements in Intravital Microscopy- Insights for Preclini...(May 29th, 2024) Advancements in Intravital Microscopy- Insights for Preclini...
(May 29th, 2024) Advancements in Intravital Microscopy- Insights for Preclini...
 
Structural Classification Of Protein (SCOP)
Structural Classification Of Protein  (SCOP)Structural Classification Of Protein  (SCOP)
Structural Classification Of Protein (SCOP)
 
Lateral Ventricles.pdf very easy good diagrams comprehensive
Lateral Ventricles.pdf very easy good diagrams comprehensiveLateral Ventricles.pdf very easy good diagrams comprehensive
Lateral Ventricles.pdf very easy good diagrams comprehensive
 
Nutraceutical market, scope and growth: Herbal drug technology
Nutraceutical market, scope and growth: Herbal drug technologyNutraceutical market, scope and growth: Herbal drug technology
Nutraceutical market, scope and growth: Herbal drug technology
 
extra-chromosomal-inheritance[1].pptx.pdfpdf
extra-chromosomal-inheritance[1].pptx.pdfpdfextra-chromosomal-inheritance[1].pptx.pdfpdf
extra-chromosomal-inheritance[1].pptx.pdfpdf
 
Penicillin...........................pptx
Penicillin...........................pptxPenicillin...........................pptx
Penicillin...........................pptx
 
SCHIZOPHRENIA Disorder/ Brain Disorder.pdf
SCHIZOPHRENIA Disorder/ Brain Disorder.pdfSCHIZOPHRENIA Disorder/ Brain Disorder.pdf
SCHIZOPHRENIA Disorder/ Brain Disorder.pdf
 
Structures and textures of metamorphic rocks
Structures and textures of metamorphic rocksStructures and textures of metamorphic rocks
Structures and textures of metamorphic rocks
 
erythropoiesis-I_mechanism& clinical significance.pptx
erythropoiesis-I_mechanism& clinical significance.pptxerythropoiesis-I_mechanism& clinical significance.pptx
erythropoiesis-I_mechanism& clinical significance.pptx
 
Citrus Greening Disease and its Management
Citrus Greening Disease and its ManagementCitrus Greening Disease and its Management
Citrus Greening Disease and its Management
 
THE IMPORTANCE OF MARTIAN ATMOSPHERE SAMPLE RETURN.
THE IMPORTANCE OF MARTIAN ATMOSPHERE SAMPLE RETURN.THE IMPORTANCE OF MARTIAN ATMOSPHERE SAMPLE RETURN.
THE IMPORTANCE OF MARTIAN ATMOSPHERE SAMPLE RETURN.
 
Richard's entangled aventures in wonderland
Richard's entangled aventures in wonderlandRichard's entangled aventures in wonderland
Richard's entangled aventures in wonderland
 
general properties of oerganologametal.ppt
general properties of oerganologametal.pptgeneral properties of oerganologametal.ppt
general properties of oerganologametal.ppt
 
Cancer cell metabolism: special Reference to Lactate Pathway
Cancer cell metabolism: special Reference to Lactate PathwayCancer cell metabolism: special Reference to Lactate Pathway
Cancer cell metabolism: special Reference to Lactate Pathway
 
platelets- lifespan -Clot retraction-disorders.pptx
platelets- lifespan -Clot retraction-disorders.pptxplatelets- lifespan -Clot retraction-disorders.pptx
platelets- lifespan -Clot retraction-disorders.pptx
 

marble game.pdf

  • 1. Grade 8 Marble Game Copyright © 2009 by Mathematics Assessment Resource Service. All rights reserved. 44 Marble Game This problem gives you the chance to: • use probability in an everyday situation Linda has designed a marble game. 1. Bag A contains 3 marbles – one red, one blue and one green. Bag B contains 2 marbles – one red and one blue. To play this game, a player draws one marble from each bag without looking. If the two marbles match (are the same color), the player wins a prize. What is the theoretical probability of winning a prize at a single try? _____________ Show your work. 2. Here are the results for the first 30 games. How do the results in this table and the theoretical probability you found compare? _______________________________________ Explain any differences. ______________________________________________________________________________ ______________________________________________________________________________ Win (Match) No Win (No Match) B R G B R Bag A Bag B
  • 2. Grade 8 Marble Game Copyright © 2009 by Mathematics Assessment Resource Service. All rights reserved. 45 3. Linda has designed a second game. The spinner has nine equal sections. To play the game, a player spins the spinner. If the spinner lands on a Gold section, the player wins a prize. Does the player have a better chance of winning with the bag game or the spinner game? __________________________________________ Explain your reasoning. ______________________________________________________________________________ ______________________________________________________________________________ ______________________________________________________________________________ 7 Red Red Red Red Gold Gold Gold Gold Blue
  • 3. Grade 8 Copyright © 2009 by Mathematics Assessment Resource Service. All rights reserved. 46 Marble Game Rubric The core elements of performance required by this task are: • listed here Based on these, credit for specific aspects of performance should be assigned as follows points section points 1. Gives correct answer: ! 2 6 = 1 3 Lists all possibilities: RR, RB, BR, BB, GR, GB p(RR or BB) = 2/6 or 1/3 or Shows work such as: Probability ! R" R = 1 3 # 1 2 Probability ! B" B = 1 3 # 1 2 Probability both same color = ! 1 6 + 1 6 1 1 1 or 1 1 3 2. These results are quite close; but the number of trials is not large enough to give an accurate estimate. or Explains that from these results the experimental probability = ! 9 30 = 3 10 = 0.3 The theoretical probability = 0.33 recurring 1 1 1 2 3. Gives correct answer: the spinner game Shows work such as: the probability of winning on the spinner game is 4/9 = 0.44 recurring 1 1 2 Total Points 7
  • 4. Grade 8 Copyright © 2009 by Noyce Foundation All rights reserved. 47 Marble Game Work the task and look at the rubric. What are the key mathematical ideas being assessed in this task?_______________________________________________________ What activities or experiences have students had with probability this year to help prepare them for the High School Exit Exam? How do you help students draw or define sample spaces? What models do they know? Look at student work on part 1. How many of your students put: 1/3 2/3 4/5 2/5 1/5 Red Other Make a list of models students used to figure out probability: • Organized list • Formula Now look at student work of part 2. How many students: • Knew the probability was 9/30 or 30%?__________ • Did not compare to the two probabilities?_________ • Thought that winning was unlikely (nonnumerical)?____________ • Thought there were less wins than losses?______________ • Thought the probability was 9/21 or 3/7?_____________ What are some of the big ideas about quantifying probability that your students did not understand? Now look at student work on part 3, finding the probability of the spinner. How many of your students thought • the spinner was better?________________ • the bag game was better?______________ • they were equal?_____________________ How many of your students did not attempt to quantify the probability for winning the spinner?_________________
  • 5. Grade 8 Copyright © 2009 by Noyce Foundation All rights reserved. 48 Looking at Student Work on Marble Game Student A is able to make an organized list to show the sample space in part 1 and quantify the probability. The student does not how to convert the frequency table into a probability but recognizes that the total is important to the fraction. The student is able to quantify the probability on the spinner and compare it correctly to the bag game. Student A
  • 6. Grade 8 Copyright © 2009 by Noyce Foundation All rights reserved. 49 Student B is able to get the correct probability, but from drawing the sample space incorrectly. What error has the student made? The student is able to calculate the experimental probability from the frequency table and understands that the denominators need to be the same to compare the two probabilities. However the student makes the wrong choice when comparing the two. The student has a complete explanation for part 3. Student B
  • 7. Grade 8 Copyright © 2009 by Noyce Foundation All rights reserved. 50 Student C is able to draw a complete sample space and identify the winning choices, the student even gives the numerical probability. The student does not see the importance of the numerical probability with the idea of likely, unlikely, and certain, etc. dominating the thinking. Notice that in part 2 the student doesn’t quantify the experimental probability. The student does give the correct numerical probability in part 3. Student C
  • 8. Grade 8 Copyright © 2009 by Noyce Foundation All rights reserved. 51 Student D is not very explanatory and relies on numbers. In part 1 the student thinks about a variety of choices, but lands on the correct probability. In part 2 the student quantifies the probability, but makes no attempt to compare the probabilities. In part 3 the student finds the numerical probability. Student D
  • 9. Grade 8 Copyright © 2009 by Noyce Foundation All rights reserved. 52 Student E is able to define the sample space and give a definition for finding probability. The student can’t turn the definition into a numerical expression. Instead the student quantifies the number of wins. In part 2 the student is also concerned with winning or losing rather than a numerical expression. The student subtracts wins from losses with the frequency table, rather than comparing the probability in 1 with the probability in 2. The student could find the numerical probability for the spinner. How do we help students to see the relevance for the numerical probability when their focus is on the importance of winning? What would make this important to them? Student E
  • 10. Grade 8 Copyright © 2009 by Noyce Foundation All rights reserved. 53 Student F gets the correct probability, but for the wrong reasons. The student seems to think about 2 bags, so 50% and 50% to get 100. Then the student divides by the 3 marbles in the first bag. The student does calculate correctly the experimental probability. In part 3 the student incorrectly counts the number of sections on the spinner. The student doesn’t combine the winning choices. Student F
  • 11. Grade 8 Copyright © 2009 by Noyce Foundation All rights reserved. 54 Student G is able to make a list for the sample space, but doesn’t know how to use it to write a correct probability. The student does not use the total in either part 1 or part 2. The student doesn’t understand how to set up the probability for the spinner, and instead seems to compare the reds from the two games. Student G
  • 12. Grade 8 Copyright © 2009 by Noyce Foundation All rights reserved. 55 Student H attempts to draw the sample space, but uses the first bag twice. The student seems to think that games should be fair, have a 50% chance of winning in part 2. The student is able to identify the winning spaces on the spinner, but then compares chances to chances rather than probability. Student H
  • 13. Grade 8 Copyright © 2009 by Noyce Foundation All rights reserved. 56 Student I identifies the winning combinations in part 1, but sets up the probability with total marbles instead of total possibilities. What experiences help students to understand the distinction between the two? In part 2 the student seems to compare the winning to not winning rather than set up a probability. In part 3 the student doesn’t quantify the fraction for winning on the spinner. Student I
  • 14. Grade 8 Copyright © 2009 by Noyce Foundation All rights reserved. 57 8th Grade Task 3 Marble Game Student Task Use probability in an everyday situation. Core Idea 2 Probability Apply and deepen understanding of theoretical and empirical probability. • Determine theoretical and experimental probabilities and use these to make predictions about events. • Represent probabilities as ratios, proportions, decimals or percents. • Represent the sample space for a given event in an organized way. Mathematics of this task: • Define a sample space for a game • Identify winning combinations • Express theoretical probability numerically • Convert data from a frequency table to an experimental probability • Compare probabilities by finding commonality (percents, common denominator) • Find simple probability for a spinner Based on teacher observation, this is what eighth graders know and are able to do: • Determine the game with the best probability of winning • Identify the probability on a spinner Areas of difficulty for eighth graders: • Understanding the difference between marbles and the total possibilities in setting up the probabilities • Defining a sample space for a compound event • Still thinking about likely/ unlikely or wining/losing instead of in terms of numerical probabilities • Comparing colors in the bag game and spinner instead of the probabilities • Using numbers to quantify the probability in the frequency table and spinner
  • 15. Grade 8 Copyright © 2009 by Noyce Foundation All rights reserved. 58 The maximum score available for this task is 7 points. The minimum score for a level 3 response, meeting standards, is 4 points. More than half the students, 60%, could identify the winning game. Some students, 28%, could also give the numerical probability for winning the spinner game. About 7% of the students could find the probability for winning the bag game (their reasoning may not have been correct). Less than 1% of the students could meet all the demands of the task including defining the sample space for the bag game and giving the theoretical and experimental probability and noticing that they were close in value. 40% of the students scored no points on this task. 92% of the students in the sample with this score attempted the task.
  • 16. Grade 8 Copyright © 2009 by Noyce Foundation All rights reserved. 59 Marble Game Points Understandings Misunderstandings 0 40% of the students in the sample got this score. 92% of them attempted the task. 18% of the students thought the chances of winning the bag game were better. 10% thought the chances were the same for both games. 20% made no attempt to quantify the probability on the spinner game. Some students subtracted winning outcomes (4- 2). 1 Students could select the game with the highest probability of winning. Students could not support their reasoning by quantifying the probability on the spinner. 2 Students could give the probability of winning on the spinner and knew it was a higher probability than the bag game. Students could not find the probability for winning the bag game. 8% thought the probability was 4/5. 8% thought the probability was 2/3. 8% thought the probability was 2/5. 3 Students could work with the spinner game and find the probability for the bag game. Students could not give convincing or correct justification for their probability. Many students arrived at a probability of 1/3 using incorrect logic. 4 Students could find the correct probability for the bag game with correct reasoning, give the correct probability for the spinner game, and compare the two values. Students could not write the experimental probability or compare it to the probability for the bag game. 13% used the word unlikely instead of giving a numerical value. 13% did not attempt this part of the task. 8% of the students compared winning to losing in the frequency table instead of comparing the frequency table to the theoretical probability in part 1. 7 Students could reason about a compound event, define the sample space, and write a probability. Students could convert a frequency table into an experimental probability. Students could compare probabilities by converting them to decimals, percents or fractions with common denominators. Students could give a probability for a simple event like a spinner.
  • 17. Grade 8 Copyright © 2009 by Noyce Foundation All rights reserved. 60 Implications for Instruction Students need more exposure to probability. While in elementary school, students learn about probability in terms of likelihood, in middles school students should start to make progress on quantifying probability. Students need to see the difference between odds (favorable outcomes to unfavorable outcomes) and probability (favorable outcomes to total possible outcomes). Before any of this can be determined, students need to be able to develop sample space. The spinner is easy because all of the spaces were equal size and could be added together. Students understand generally how to determine probability on a single number cube. They have trouble with compound events: rolling a die and then rolling a second die or spinning a spinner; drawing from two different bags. Students need to practice with strategies like making an organized list or drawing a tree diagram to help them develop all the possible outcomes. Some students still have trouble distinguishing between the actual objects used in the event (marbles in the bag) and the outcome of drawing the red marble. Some students need to understand that probability is the chance of something happening rather than winning. Many students were only focused on winning the game. Students need to think about the difference between theoretical probability and experimental probability. While many students could quantify the size of the experimental probability, there was little evidence about the difference between chance and expected values. Ideas for Action Research With 40% of the students scoring no points on this task, students need to do some serious work with the idea of probability. While this isn’t an eighth grade standard, it is tested on the High School Exit exam. Probability is also an interesting way to help students review ideas about fractions and decimals, making them feel like they are studying a new topic. Before trying to formalize the information, students just need to build up some experiential knowledge. They need lots of experiences with games of chance. Some interesting tasks can be found in Chance Encounters by Education Development Center, Inc. One group of activities involves describing probabilities as fractions, percents, decimals and ratios. It is called Designing Mystery Spinner Games. See a part of the activity on the next page. A different set of activities is to decide if games are Fair. See examples on following pages. A problem of the month on Fair Games is also available on the SVMI website: www.svmimac.org
  • 18. Grade 8 Copyright © 2009 by Noyce Foundation All rights reserved. 61 How does this activity press students to practice skills such as using fractions, decimals, and percentages? How does it help students use justification and mathematical reasoning?
  • 19. Grade 8 Copyright © 2009 by Noyce Foundation All rights reserved. 62
  • 20. Grade 8 Copyright © 2009 by Noyce Foundation All rights reserved. 63 In this game, students are asked to help Terry decide which is the better game to play. How does this help students practice basic skills? What strategies do you think students might use to rank the games?
  • 21. Grade 8 Copyright © 2009 by Noyce Foundation All rights reserved. 64
  • 22. © 2012 Noyce Foundation Performance Assessment Task Marble Game Grade 8 task aligns in part to CCSSM HS Statistics & Probability Task Description The task challenges a student to demonstrate an understanding of theoretical and empirical probability. A student must make sense of these probabilities and be able to represent the sample space for a given event in an organized manner. A student must be able to represent probabilities as ratios, proportions, decimals or percents. A student must determine and compare probabilities by finding commonality such as using percents or finding a common denominator. A student must determine the game with the best probability of winning. Common Core State Standards Math ‐ Content Standards High School – Statistics and Probability ­ Conditional Probability and the Rules of Probability Understand independence and conditional probability and use them to interpret data. S‐CP.1 Describe events as subsets of a sample space (the set of outcomes) using characteristics (or categories) of the outcomes, or as unions, intersections, or complements of other events (“or,” “and,” “not”). Common Core State Standards Math – Standards of Mathematical Practice MP.2 Reason abstractly and quantitatively. Mathematically proficient students make sense of quantities and their relationships in problem situations. They bring two complementary abilities to bear on problems involving quantitative relationships: the ability to decontextualize—to abstract a given situation and represent it symbolically and manipulate the representing symbols as if they have a life of their own, without necessarily attending to their referents—and the ability to contextualize, to pause as needed during the manipulation process in order to probe into the referents for the symbols involved. Quantitative reasoning entails habits of creating a coherent representation of the problem at hand; considering the units involved; attending to the meaning of quantities, not just how to compute them; and knowing and flexibly using different properties of operations and objects. MP.4 Model with mathematics. Mathematically proficient students can apply the mathematics they know to solve problems arising in everyday life, society, and the workplace. In early grades, this might be as simple as writing an addition equation to describe a situation. In middle grades, a student might apply proportional reasoning to plan a school event or analyze a problem in the community. By high school, a student might use geometry to solve a design problem or use a function to describe how one quantity of interest depends on another. Mathematically proficient students who can apply what they know are comfortable making assumptions and approximations to simplify a complicated situation, realizing that these may need revision later. They are able to identify important quantities in a practical situation and map their relationships using such tools as diagrams, two‐way tables, graphs, flowcharts and formulas. They can analyze those relationships mathematically to draw conclusions. They routinely interpret their mathematical results in the context of the situation and reflect on whether the results make sense, possibly improving the model if it has not served its purpose. Assessment Results This task was developed by the Mathematics Assessment Resource Service and administered as part of a national, normed math assessment. For comparison purposes, teachers may be interested in the results of the national assessment, including the total points possible for the task, the number of core points, and the percent of students that scored at standard on the task. Related materials, including the scoring rubric, student work, and discussions of student understandings and misconceptions on the task, are included in the task packet. Grade Level Year Total Points Core Points % At Standard 8 2009 7 4 8 %