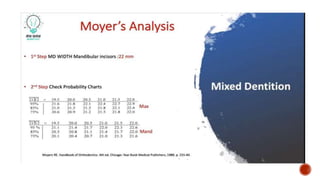
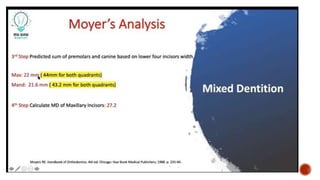
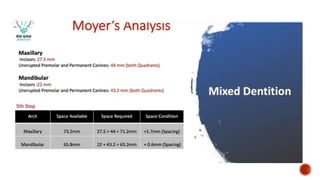
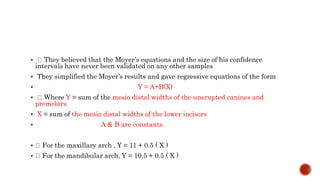
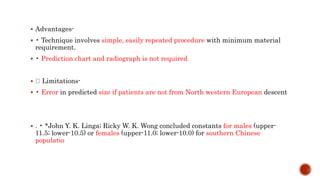
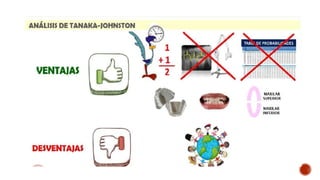
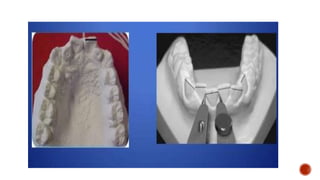
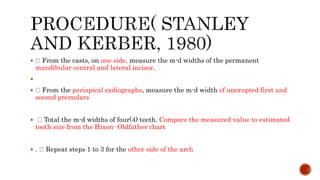
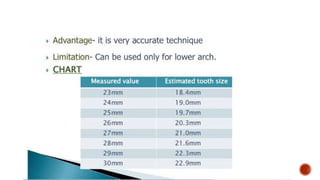
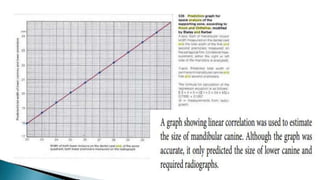
This document discusses various methods for analyzing dental casts and radiographs to predict the size of unerupted teeth during mixed dentition, including Moyer's analysis, Tanaka-Johnston analysis, Ballard-Wylie analysis, and the use of prediction charts combined with radiographs like the Hixon-Oldfather method. It provides details on the procedures, advantages, and limitations of each approach. Mixed dentition analysis is important for orthodontic diagnosis and treatment planning to determine if space needs to be maintained, gained, or if extractions will be required.
2. Model analysis is the study of dental casts, which helps to study the occlusion &
dentition from all three dimensions & analyze the degree & severity of
malocclusion , to derive the diagnosis & plan for treatment.
3. . They are three dimensional records of the patient’s dentition.
Occlusion can be visualized from the lingual aspect.
They provide a permanent record of the intermaxillary relationship.
Helps to motivate the patients,as they can visualized the treatment progress.
They are needed for comparison purposes at the end of treatment & act as a
reference for post treatment changes.
They serve as reminder for the parent & the patient of the condition present at
the start of treatment.
In case the patient has to be transferred to another clinician, study model are
an important record
4. Vertical skeletal jaw discrepancy can’t be ascertained from cast.
Dental cast simply provide an idea of the relative anteroposterior relationship of
the jaws to each other.
Wheather the maxilla is retrusive or protrusive can’t be ascertained from casts
i.e.anteroposterior status of jaw to skeletal craniofacial complex can’t be determined
from study cast.
Degree of labial/lingual inclination of incisors observed on cast can be misleading
because one tends to judge in relation to the artistic portion of the dental cast base
. Ref:-Jacobson A.,Jacobson R.L;Radiographic cephaometry from basics to 3-D
imaging.2nd ed;2-4
5. NON –RADIOGRAPHIC SPACE ANALYSES
Moyer’s
Tanaka Johnston
Ballard and Wylie
RADIOGRAPHIC ANALYSES
Nance’s
Huckaba’s
COMBINATION OF RADIOGRAPHS AND PREDICTION CHARTS
Hixon and Old father
Staley kerber
6. Prediction of the M-D widths of the unerupted canines and the premolars is an
essential part of the tooth size-arch length analysis during the mixed dentition
period.
Mixed dentition period
6-12 years
Indications- Nanda(1993)
a. Premature loss of primary canine.
b. Rotation or blocking of lateral incisor because of lack of space.
c. Ectopic eruption of permanent first molars.
d. Distal terminal plane relationships.
7. Basis- high co relation among groups of teeth , thus measuring one group of teeth,
prediction of size of other group of teeth can be done1.
Armamentarium-
1. Dental cast
2. Boley’s guage
3. Probability chart
8. Procedure:
1. Measure the widths of each of four permanent mandibular incisors .
2. Total the M-D widths of mandibular incisors
3. Using prediction chart for space available in mandibular arch,locate the value
closest to the sum of four mandibular incisor
3)On the study cast, determine and mark the midline of mandibular arch.
4)Total the M-D widths of right mand’ incisors & set the boley’s gauge to this
value. Measure from midline to right side. Place one point of the gauge at the
midline bet’n the central incisor and let the other end lie along the line of the
dental arch on the right side. Mark on the point where the precise point where
the distal tip of boley’s gauge touched. Repeat for the left side.
9. 5) Measure the dist betw the point marked on the cast to the mesial surface of
perm’ 1st molar.Record that value and calculate the difference
6) Repeat the process on the maxillary arch.
6)Compute the amt of space available. Measure the dist’ from the point marked
on the cast to mesial surface of the 1st molar, and calculate space difference
10.
11.
12.
13. . It is advocated for foll’ reasons:
Has minimal systemic errors and the range of such errors is known.
Can be done with equal reliability by the beginner and the expert as it does not
presume sophisticated clinical judgement.
Not time consuming, simple and easy to perform.
Requires no special equipment or radiographic projections.
It can be done with reasonable accuracy in the mouth although it is best done
on the dental casts.
It may be used for both the arches.
14. Advantages-
It has minimal error.
Can be done with equal reliability
Not time consuming
No special equipment required
Can be done in mouth as well as on cast
Can be used for both arches
Limitations
1. Moyer’s analysis is probability analysis
2. It does not account for tipping of mandibular incisor either lingually or facially
3. Maxillary tooth size is predicted by mandibular teeth
15. 4. Moyers advised caution in using any analysis, as none was able to compensate
for the biological variation in individuals during the transition from primary to
permanent dentition3.
5. Moyers equation does not mention the population group from which they were
calculated 13
6. Moyer’s method of prediction may have population variations. For one to be
sure of the accuracy while using Moyer’s method it may be safer to develop
prediction tables for specific populations. Thus Moyer’s method cannot universally
be applied12
16. 25. Armamentarium-
Boley guage
Study cast
The prediction of the size of the unerupted canines and the premolars in
contemporary orthodontic population can also be done with the Tanaka Johnston
analysis.
Tanaka and Johnston conducted a study on 506 orthodontic patients in Cleveland
17.
18. They believed that the Moyer’s equations and the size of his confidence
intervals have never been validated on any other samples
They simplified the Moyer’s results and gave regressive equations of the form
Y = A+B(X)
Where Y = sum of the mesio distal widths of the unerupted canines and
premolars
X = sum of the mesio distal widths of the lower incisors
A & B are constants.
For the maxillary arch , Y = 11 + 0.5 ( X )
For the mandibular arch, Y = 10.5 + 0.5 ( X )
19. Advantages-
• Technique involves simple, easily repeated procedure with minimum material
requirement.
• Prediction chart and radiograph is not required
Limitations-
• Error in predicted size if patients are not from North western European descent
. • *John Y. K. Linga; Ricky W. K. Wong concluded constants for males (upper-
11.5; lower-10.5) or females (upper-11.0; lower-10.0) for southern Chinese
populatio
20.
21.
22.
23. They concluded that
a) Both Tanaka Johnson and moyers have comparable standard errors of
estimate,thus their accuracy is fairly comparable.
b) Moyers chart at 50% confidence level gives more realistic estimate of width of
unerupted canine and premolars as compared to 75% confidence level for Marathi
population.
c) Sugessted the use of newly developed regression equations is suggested
24. Examine and compare the accuracy of the Moyers and Tanaka & Johnston mixed
dentition analyses and to evaluate its applicability to Indian Marathi population.
Developed regression analysis-
Y = a + b (X)
where , X= independent variable (mandibular incisors measurements)
Y = dependent variable (sum of canine and premolars).
For mandibular teeth- Y = 10.830 + 0.563 (X)
For maxillary teeth- Y = 12.143 + 0.481 (X)
25. Ballard and Wylie were so concerned about the distortions of the X- ray films that
they devised a scheme for estimating the widths of the mandibular canine and the
premolars on the basis of the combined widths of the four lower incisors.
Using the plaster models of 441 cases, they measured and recorded the widths
of all the mandibular teeth including the first molars.
On the average, the sum of the four permanent lower incisors were 23.84 +/-
0.08 mm.
The average sum of the canine,first and the second premolars turned out to be
21.97 +/- 0.06mm
26. Although not particularly high, the co-efficient of correlation of +0.64 seemed
sufficiently high to justify a predicton.
They modified the equation as Y = 9.41 + 0.527 ( X )
Testing these calculations on 60 cases , Ballard and Wylie came to a conclusion
that their method had only 2.6% error as compared to the 10.5% error when using
only the X-rays.
They do indicate that good X rays should be used and suggest that their
method was an adjunct to the Nance’s method
27. COMBINATION OF RADIOGRAPHS AND PREDICTION CHARTS
Hixon and Old father
Staley kerber
28. Iowa Facial Growth Study.
Staley and Kerber in a later study conducted at the Iowa, significantly reduced
the standard error of estimate when they generated a revised Hixon and
Oldfather prediction equation.
The co-efficient of correlation of the revised equation was significantly higher
than that of the original equation.
29. The original equation was primarily obtained from the measurements of the
teeth on the left side of the arch of each subject whereas the revised equation was
derived from the means of measurements taken from both right and left side teeth
in each subject.
Armamentarium-
• Boley guage
• Study cast
• Periapical radiograph
• Hixon- old father prediction chart
30. From the casts, on one side, measure the m-d widths of the permanent
mandibular central and lateral incisor.
From the periapical radiographs, measure the m-d width of unerupted first and
second premolars
Total the m-d widths of four(4) teeth. Compare the measured value to estimated
tooth size from the Hixon- Oldfather chart
. Repeat steps 1 to 3 for the other side of the arch
34. This analysis is similar to arch perimeter analysis of the permanent dentition
Armamentarium
Dental cast
Boley gauge, millimeter ruler
Peri-apical radiograph
35. SPACE REQUIRED:
◦ measure the mesio distal width of the erupted permanent teeth.
◦ Measure the width of each unerupted tooth, cuspids and bicuspids from the
IOPA.
◦ The total mesiodistal width of all the teeth in each quadrant will indicate space
required to accommodate the permanent teeth
36. SPACE AVAILABLE: ◦ using brass wire, measure the arch perimeter from the
mesial surface of permanent first molar to the mesial surface of the permanent
first molar on the other side.
◦ Compare the space required and space available to arrive at the arch length
discrepancy
37.
38. ADVANTAGES
It results in minimal errors
It can be performed with reliability
It allows analysis of both arches
LIMITATION
It is time consuming
Complete mouth radiograph is needed
39. Magnification power technique
This analysis makes use of a radiograph and study cast to determine the width of
unerupted teeth
Armamentarium
Dental cast
Boley gauge, millimeter ruler
Periapical radiograph
40. With any type of radiograph, it is necessary to compensate for enlargement of
radiographic image.
This can be done by measuring an object that can be seen both in the
radiograph and on the cast, such as primary molar tooth.
It is possible to determine the measurements of un- erupted teeth by studying
the teeth that have already erupted in a radiograph and on a cast
41.
42.
43. * Mixed dentition analysis forms an integral aspect of orthodontic diagnosis to
determine whether the treatment plan is going to involve serial extraction, space
maintenance, space gaining or simply periodic observation of the patient.