SlideShare a Scribd company logo
1Total System Value
The Mining Cost Cutting Cycle and Ways to Avoid the Traps
Summary
TSV Mining has often witnessed thatnot all cost cutting methods transfer well from site to site, and
some may have hidden traps that become detrimental to the longer term sustainability of a mine.
Background
As the mining industry tightens its belt due to costs exceeding cooling prices for many operations,
the cost cutting machine has kicked in yet again. Having been through this same Groundhog Day a
few times and seen the transitions from the overspending to the cost cutting phase of the cycle, we
have noticed several traps that mining operations can get caught by.
Working with clients whilst they were expanding during the boom time, we were able to
demonstrate the non-linear relationship between throughput expansions and costs. Contrary to
expectations of economies of scale, costs were actually going up exponentially with the increase in
production, not linearly. There were a number of well-publicised reasons for this, such as:
A requirement to move into high stripping ratio areas that could be avoided at lower levels
of production
Additional major capital purchases including processing plant upgrades and expansions
during a period of elevated capital costs
Higher freight costs as long term contracts were reset and where further production
increases required substantial below rail capital investment due to capacity constraints
being approached
Increasing supplier costs with the higher demand
However, there were also some less than obvious causes for the exponential increase in costs. Mine
plans that were being produced were becoming more and more aggressive as companies tried to
take maximum advantage of the boom. Creating a plan on paper was seen as the value that could be
achieved, disconnected from the real value in the pit. Operations were being stretched to a higher
intensity than had been seen before. On paper these plans looked to be quite achievable compared
2Total System Value
to previous productivity levels, but when implemented, they tended to perform poorly.
When we were part of expansion projects, a difficult element was making sure the plans were
actually achievable. The difficulty was not in getting the plans to work per se, but rather convincing
the business that a lot of the methods used to increase production were merelyincreasing the risk of
the plan, and such risks would have negative consequences well beyond the value being chased on
paper.
We once calculated the odds of a more bullish productivity assumption being used for a medium
term plan: the change in assumption would allow a saving of approximately $10 million in order to
curb the rising expansion costs through a reduction in contractor stripping requirements. The odds
of a successful outcome were very low; less than 5% based on statistical analysis of previous
stripping output. We demonstrated that the downside of the attempted saving if the contractor
stripping was not able to be replaced by improved owner-operator performance would be a loss in
revenue in the order of $50 million that year (and site policies made it nearly impossible to prevent).
So there was a $50 million bet being made in order to achieve a $10 million windfall – in gambler’s
parlance it was a bet paying $1.20 the win, with less than 5% chance of paying off!
Another major cause of unmet planned targets was the implementation of new policies. Some of
these policies were required to ensure the sustainability of the operation; however many were
implemented for an isolated process without any analysis on the impact it was having on the overall
production system. The cost to the operation from the policies was not measured or understood.
The price and the demand for resources still remains strong historically, leading to companies
maintaining high levels of production, but needing to combat the unprecedented jump in costs.
Capital investment for a lot of mining operations has already been spent, and there still remains a
requirement to maximise the financial return on these.
5 Hidden Cost Cutting Traps
Some organisations are seeing the obvious benefits of cost cutting; it is hard to argue against cuts
such as renegotiating contracts with contractors and suppliers that were agreed during a “hotter”
market. Reducing overheads in areas that don’t add any value to the actual production chain is also
a clear winning move in the current environment. Improvements that clearly demonstrate increased
production out of equipment that allows for reduced contractor input or the ability to shut excessive
3Total System Value
capacity is something that will pay off in any part of the cycle. However, there are always some
things to watch out for when looking for other cost cutting targets.
1. Watch out for the perceived benefits on paper
A short term cut can lead to long term devastation. As in the example of chasing the $10 million
saving earlier, there can be a large downside if it is not fully thought through and done properly. A
lack of understanding in risk or consequence contained in the mine plancan cause a false sense of
benefits being achieved. In our experience we have found the usual static, deterministic plans that
we are all use to, to be incapable of giving any information onrisk or consequences. Even the token
effort of completing a tornado plot at the end of the planning process really adds nothing to the
understanding because it is still based on a static plan, it doesn’t account for the interactions that
occur between production processes or show how the variability contained in the system effects
throughput.
Pressure on performance does not have to come from the mine plan directly; aspirational targets
can still be used as an operational incentive without the need to generate overly bullish numbers in
the base mine plan. Keeping the plan as close to reality as possible will ensure that all processes are
likely to be resourced “correctly” and sets a clear baseline.
If risk is to be increased in the plan, take risks that have high reward with minimal downside and
make allowance for that risk within the plan through discounting.
2. Are site inventories being reduced, making the site more vulnerable?
Just about all processes at an operation will have some form of inventory. In the production area
there can be:
Topsoil cleared
Drilled inventory
Blasted inventory (both waste and broken stocks)
Prestrip inventory
Coal/ore uncovered inventory
Pre-processing (raw coal/ore) inventory
4Total System Value
Product/concentrate inventory at site and in the logistics chain
If there is an ability to reduce these inventories (and yes, a consistent increase in performance of a
process which is stable both statistically and relative to plan, can allow for significant reduction in
these), this can be a successful cost reduction method through savings in working capital. However,
reducing inventories to reduce costs without addressing variation can lead to unwanted
consequences.
Inventories protect the system throughput and are critical in handling normal variability in output as
well as negative unplanned events (and all unplanned events are negative, when was the last
unplanned event in your production system that was a boost to the for throughput?). Events tend to
be unplanned as individuallythey are infrequent; however the likelihood of one or more of these
events occurring is almost certain in a year. Inventories enable an operation to handle these events
and sustain throughput. Any cost saving measure through reducing inventories should have a very
good handle on the variability of different processes and the potential for negative events to impact
the plan such as wet weather, major equipment failures, geotechnical incidents, or an error in
design.
Any operation will incur negativeunplanned eventsat least once a year. It is not economically viable
to significantly lower the chance of these events occurring.
3. Some changes will happen gradually and may be missed
We’ve all heard the boiling frog analogy; if you put a frog in boiling water it will leap out right away
to escape danger but if you gradually heat the water from a cool temperature, the frog will not
notice until it is too late.
The open cut mining environment tends not to detect change well because the production cycle is
much longer term compared to the manufacturing industry, resulting in gradual change that is not
easily noticeable. If the main key performance indicator tracked is final throughput, and only
minimal focus is put on leading indicators such as inventories (and not just final product inventory),
then there may be no warning that a process is about to become a constraint for the
system.Inventories will always go up and down as they smooth out the inevitable fluctuations in the
system; it is what they are there for. What they should not do is continue downwards, unplanned,
for an extended period of time. When this occurs, a new process will eventually start to hold up the
5Total System Value
system. At first the occasional hold up will occur, gradually increasing until it becomes a constant
issue. If inventories have decreased in a number of processes, the situation may become even worse
with the constraint floating across the system, making it even harder to find where best to apply
limited resources to remove the constraint and lift overall throughput and a production system that
is impossible to get under control because of its unpredictability.
Changes to constraints will not happen overnight. Observing unplanned, consistently dropping
inventory is a lead indicator that the current production is unsustainable with the current application
of resources.
4. Processes in the operation previously considered minor and therefore unscheduled have
become more crucial and are very sensitive to resource changes
With the higher intensity being included in mine plans, potential issues can be missed. One major
issue we have seen at mining operations (and it is becoming more and more common) is that some
processes are no longer needing to be resourced based on the size of the combined tasks over time,
but rather the time that will be available for the process to be performed for each individual task. As
production increases in the same footprint, the time available for supporting tasks such as drill prep,
drilling, blasting, etc actually reduces exponentially, not linearly (if you don’t believe this, picture a
single digging unit that moves across four dig areas; now consider two diggers over the same four
dig areas and compare the amount of time that a digger is away from an area to allow time for
support activities: production doubles but time for support activities reduces by two-thirds, not by
half). This can cause untracked and unscheduled processes to become constraints with very little
warning. It is only obvious when the schedule is run with production targets aligned with actual
performance and with all processes that consume time in the operation being scheduled, no matter
how minor they might have previously seemed. These supporting tasks may need substantial sprint
capacity (anathema to the cost cutting drive) if they are to complete tasks within the time available
and maintain plan stability.
Supporting taskscan stop throughput just as easily as major production tasks, however it is relatively
cheap to prevent. At most operations they can actually be responsible for some of the lowest
marginal cost throughput on site.
6Total System Value
5. Using utilisation to understand resource requirements can be dangerous
There may be a poor relationship between process utilisation and resourcing requirements.
Utilisation works well as a short term indicator when working on a task; however it can be a poor
method for calculating long term resourcing requirements. This is the case when tasks need to be
completed in a narrow period of time and there is standby time between these task windows.
Generally this is the case for most minor tasks on site, such as small excavation tasks, drilling
preparation, drilling, grade control, blasting and pumping.
A simple method of demonstrating the potential size of delays when long term demand is used
rather than focusing on short term peak loads is to use Queueing Theory, first developed by Agner
Erlang.
Let’s use an example of a blast crew:
As other processes release jobs they become flagged for the blast crew to complete. When
resourcing a blast crew based on the overall tonnages they are required to complete over a
sustained period (such as a budget year), the assumption is made that they can level the tasks – ie.
as long as their capacity is higher than the overall requirements, then the blast crew should not hold
up any process.
If we assume that on average two blasts a week are released with an average 400t per blast, and the
blast crew has a loading capacity of 1,000t per week including two tie and fires a week. What will
this look like?
Case A: D/D/1 (deterministic task arrival / deterministic task service / 1 blast crew)
Average blasting requirement = 400t
Average blasting task released = 2 per week (or arrival rate of 0.286 blasts per day)
Blast crew capacity = 1,000t / week (or a service rate of 0.357 blasts per day)
Blast crew capacity utilisation = 80%
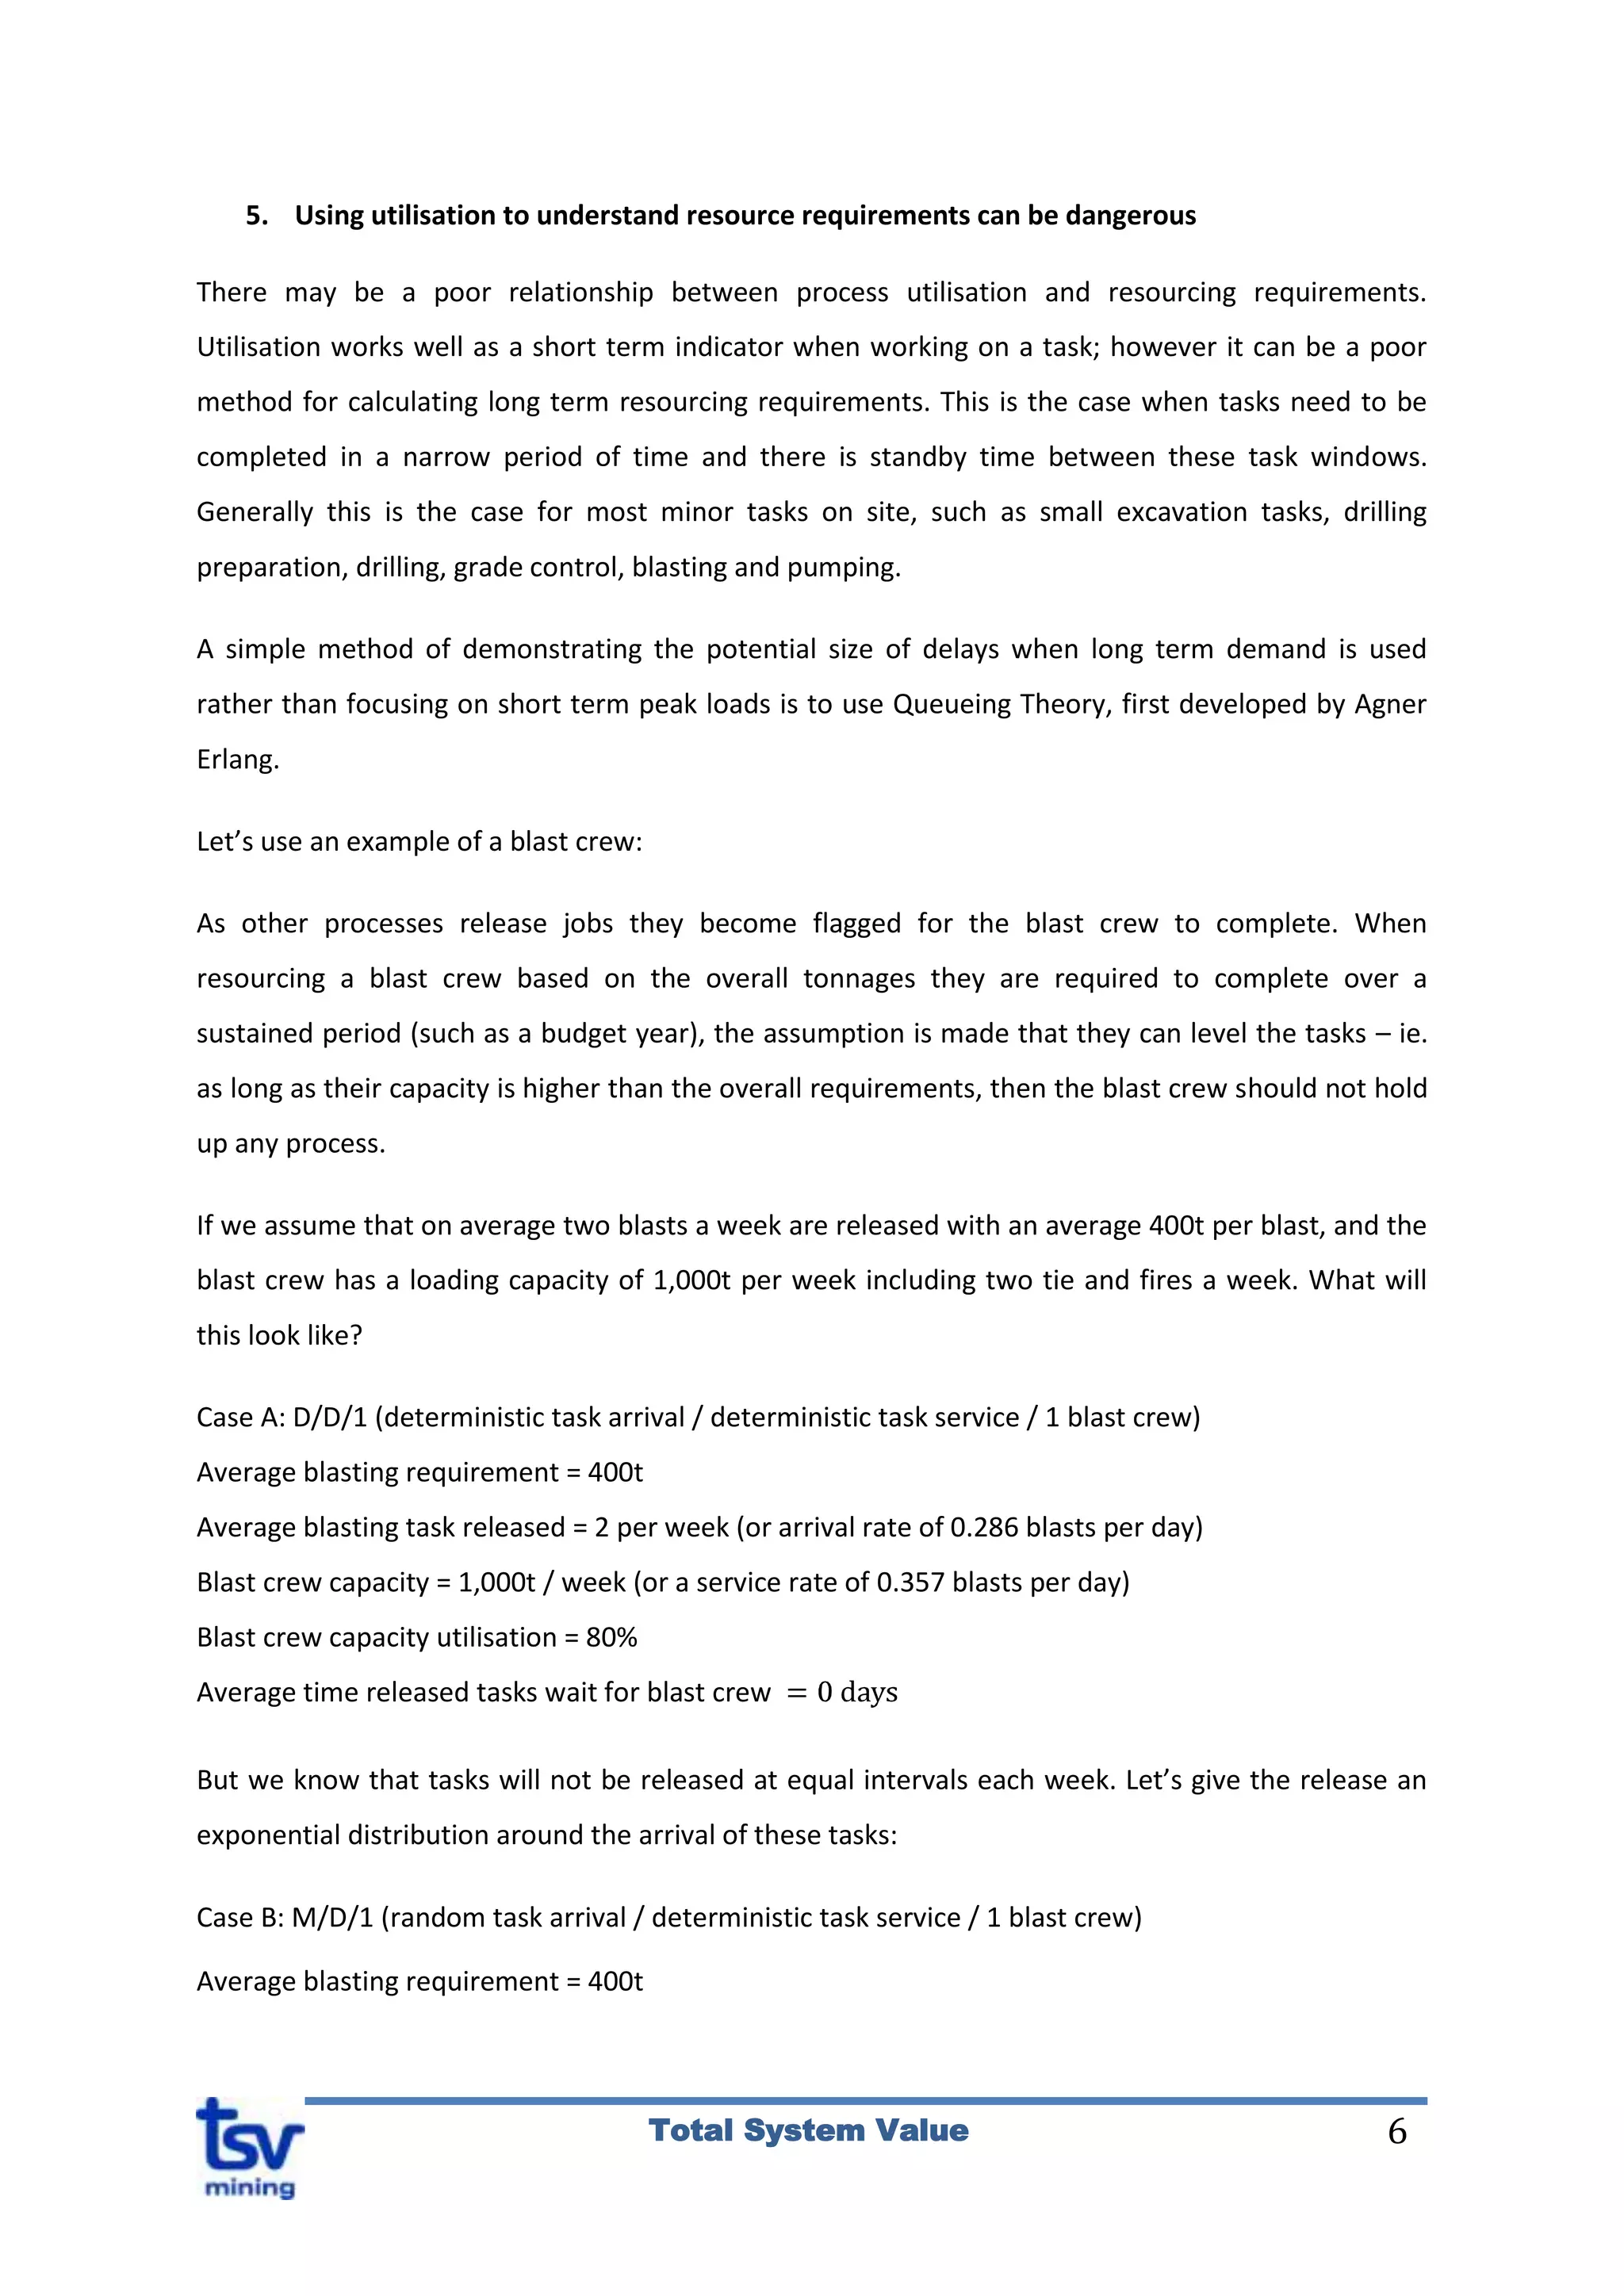
Average time released tasks wait for blast crew
But we know that tasks will not be released at equal intervals each week. Let’s give the release an
exponential distribution around the arrival of these tasks:
Case B: M/D/1 (random task arrival / deterministic task service / 1 blast crew)
Average blasting requirement = 400t
7Total System Value
Average blasting task released = 2 per week (or arrival rate of 0.286 per day, on average but random)
Blast crew capacity = 1,000t / week (or a service rate of 0.357 per day)
Blast crew capacity utilisation = 80%
Average time released tasks wait for blast crew
So blasting tasks on average are now waiting 5.6 days on average before the blast crew will get
around to them.
Next, let’s give the blasting process a distribution. Both the blast crews and the size of the tasks will
have a distribution, for simplicity we will use a normal distribution around the service rate of the
blast crew.
Case C: M/G/1 (random task arrival / random task service / 1 blast crew)
Average blasting requirement = 400t
Average blasting task released = 2 per week (or arrival rate of 0.286 per day, on average but random)
Blast crew capacity = 1,000t / week (or a service rate of 0.357 per day, on average but random)
Blast crew capacity utilisation = 80%
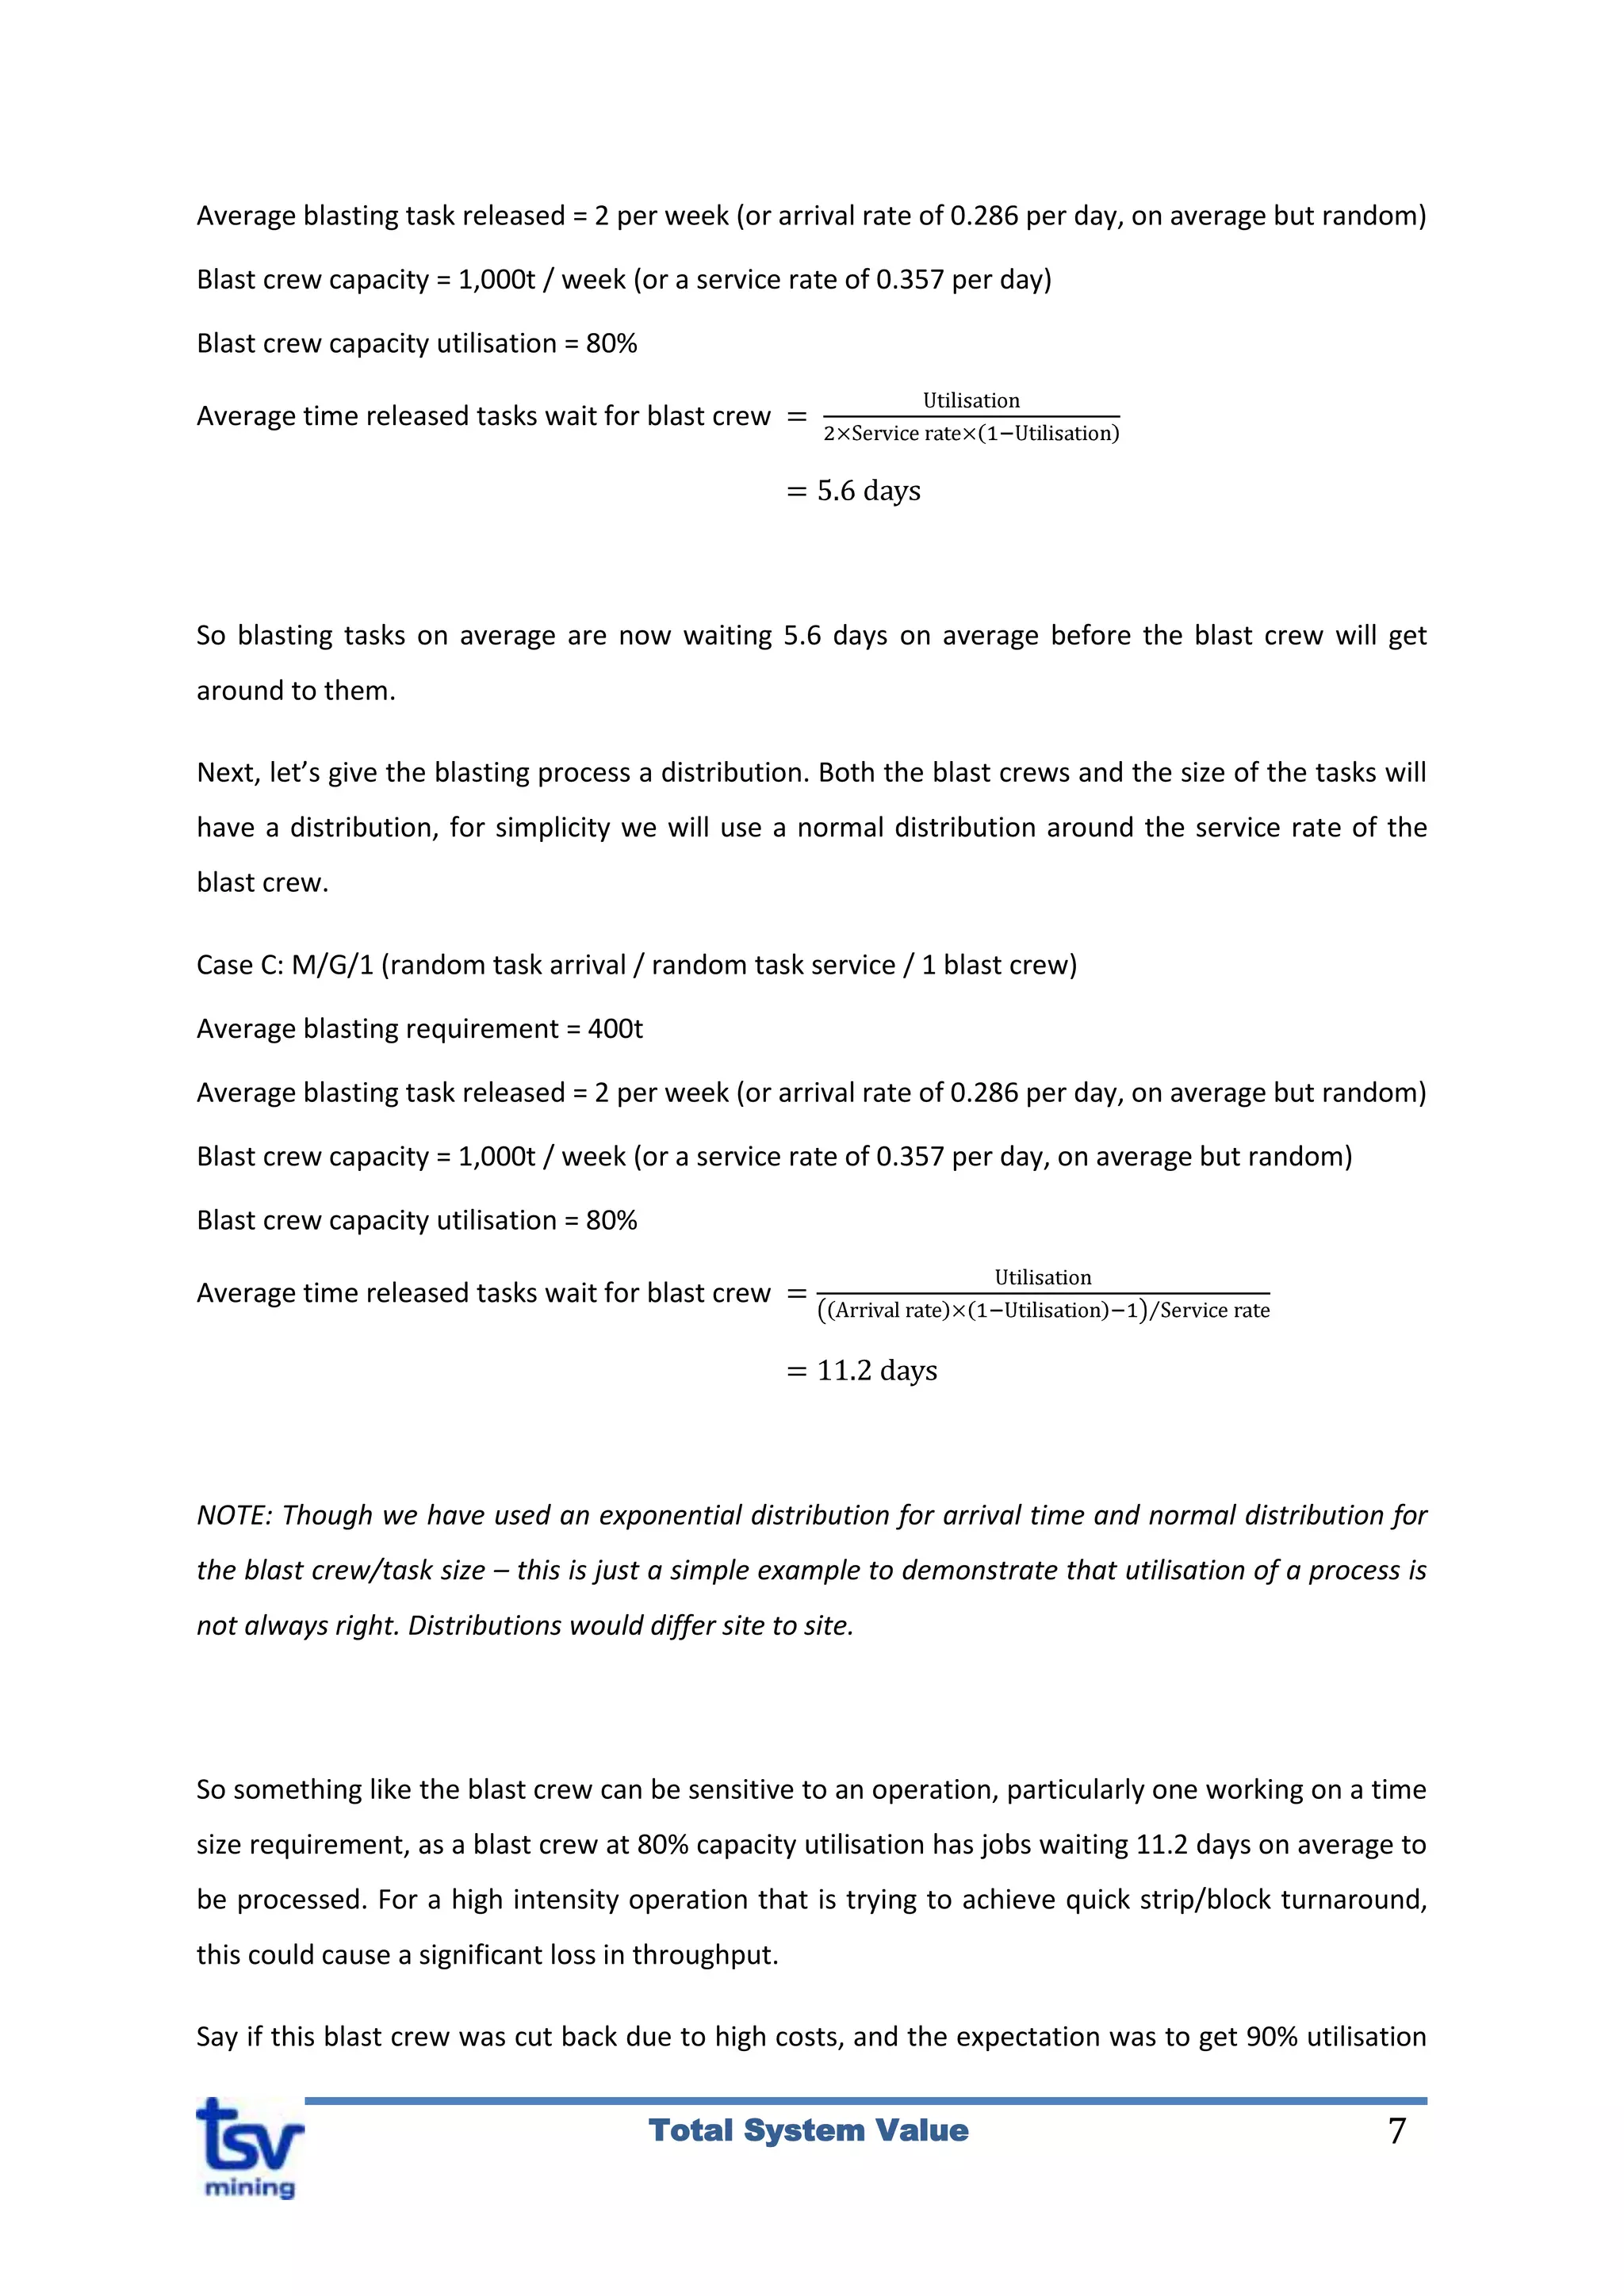
Average time released tasks wait for blast crew
NOTE: Though we have used an exponential distribution for arrival time and normal distribution for
the blast crew/task size – this is just a simple example to demonstrate that utilisation of a process is
not always right. Distributions would differ site to site.
So something like the blast crew can be sensitive to an operation, particularly one working on a time
size requirement, as a blast crew at 80% capacity utilisation has jobs waiting 11.2 days on average to
be processed. For a high intensity operation that is trying to achieve quick strip/block turnaround,
this could cause a significant loss in throughput.
Say if this blast crew was cut back due to high costs, and the expectation was to get 90% utilisation
8Total System Value
from the remaining crew. In this case using the same calculations as previous, the average wait time
for a blast will end up being 28.4 days, not much of a saving, but a potential large loss in throughput
and revenue.
The blast delay here is just an average. During peak blast demand times the wait could be
substantially higher. It is easy to see how these delays could affect throughput if the blast window is
narrow, severely affecting downstream processes such as stripping. In order to correctly resource all
processes in the operation, all time consuming activities must be scheduled dynamically.
5 Sustainable Solutions when Cost Cutting
There are numerous methods to cutting costs that are sustainable, such as:
Renegotiating contract rates to a lower price
Removing non-value adding activities and resources
Delaying expansion projects
Increasing process productivity
However we thought we would give some different solutions rather the more traditional ones:
1. Check policies and improvements for individual processes and see if they truly benefit the
system
Localised improvements for a process can quite often be to the detriment of the system. If the value
is only measured at the process without analysing upstream and downstream processes, it may not
be aligned with the revenue of the operation. Operating standards/requirements also tend to
accumulate over time.
An example of this is a localised improvement that reduces the number of trucks needed to haul coal
by breaking up the long hauls into shorter segments, thereby reducing the peak loads of haulage.
This could result in a saving of $5 million per year. However, undertaking a system-wide approach to
improvements would reveal that more coal rehandling increases fines generation, creating an
overload in the fines circuit of the CHPP and dropping the coal yield from these areas by 8%,
reducing revenue by $17 million per year. In addition to the loss in coal produced, there could be
other downstream issues, such as reducing handleability in the logistics chain or client concerns with
9Total System Value
the increased fines.
All process improvements and policy changes should undertake a system-wide analysis to ensure
that all unintended consequences are found and examined.
2. Look at opportunities to reduce the variation in the processes
At TSV Mining we analyse six main sources of variation that are typically found within the
commodity value chain of the open cut mining environment. Reducing variation in the system is
always possible. Interrelationships between variation sources have exponential effects on any
operation. Some reduction can be relatively cheap and provides for the sustainable cost reduction in
many areas through a reduction in the required sprint capacity or the inventory.
Some examples of reduction in system variation include:
Normalising the length of stripping circuits by planning hauls and dump locations more
thoroughly, ensuring that the operation is hauling “long dirt” to the short dumps and “short
dirt” to the long dumps
Improving grade control practices
Upskilling of frontline supervision to a consistent standard
Improving water management capacity to reduce the effects of future weather events
Balancing block sizes so that coal/ore is released on a more consistent basis
Improving quality control in the processing area so that penalty components are closer to
the customer specification while still not getting penalised
Understanding the sources of variation and how the systems reacts to changing variation is one of
the largest opportunities to reducing costs in most operations.
3. Look at getting the right inventories in the right locations
There is a huge amount of working capital tied up in inventories. Getting inventory levels and
locations right ensures the system throughput, but getting them wrong is simply tying up working
capital or reducing the potential throughput of the operation. Often when working with clients we
find that risk mitigation strategies have inventories in low value locations (usually because these are
the areas where inventory can be held more easily, regardless of whether it adds value), when
10Total System Value
alternative locations can reduce costs significantly and improve the risk mitigation.
It is not just overall quantities of inventories that need to be monitored; the right quantities must be
in theright locationsin order to be cost effective.
4. Customise the cost reduction for each operation
Anchoring is a cognitive bias that affects us all, where we tend to overly focus on what has worked
previously, both in our personal experience and what we have seen work for others. However, no
two operations are the same, and taking a solution from one operation to another may have a
detrimental effect if it isn’t considered whether the reasons for the solution working elsewhere are
still applicable in the new environment.
Operations can have a sustainable cut in costs in the right areas. But assuming that all sites are the
same, and using the same technique across the board can be fraught with danger and actually cause
costs to increase in certain situations.
Process improvement resources are always in scarce supply, no more so than in the current
environment. Therefore it is crucial that a “boil the ocean” approach is not taken. Time should be
taken to identify the constraining process that is holding back overall throughput and then
commitment made to not make cuts in this area. All process improvement resources should then be
targeted at the one constraining process with a laser-like focus.
Cost-cutting can then be applied in other areas where there is excessive capacity (be sure to
understand what excessive is), with a scalpel, not a broad brush. However, each cut should consider
the effect on the rest of the operation. Decisions should be made considering the operation as a
complete system, not as a group of siloed processes.
Targeting areas to cut costs where they will not impact throughput is of high importance, and may
not be where you would like to cut. We have seen damaging cuts made to the productive capacity of
a process that was the main capacity constraint of an operation just because 50% of the site’s costs
were in that process.
Always customise the cost cutting for each operation as small differences between two operations
can cause big changes in where the focal areas need to be to improve throughput and reduce costs.
11Total System Value
5. Look at incremental, not overall process costs
When there are multiple processes required to move material, with cost analysis changing the
process from one to the next, the costs need to be analysed on anincremental basis. Whether it is
moving from dozer push to excavator, increasing cast, choosing the dragline horizon with prestrip, or
adding equipment to an excavator circuit, overall process costs will not give a clear picture.
As with most things discussed here, incremental costs are not linear; they again go up exponentially
as productivity deteriorates exponentially: raising the dragline horizon will go through larger step
changes in rehandle (increasing rehandle exponentially), dozer push productivity will decrease with
longer and steeper uphill pushes (productivity deteriorating exponentially), the benefits from
increasing powder factor to achieve a higher cast or improve diggability will decay exponentially,
adding more trucks to a circuit will have a exponentially decaying benefit in additional throughput.
Overall process costs hide exponential cost increases.
Bringing it all together
Short term cost reduction benefits can have many hidden traps. There are many aspects of an
operation where sustainable cost reduction can be undertaken. In this paper there are several
underlying themes:
Always look at how the system is reacting to change, not just the individual processes
Inventories will hide potential throughput issues for a period of time.
Any inventory contained within the system that constantly deteriorates is a lead indicator
that current production levels with current application of resources is unsustainable
Most elements in mining do not change in a linear fashion, they tend to change
exponentially
Traditional methods of measuring resource requirements may no longer work
Keeping these themes in mind when looking for opportunities to cut costs and increase throughput
will have you well-armed in avoiding many of the traps and pitfalls we have mentioned here.
TSV Mining has many years of applying systems thinking principles to the open cut mining industry
using simulation modelling and statistical analysis, amongst other techniques. If you would like to
discuss how these or dozens of other methods could be applied at your site to improve cash flow,
please contact cbraund@tsvmining.com.auor visit our website at www.tsvmining.com.au
12Total System Value

More Related Content

Viewers also liked

TSV Mining: Variation outside of planning, contingency, inventory and intensity
TSV Mining: Variation outside of planning, contingency, inventory and intensityTSV Mining: Variation outside of planning, contingency, inventory and intensity
TSV Mining: Variation outside of planning, contingency, inventory and intensity
Totius Mining
 
Cara daftar Forex di FBS.com
Cara daftar Forex di FBS.comCara daftar Forex di FBS.com
Cara daftar Forex di FBS.com
manganebook
 
A fully packaged geek is all you need to be truly agile!
A fully packaged geek is all you need to be truly agile!A fully packaged geek is all you need to be truly agile!
A fully packaged geek is all you need to be truly agile!
Gayathri N
 
TSV Mining: Variation Analysis in Mining Part 1 - Precision and Accuracy
TSV Mining: Variation Analysis in Mining Part 1 - Precision and AccuracyTSV Mining: Variation Analysis in Mining Part 1 - Precision and Accuracy
TSV Mining: Variation Analysis in Mining Part 1 - Precision and Accuracy
Totius Mining
 
CV Faizan 17.12.16
CV Faizan 17.12.16CV Faizan 17.12.16
CV Faizan 17.12.16
Faizan Ahmed Khan
 
Equipment 'Time Away Theory' in the opencut coal mining industry
Equipment 'Time Away Theory' in the opencut coal mining industryEquipment 'Time Away Theory' in the opencut coal mining industry
Equipment 'Time Away Theory' in the opencut coal mining industry
Totius Mining
 
Tutorial fbs meta trader4
Tutorial fbs meta trader4Tutorial fbs meta trader4
Tutorial fbs meta trader4manganebook
 
The Future of Technology in 2023 A.D.
The Future of Technology in 2023 A.D.The Future of Technology in 2023 A.D.
The Future of Technology in 2023 A.D.
emlabarb
 
Escuelas y precursores
Escuelas y precursoresEscuelas y precursores
Escuelas y precursores
abelunid
 
Swimming pool equipments
Swimming pool equipmentsSwimming pool equipments
Swimming pool equipments
aqua-me
 
TSV Mining: Overburden fleet analysis, overstating benefits and statistical i...
TSV Mining: Overburden fleet analysis, overstating benefits and statistical i...TSV Mining: Overburden fleet analysis, overstating benefits and statistical i...
TSV Mining: Overburden fleet analysis, overstating benefits and statistical i...
Totius Mining
 
Grupo m.01 andreu,bori,sedes el ray
Grupo m.01 andreu,bori,sedes el rayGrupo m.01 andreu,bori,sedes el ray
Grupo m.01 andreu,bori,sedes el ray
sole_andrew
 
Marketing and social media campaigns. (Old Spice)
Marketing and social media campaigns. (Old Spice)Marketing and social media campaigns. (Old Spice)
Marketing and social media campaigns. (Old Spice)
Utsav Ojha
 
TSV Mining: Critical density in mining and changes to sustainable low cost pr...
TSV Mining: Critical density in mining and changes to sustainable low cost pr...TSV Mining: Critical density in mining and changes to sustainable low cost pr...
TSV Mining: Critical density in mining and changes to sustainable low cost pr...
Totius Mining
 
Green technology
Green technologyGreen technology
Green technology
AMIT KUMAR
 
Industrial visit to samsonite, Nashik
Industrial visit to samsonite, NashikIndustrial visit to samsonite, Nashik
Industrial visit to samsonite, Nashik
AMIT KUMAR
 
Whirlpool
WhirlpoolWhirlpool
Whirlpool
AMIT KUMAR
 
Handwritten character recognition using artificial neural network
Handwritten character recognition using artificial neural networkHandwritten character recognition using artificial neural network
Handwritten character recognition using artificial neural network
Harshana Madusanka Jayamaha
 
SIRIUSの教科書サンプル
SIRIUSの教科書サンプルSIRIUSの教科書サンプル
SIRIUSの教科書サンプル
ydnvn
 
Momotarou
MomotarouMomotarou
Momotarouydnvn
 

Viewers also liked (20)

TSV Mining: Variation outside of planning, contingency, inventory and intensity
TSV Mining: Variation outside of planning, contingency, inventory and intensityTSV Mining: Variation outside of planning, contingency, inventory and intensity
TSV Mining: Variation outside of planning, contingency, inventory and intensity
 
Cara daftar Forex di FBS.com
Cara daftar Forex di FBS.comCara daftar Forex di FBS.com
Cara daftar Forex di FBS.com
 
A fully packaged geek is all you need to be truly agile!
A fully packaged geek is all you need to be truly agile!A fully packaged geek is all you need to be truly agile!
A fully packaged geek is all you need to be truly agile!
 
TSV Mining: Variation Analysis in Mining Part 1 - Precision and Accuracy
TSV Mining: Variation Analysis in Mining Part 1 - Precision and AccuracyTSV Mining: Variation Analysis in Mining Part 1 - Precision and Accuracy
TSV Mining: Variation Analysis in Mining Part 1 - Precision and Accuracy
 
CV Faizan 17.12.16
CV Faizan 17.12.16CV Faizan 17.12.16
CV Faizan 17.12.16
 
Equipment 'Time Away Theory' in the opencut coal mining industry
Equipment 'Time Away Theory' in the opencut coal mining industryEquipment 'Time Away Theory' in the opencut coal mining industry
Equipment 'Time Away Theory' in the opencut coal mining industry
 
Tutorial fbs meta trader4
Tutorial fbs meta trader4Tutorial fbs meta trader4
Tutorial fbs meta trader4
 
The Future of Technology in 2023 A.D.
The Future of Technology in 2023 A.D.The Future of Technology in 2023 A.D.
The Future of Technology in 2023 A.D.
 
Escuelas y precursores
Escuelas y precursoresEscuelas y precursores
Escuelas y precursores
 
Swimming pool equipments
Swimming pool equipmentsSwimming pool equipments
Swimming pool equipments
 
TSV Mining: Overburden fleet analysis, overstating benefits and statistical i...
TSV Mining: Overburden fleet analysis, overstating benefits and statistical i...TSV Mining: Overburden fleet analysis, overstating benefits and statistical i...
TSV Mining: Overburden fleet analysis, overstating benefits and statistical i...
 
Grupo m.01 andreu,bori,sedes el ray
Grupo m.01 andreu,bori,sedes el rayGrupo m.01 andreu,bori,sedes el ray
Grupo m.01 andreu,bori,sedes el ray
 
Marketing and social media campaigns. (Old Spice)
Marketing and social media campaigns. (Old Spice)Marketing and social media campaigns. (Old Spice)
Marketing and social media campaigns. (Old Spice)
 
TSV Mining: Critical density in mining and changes to sustainable low cost pr...
TSV Mining: Critical density in mining and changes to sustainable low cost pr...TSV Mining: Critical density in mining and changes to sustainable low cost pr...
TSV Mining: Critical density in mining and changes to sustainable low cost pr...
 
Green technology
Green technologyGreen technology
Green technology
 
Industrial visit to samsonite, Nashik
Industrial visit to samsonite, NashikIndustrial visit to samsonite, Nashik
Industrial visit to samsonite, Nashik
 
Whirlpool
WhirlpoolWhirlpool
Whirlpool
 
Handwritten character recognition using artificial neural network
Handwritten character recognition using artificial neural networkHandwritten character recognition using artificial neural network
Handwritten character recognition using artificial neural network
 
SIRIUSの教科書サンプル
SIRIUSの教科書サンプルSIRIUSの教科書サンプル
SIRIUSの教科書サンプル
 
Momotarou
MomotarouMomotarou
Momotarou
 

Similar to Mining Cost Cutting Cycle and the ways to Avoid the Traps

industrial microbial culture (1).pdf
industrial microbial culture (1).pdfindustrial microbial culture (1).pdf
industrial microbial culture (1).pdf
RupajitBhattacharjee1
 
Viziya
ViziyaViziya
WhyInvestPROCESSCONTROL
WhyInvestPROCESSCONTROLWhyInvestPROCESSCONTROL
WhyInvestPROCESSCONTROL
Pierre Latour
 
Impact of Planning Decision Support Tools on Mining Operations Profitability
Impact of Planning Decision Support Tools on Mining Operations ProfitabilityImpact of Planning Decision Support Tools on Mining Operations Profitability
Impact of Planning Decision Support Tools on Mining Operations Profitability
Schneider Electric
 
Sliding Oil Prices: Predicament or Prospect
Sliding Oil Prices: Predicament or ProspectSliding Oil Prices: Predicament or Prospect
Sliding Oil Prices: Predicament or Prospect
Cognizant
 
Decision Making For Higher Profitability in Mining Sector
Decision Making For Higher Profitability in Mining SectorDecision Making For Higher Profitability in Mining Sector
Decision Making For Higher Profitability in Mining Sector
onassignmenthelp
 
The Principles of product development flow - a summary
The Principles of product development flow - a summary The Principles of product development flow - a summary
The Principles of product development flow - a summary
Sebastian Kamilli
 
Capacity planning chapter 8
Capacity planning chapter 8Capacity planning chapter 8
Capacity planning chapter 8
Yonela Gaba
 
Managing Assets for Maximum Performance and Value
Managing Assets for Maximum Performance and ValueManaging Assets for Maximum Performance and Value
Managing Assets for Maximum Performance and Value
EMC
 
Viziya
ViziyaViziya
Manufacturing Europe
Manufacturing EuropeManufacturing Europe
Manufacturing Europe
Linda Middleton-Jones
 
PoV - Navigating the Crude Cycle 2015 vF
PoV - Navigating the Crude Cycle 2015 vFPoV - Navigating the Crude Cycle 2015 vF
PoV - Navigating the Crude Cycle 2015 vF
Edwin A. van der Stam
 
JR Dickens - IWCS 2007
JR Dickens - IWCS 2007JR Dickens - IWCS 2007
JR Dickens - IWCS 2007
jrd9234
 
Factory-Whitepaper-Sustainability-Aptean-Weisman
Factory-Whitepaper-Sustainability-Aptean-WeismanFactory-Whitepaper-Sustainability-Aptean-Weisman
Factory-Whitepaper-Sustainability-Aptean-Weisman
Robyn Weisman
 
Australian mining magazine turning mining performance around
Australian mining magazine  turning mining performance aroundAustralian mining magazine  turning mining performance around
Australian mining magazine turning mining performance around
Hendrik Lourens
 
Europec 2016 - Chris Hopper - SPE 180176-MS
Europec 2016 - Chris Hopper - SPE 180176-MSEuropec 2016 - Chris Hopper - SPE 180176-MS
Europec 2016 - Chris Hopper - SPE 180176-MS
Chris Hopper
 
Limits+of+the+learning+curve
Limits+of+the+learning+curveLimits+of+the+learning+curve
Limits+of+the+learning+curve
reagan22
 
Testing in Financial Services - Leveraging Process Maps
Testing in Financial Services - Leveraging Process MapsTesting in Financial Services - Leveraging Process Maps
Testing in Financial Services - Leveraging Process Maps
ITC Infotech
 
Cost System Tuning in Today's Economy
Cost System Tuning in Today's EconomyCost System Tuning in Today's Economy
Cost System Tuning in Today's Economy
qcllc
 
GEA32876 Offshore_Study_Paper_R11
GEA32876 Offshore_Study_Paper_R11GEA32876 Offshore_Study_Paper_R11
GEA32876 Offshore_Study_Paper_R11
Jane Howell
 

Similar to Mining Cost Cutting Cycle and the ways to Avoid the Traps (20)

industrial microbial culture (1).pdf
industrial microbial culture (1).pdfindustrial microbial culture (1).pdf
industrial microbial culture (1).pdf
 
Viziya
ViziyaViziya
Viziya
 
WhyInvestPROCESSCONTROL
WhyInvestPROCESSCONTROLWhyInvestPROCESSCONTROL
WhyInvestPROCESSCONTROL
 
Impact of Planning Decision Support Tools on Mining Operations Profitability
Impact of Planning Decision Support Tools on Mining Operations ProfitabilityImpact of Planning Decision Support Tools on Mining Operations Profitability
Impact of Planning Decision Support Tools on Mining Operations Profitability
 
Sliding Oil Prices: Predicament or Prospect
Sliding Oil Prices: Predicament or ProspectSliding Oil Prices: Predicament or Prospect
Sliding Oil Prices: Predicament or Prospect
 
Decision Making For Higher Profitability in Mining Sector
Decision Making For Higher Profitability in Mining SectorDecision Making For Higher Profitability in Mining Sector
Decision Making For Higher Profitability in Mining Sector
 
The Principles of product development flow - a summary
The Principles of product development flow - a summary The Principles of product development flow - a summary
The Principles of product development flow - a summary
 
Capacity planning chapter 8
Capacity planning chapter 8Capacity planning chapter 8
Capacity planning chapter 8
 
Managing Assets for Maximum Performance and Value
Managing Assets for Maximum Performance and ValueManaging Assets for Maximum Performance and Value
Managing Assets for Maximum Performance and Value
 
Viziya
ViziyaViziya
Viziya
 
Manufacturing Europe
Manufacturing EuropeManufacturing Europe
Manufacturing Europe
 
PoV - Navigating the Crude Cycle 2015 vF
PoV - Navigating the Crude Cycle 2015 vFPoV - Navigating the Crude Cycle 2015 vF
PoV - Navigating the Crude Cycle 2015 vF
 
JR Dickens - IWCS 2007
JR Dickens - IWCS 2007JR Dickens - IWCS 2007
JR Dickens - IWCS 2007
 
Factory-Whitepaper-Sustainability-Aptean-Weisman
Factory-Whitepaper-Sustainability-Aptean-WeismanFactory-Whitepaper-Sustainability-Aptean-Weisman
Factory-Whitepaper-Sustainability-Aptean-Weisman
 
Australian mining magazine turning mining performance around
Australian mining magazine  turning mining performance aroundAustralian mining magazine  turning mining performance around
Australian mining magazine turning mining performance around
 
Europec 2016 - Chris Hopper - SPE 180176-MS
Europec 2016 - Chris Hopper - SPE 180176-MSEuropec 2016 - Chris Hopper - SPE 180176-MS
Europec 2016 - Chris Hopper - SPE 180176-MS
 
Limits+of+the+learning+curve
Limits+of+the+learning+curveLimits+of+the+learning+curve
Limits+of+the+learning+curve
 
Testing in Financial Services - Leveraging Process Maps
Testing in Financial Services - Leveraging Process MapsTesting in Financial Services - Leveraging Process Maps
Testing in Financial Services - Leveraging Process Maps
 
Cost System Tuning in Today's Economy
Cost System Tuning in Today's EconomyCost System Tuning in Today's Economy
Cost System Tuning in Today's Economy
 
GEA32876 Offshore_Study_Paper_R11
GEA32876 Offshore_Study_Paper_R11GEA32876 Offshore_Study_Paper_R11
GEA32876 Offshore_Study_Paper_R11
 

Recently uploaded

CULR Spring 2024 Journal.pdf testing for duke
CULR Spring 2024 Journal.pdf testing for dukeCULR Spring 2024 Journal.pdf testing for duke
CULR Spring 2024 Journal.pdf testing for duke
ZevinAttisha
 
Kirill Klip GEM Royalty TNR Gold Copper Presentation
Kirill Klip GEM Royalty TNR Gold Copper PresentationKirill Klip GEM Royalty TNR Gold Copper Presentation
Kirill Klip GEM Royalty TNR Gold Copper Presentation
Kirill Klip
 
Dpboss Matka Guessing Satta Matta Matka Kalyan panel Chart Indian Matka Dpbos...
Dpboss Matka Guessing Satta Matta Matka Kalyan panel Chart Indian Matka Dpbos...Dpboss Matka Guessing Satta Matta Matka Kalyan panel Chart Indian Matka Dpbos...
Dpboss Matka Guessing Satta Matta Matka Kalyan panel Chart Indian Matka Dpbos...
➒➌➎➏➑➐➋➑➐➐Dpboss Matka Guessing Satta Matka Kalyan Chart Indian Matka
 
Satta Matka Dpboss Kalyan Matka Results Kalyan Chart
Satta Matka Dpboss Kalyan Matka Results Kalyan ChartSatta Matka Dpboss Kalyan Matka Results Kalyan Chart
Satta Matka Dpboss Kalyan Matka Results Kalyan Chart
Satta Matka Dpboss Kalyan Matka Results
 
8328958814KALYAN MATKA | MATKA RESULT | KALYAN
8328958814KALYAN MATKA | MATKA RESULT | KALYAN8328958814KALYAN MATKA | MATKA RESULT | KALYAN
8328958814KALYAN MATKA | MATKA RESULT | KALYAN
➑➌➋➑➒➎➑➑➊➍
 
list of states and organizations .pdf
list of  states  and  organizations .pdflist of  states  and  organizations .pdf
list of states and organizations .pdf
Rbc Rbcua
 
Kalyan Chart Satta Matka Dpboss Kalyan Matka Results
Kalyan Chart Satta Matka Dpboss Kalyan Matka ResultsKalyan Chart Satta Matka Dpboss Kalyan Matka Results
Kalyan Chart Satta Matka Dpboss Kalyan Matka Results
Satta Matka Dpboss Kalyan Matka Results
 
High-Quality IPTV Monthly Subscription for $15
High-Quality IPTV Monthly Subscription for $15High-Quality IPTV Monthly Subscription for $15
High-Quality IPTV Monthly Subscription for $15
advik4387
 
1 Circular 003_2023 ISO 27001_2022 Transition Arrangments v3.pdf
1 Circular 003_2023 ISO 27001_2022 Transition Arrangments v3.pdf1 Circular 003_2023 ISO 27001_2022 Transition Arrangments v3.pdf
1 Circular 003_2023 ISO 27001_2022 Transition Arrangments v3.pdf
ISONIKELtd
 
Best Competitive Marble Pricing in Dubai - ☎ 9928909666
Best Competitive Marble Pricing in Dubai - ☎ 9928909666Best Competitive Marble Pricing in Dubai - ☎ 9928909666
Best Competitive Marble Pricing in Dubai - ☎ 9928909666
Stone Art Hub
 
Pitch Deck Teardown: Kinnect's $250k Angel deck
Pitch Deck Teardown: Kinnect's $250k Angel deckPitch Deck Teardown: Kinnect's $250k Angel deck
Pitch Deck Teardown: Kinnect's $250k Angel deck
HajeJanKamps
 
Pro Tips for Effortless Contract Management
Pro Tips for Effortless Contract ManagementPro Tips for Effortless Contract Management
Pro Tips for Effortless Contract Management
Eternity Paralegal Services
 
DearbornMusic-KatherineJasperFullSailUni
DearbornMusic-KatherineJasperFullSailUniDearbornMusic-KatherineJasperFullSailUni
DearbornMusic-KatherineJasperFullSailUni
katiejasper96
 
The Most Inspiring Entrepreneurs to Follow in 2024.pdf
The Most Inspiring Entrepreneurs to Follow in 2024.pdfThe Most Inspiring Entrepreneurs to Follow in 2024.pdf
The Most Inspiring Entrepreneurs to Follow in 2024.pdf
thesiliconleaders
 
一比一原版(QMUE毕业证书)英国爱丁堡玛格丽特女王大学毕业证文凭如何办理
一比一原版(QMUE毕业证书)英国爱丁堡玛格丽特女王大学毕业证文凭如何办理一比一原版(QMUE毕业证书)英国爱丁堡玛格丽特女王大学毕业证文凭如何办理
一比一原版(QMUE毕业证书)英国爱丁堡玛格丽特女王大学毕业证文凭如何办理
taqyea
 
欧洲杯赌球-欧洲杯赌球买球官方官网-欧洲杯赌球比赛投注官网|【​网址​🎉ac55.net🎉​】
欧洲杯赌球-欧洲杯赌球买球官方官网-欧洲杯赌球比赛投注官网|【​网址​🎉ac55.net🎉​】欧洲杯赌球-欧洲杯赌球买球官方官网-欧洲杯赌球比赛投注官网|【​网址​🎉ac55.net🎉​】
欧洲杯赌球-欧洲杯赌球买球官方官网-欧洲杯赌球比赛投注官网|【​网址​🎉ac55.net🎉​】
valvereliz227
 
Enhancing Adoption of AI in Agri-food: Introduction
Enhancing Adoption of AI in Agri-food: IntroductionEnhancing Adoption of AI in Agri-food: Introduction
Enhancing Adoption of AI in Agri-food: Introduction
Cor Verdouw
 
Kalyan chart 6366249026 India satta Matta Matka 143 jodi fix
Kalyan chart 6366249026 India satta Matta Matka 143 jodi fixKalyan chart 6366249026 India satta Matta Matka 143 jodi fix
Kalyan chart 6366249026 India satta Matta Matka 143 jodi fix
satta Matta matka 143 Kalyan chart jodi 6366249026
 
Call 8867766396 Dpboss Matka Guessing Satta Matta Matka Kalyan Chart Indian M...
Call 8867766396 Dpboss Matka Guessing Satta Matta Matka Kalyan Chart Indian M...Call 8867766396 Dpboss Matka Guessing Satta Matta Matka Kalyan Chart Indian M...
Call 8867766396 Dpboss Matka Guessing Satta Matta Matka Kalyan Chart Indian M...
dpbossdpboss69
 
Satta Matka Dpboss Kalyan Matka Results Kalyan Chart
Satta Matka Dpboss Kalyan Matka Results Kalyan ChartSatta Matka Dpboss Kalyan Matka Results Kalyan Chart
Satta Matka Dpboss Kalyan Matka Results Kalyan Chart
Satta Matka Dpboss Kalyan Matka Results
 

Recently uploaded (20)

CULR Spring 2024 Journal.pdf testing for duke
CULR Spring 2024 Journal.pdf testing for dukeCULR Spring 2024 Journal.pdf testing for duke
CULR Spring 2024 Journal.pdf testing for duke
 
Kirill Klip GEM Royalty TNR Gold Copper Presentation
Kirill Klip GEM Royalty TNR Gold Copper PresentationKirill Klip GEM Royalty TNR Gold Copper Presentation
Kirill Klip GEM Royalty TNR Gold Copper Presentation
 
Dpboss Matka Guessing Satta Matta Matka Kalyan panel Chart Indian Matka Dpbos...
Dpboss Matka Guessing Satta Matta Matka Kalyan panel Chart Indian Matka Dpbos...Dpboss Matka Guessing Satta Matta Matka Kalyan panel Chart Indian Matka Dpbos...
Dpboss Matka Guessing Satta Matta Matka Kalyan panel Chart Indian Matka Dpbos...
 
Satta Matka Dpboss Kalyan Matka Results Kalyan Chart
Satta Matka Dpboss Kalyan Matka Results Kalyan ChartSatta Matka Dpboss Kalyan Matka Results Kalyan Chart
Satta Matka Dpboss Kalyan Matka Results Kalyan Chart
 
8328958814KALYAN MATKA | MATKA RESULT | KALYAN
8328958814KALYAN MATKA | MATKA RESULT | KALYAN8328958814KALYAN MATKA | MATKA RESULT | KALYAN
8328958814KALYAN MATKA | MATKA RESULT | KALYAN
 
list of states and organizations .pdf
list of  states  and  organizations .pdflist of  states  and  organizations .pdf
list of states and organizations .pdf
 
Kalyan Chart Satta Matka Dpboss Kalyan Matka Results
Kalyan Chart Satta Matka Dpboss Kalyan Matka ResultsKalyan Chart Satta Matka Dpboss Kalyan Matka Results
Kalyan Chart Satta Matka Dpboss Kalyan Matka Results
 
High-Quality IPTV Monthly Subscription for $15
High-Quality IPTV Monthly Subscription for $15High-Quality IPTV Monthly Subscription for $15
High-Quality IPTV Monthly Subscription for $15
 
1 Circular 003_2023 ISO 27001_2022 Transition Arrangments v3.pdf
1 Circular 003_2023 ISO 27001_2022 Transition Arrangments v3.pdf1 Circular 003_2023 ISO 27001_2022 Transition Arrangments v3.pdf
1 Circular 003_2023 ISO 27001_2022 Transition Arrangments v3.pdf
 
Best Competitive Marble Pricing in Dubai - ☎ 9928909666
Best Competitive Marble Pricing in Dubai - ☎ 9928909666Best Competitive Marble Pricing in Dubai - ☎ 9928909666
Best Competitive Marble Pricing in Dubai - ☎ 9928909666
 
Pitch Deck Teardown: Kinnect's $250k Angel deck
Pitch Deck Teardown: Kinnect's $250k Angel deckPitch Deck Teardown: Kinnect's $250k Angel deck
Pitch Deck Teardown: Kinnect's $250k Angel deck
 
Pro Tips for Effortless Contract Management
Pro Tips for Effortless Contract ManagementPro Tips for Effortless Contract Management
Pro Tips for Effortless Contract Management
 
DearbornMusic-KatherineJasperFullSailUni
DearbornMusic-KatherineJasperFullSailUniDearbornMusic-KatherineJasperFullSailUni
DearbornMusic-KatherineJasperFullSailUni
 
The Most Inspiring Entrepreneurs to Follow in 2024.pdf
The Most Inspiring Entrepreneurs to Follow in 2024.pdfThe Most Inspiring Entrepreneurs to Follow in 2024.pdf
The Most Inspiring Entrepreneurs to Follow in 2024.pdf
 
一比一原版(QMUE毕业证书)英国爱丁堡玛格丽特女王大学毕业证文凭如何办理
一比一原版(QMUE毕业证书)英国爱丁堡玛格丽特女王大学毕业证文凭如何办理一比一原版(QMUE毕业证书)英国爱丁堡玛格丽特女王大学毕业证文凭如何办理
一比一原版(QMUE毕业证书)英国爱丁堡玛格丽特女王大学毕业证文凭如何办理
 
欧洲杯赌球-欧洲杯赌球买球官方官网-欧洲杯赌球比赛投注官网|【​网址​🎉ac55.net🎉​】
欧洲杯赌球-欧洲杯赌球买球官方官网-欧洲杯赌球比赛投注官网|【​网址​🎉ac55.net🎉​】欧洲杯赌球-欧洲杯赌球买球官方官网-欧洲杯赌球比赛投注官网|【​网址​🎉ac55.net🎉​】
欧洲杯赌球-欧洲杯赌球买球官方官网-欧洲杯赌球比赛投注官网|【​网址​🎉ac55.net🎉​】
 
Enhancing Adoption of AI in Agri-food: Introduction
Enhancing Adoption of AI in Agri-food: IntroductionEnhancing Adoption of AI in Agri-food: Introduction
Enhancing Adoption of AI in Agri-food: Introduction
 
Kalyan chart 6366249026 India satta Matta Matka 143 jodi fix
Kalyan chart 6366249026 India satta Matta Matka 143 jodi fixKalyan chart 6366249026 India satta Matta Matka 143 jodi fix
Kalyan chart 6366249026 India satta Matta Matka 143 jodi fix
 
Call 8867766396 Dpboss Matka Guessing Satta Matta Matka Kalyan Chart Indian M...
Call 8867766396 Dpboss Matka Guessing Satta Matta Matka Kalyan Chart Indian M...Call 8867766396 Dpboss Matka Guessing Satta Matta Matka Kalyan Chart Indian M...
Call 8867766396 Dpboss Matka Guessing Satta Matta Matka Kalyan Chart Indian M...
 
Satta Matka Dpboss Kalyan Matka Results Kalyan Chart
Satta Matka Dpboss Kalyan Matka Results Kalyan ChartSatta Matka Dpboss Kalyan Matka Results Kalyan Chart
Satta Matka Dpboss Kalyan Matka Results Kalyan Chart
 

Mining Cost Cutting Cycle and the ways to Avoid the Traps

  • 1. 1Total System Value The Mining Cost Cutting Cycle and Ways to Avoid the Traps Summary TSV Mining has often witnessed thatnot all cost cutting methods transfer well from site to site, and some may have hidden traps that become detrimental to the longer term sustainability of a mine. Background As the mining industry tightens its belt due to costs exceeding cooling prices for many operations, the cost cutting machine has kicked in yet again. Having been through this same Groundhog Day a few times and seen the transitions from the overspending to the cost cutting phase of the cycle, we have noticed several traps that mining operations can get caught by. Working with clients whilst they were expanding during the boom time, we were able to demonstrate the non-linear relationship between throughput expansions and costs. Contrary to expectations of economies of scale, costs were actually going up exponentially with the increase in production, not linearly. There were a number of well-publicised reasons for this, such as: A requirement to move into high stripping ratio areas that could be avoided at lower levels of production Additional major capital purchases including processing plant upgrades and expansions during a period of elevated capital costs Higher freight costs as long term contracts were reset and where further production increases required substantial below rail capital investment due to capacity constraints being approached Increasing supplier costs with the higher demand However, there were also some less than obvious causes for the exponential increase in costs. Mine plans that were being produced were becoming more and more aggressive as companies tried to take maximum advantage of the boom. Creating a plan on paper was seen as the value that could be achieved, disconnected from the real value in the pit. Operations were being stretched to a higher intensity than had been seen before. On paper these plans looked to be quite achievable compared
  • 2. 2Total System Value to previous productivity levels, but when implemented, they tended to perform poorly. When we were part of expansion projects, a difficult element was making sure the plans were actually achievable. The difficulty was not in getting the plans to work per se, but rather convincing the business that a lot of the methods used to increase production were merelyincreasing the risk of the plan, and such risks would have negative consequences well beyond the value being chased on paper. We once calculated the odds of a more bullish productivity assumption being used for a medium term plan: the change in assumption would allow a saving of approximately $10 million in order to curb the rising expansion costs through a reduction in contractor stripping requirements. The odds of a successful outcome were very low; less than 5% based on statistical analysis of previous stripping output. We demonstrated that the downside of the attempted saving if the contractor stripping was not able to be replaced by improved owner-operator performance would be a loss in revenue in the order of $50 million that year (and site policies made it nearly impossible to prevent). So there was a $50 million bet being made in order to achieve a $10 million windfall – in gambler’s parlance it was a bet paying $1.20 the win, with less than 5% chance of paying off! Another major cause of unmet planned targets was the implementation of new policies. Some of these policies were required to ensure the sustainability of the operation; however many were implemented for an isolated process without any analysis on the impact it was having on the overall production system. The cost to the operation from the policies was not measured or understood. The price and the demand for resources still remains strong historically, leading to companies maintaining high levels of production, but needing to combat the unprecedented jump in costs. Capital investment for a lot of mining operations has already been spent, and there still remains a requirement to maximise the financial return on these. 5 Hidden Cost Cutting Traps Some organisations are seeing the obvious benefits of cost cutting; it is hard to argue against cuts such as renegotiating contracts with contractors and suppliers that were agreed during a “hotter” market. Reducing overheads in areas that don’t add any value to the actual production chain is also a clear winning move in the current environment. Improvements that clearly demonstrate increased production out of equipment that allows for reduced contractor input or the ability to shut excessive
  • 3. 3Total System Value capacity is something that will pay off in any part of the cycle. However, there are always some things to watch out for when looking for other cost cutting targets. 1. Watch out for the perceived benefits on paper A short term cut can lead to long term devastation. As in the example of chasing the $10 million saving earlier, there can be a large downside if it is not fully thought through and done properly. A lack of understanding in risk or consequence contained in the mine plancan cause a false sense of benefits being achieved. In our experience we have found the usual static, deterministic plans that we are all use to, to be incapable of giving any information onrisk or consequences. Even the token effort of completing a tornado plot at the end of the planning process really adds nothing to the understanding because it is still based on a static plan, it doesn’t account for the interactions that occur between production processes or show how the variability contained in the system effects throughput. Pressure on performance does not have to come from the mine plan directly; aspirational targets can still be used as an operational incentive without the need to generate overly bullish numbers in the base mine plan. Keeping the plan as close to reality as possible will ensure that all processes are likely to be resourced “correctly” and sets a clear baseline. If risk is to be increased in the plan, take risks that have high reward with minimal downside and make allowance for that risk within the plan through discounting. 2. Are site inventories being reduced, making the site more vulnerable? Just about all processes at an operation will have some form of inventory. In the production area there can be: Topsoil cleared Drilled inventory Blasted inventory (both waste and broken stocks) Prestrip inventory Coal/ore uncovered inventory Pre-processing (raw coal/ore) inventory
  • 4. 4Total System Value Product/concentrate inventory at site and in the logistics chain If there is an ability to reduce these inventories (and yes, a consistent increase in performance of a process which is stable both statistically and relative to plan, can allow for significant reduction in these), this can be a successful cost reduction method through savings in working capital. However, reducing inventories to reduce costs without addressing variation can lead to unwanted consequences. Inventories protect the system throughput and are critical in handling normal variability in output as well as negative unplanned events (and all unplanned events are negative, when was the last unplanned event in your production system that was a boost to the for throughput?). Events tend to be unplanned as individuallythey are infrequent; however the likelihood of one or more of these events occurring is almost certain in a year. Inventories enable an operation to handle these events and sustain throughput. Any cost saving measure through reducing inventories should have a very good handle on the variability of different processes and the potential for negative events to impact the plan such as wet weather, major equipment failures, geotechnical incidents, or an error in design. Any operation will incur negativeunplanned eventsat least once a year. It is not economically viable to significantly lower the chance of these events occurring. 3. Some changes will happen gradually and may be missed We’ve all heard the boiling frog analogy; if you put a frog in boiling water it will leap out right away to escape danger but if you gradually heat the water from a cool temperature, the frog will not notice until it is too late. The open cut mining environment tends not to detect change well because the production cycle is much longer term compared to the manufacturing industry, resulting in gradual change that is not easily noticeable. If the main key performance indicator tracked is final throughput, and only minimal focus is put on leading indicators such as inventories (and not just final product inventory), then there may be no warning that a process is about to become a constraint for the system.Inventories will always go up and down as they smooth out the inevitable fluctuations in the system; it is what they are there for. What they should not do is continue downwards, unplanned, for an extended period of time. When this occurs, a new process will eventually start to hold up the
  • 5. 5Total System Value system. At first the occasional hold up will occur, gradually increasing until it becomes a constant issue. If inventories have decreased in a number of processes, the situation may become even worse with the constraint floating across the system, making it even harder to find where best to apply limited resources to remove the constraint and lift overall throughput and a production system that is impossible to get under control because of its unpredictability. Changes to constraints will not happen overnight. Observing unplanned, consistently dropping inventory is a lead indicator that the current production is unsustainable with the current application of resources. 4. Processes in the operation previously considered minor and therefore unscheduled have become more crucial and are very sensitive to resource changes With the higher intensity being included in mine plans, potential issues can be missed. One major issue we have seen at mining operations (and it is becoming more and more common) is that some processes are no longer needing to be resourced based on the size of the combined tasks over time, but rather the time that will be available for the process to be performed for each individual task. As production increases in the same footprint, the time available for supporting tasks such as drill prep, drilling, blasting, etc actually reduces exponentially, not linearly (if you don’t believe this, picture a single digging unit that moves across four dig areas; now consider two diggers over the same four dig areas and compare the amount of time that a digger is away from an area to allow time for support activities: production doubles but time for support activities reduces by two-thirds, not by half). This can cause untracked and unscheduled processes to become constraints with very little warning. It is only obvious when the schedule is run with production targets aligned with actual performance and with all processes that consume time in the operation being scheduled, no matter how minor they might have previously seemed. These supporting tasks may need substantial sprint capacity (anathema to the cost cutting drive) if they are to complete tasks within the time available and maintain plan stability. Supporting taskscan stop throughput just as easily as major production tasks, however it is relatively cheap to prevent. At most operations they can actually be responsible for some of the lowest marginal cost throughput on site.
  • 6. 6Total System Value 5. Using utilisation to understand resource requirements can be dangerous There may be a poor relationship between process utilisation and resourcing requirements. Utilisation works well as a short term indicator when working on a task; however it can be a poor method for calculating long term resourcing requirements. This is the case when tasks need to be completed in a narrow period of time and there is standby time between these task windows. Generally this is the case for most minor tasks on site, such as small excavation tasks, drilling preparation, drilling, grade control, blasting and pumping. A simple method of demonstrating the potential size of delays when long term demand is used rather than focusing on short term peak loads is to use Queueing Theory, first developed by Agner Erlang. Let’s use an example of a blast crew: As other processes release jobs they become flagged for the blast crew to complete. When resourcing a blast crew based on the overall tonnages they are required to complete over a sustained period (such as a budget year), the assumption is made that they can level the tasks – ie. as long as their capacity is higher than the overall requirements, then the blast crew should not hold up any process. If we assume that on average two blasts a week are released with an average 400t per blast, and the blast crew has a loading capacity of 1,000t per week including two tie and fires a week. What will this look like? Case A: D/D/1 (deterministic task arrival / deterministic task service / 1 blast crew) Average blasting requirement = 400t Average blasting task released = 2 per week (or arrival rate of 0.286 blasts per day) Blast crew capacity = 1,000t / week (or a service rate of 0.357 blasts per day) Blast crew capacity utilisation = 80% Average time released tasks wait for blast crew But we know that tasks will not be released at equal intervals each week. Let’s give the release an exponential distribution around the arrival of these tasks: Case B: M/D/1 (random task arrival / deterministic task service / 1 blast crew) Average blasting requirement = 400t
  • 7. 7Total System Value Average blasting task released = 2 per week (or arrival rate of 0.286 per day, on average but random) Blast crew capacity = 1,000t / week (or a service rate of 0.357 per day) Blast crew capacity utilisation = 80% Average time released tasks wait for blast crew So blasting tasks on average are now waiting 5.6 days on average before the blast crew will get around to them. Next, let’s give the blasting process a distribution. Both the blast crews and the size of the tasks will have a distribution, for simplicity we will use a normal distribution around the service rate of the blast crew. Case C: M/G/1 (random task arrival / random task service / 1 blast crew) Average blasting requirement = 400t Average blasting task released = 2 per week (or arrival rate of 0.286 per day, on average but random) Blast crew capacity = 1,000t / week (or a service rate of 0.357 per day, on average but random) Blast crew capacity utilisation = 80% Average time released tasks wait for blast crew NOTE: Though we have used an exponential distribution for arrival time and normal distribution for the blast crew/task size – this is just a simple example to demonstrate that utilisation of a process is not always right. Distributions would differ site to site. So something like the blast crew can be sensitive to an operation, particularly one working on a time size requirement, as a blast crew at 80% capacity utilisation has jobs waiting 11.2 days on average to be processed. For a high intensity operation that is trying to achieve quick strip/block turnaround, this could cause a significant loss in throughput. Say if this blast crew was cut back due to high costs, and the expectation was to get 90% utilisation
  • 8. 8Total System Value from the remaining crew. In this case using the same calculations as previous, the average wait time for a blast will end up being 28.4 days, not much of a saving, but a potential large loss in throughput and revenue. The blast delay here is just an average. During peak blast demand times the wait could be substantially higher. It is easy to see how these delays could affect throughput if the blast window is narrow, severely affecting downstream processes such as stripping. In order to correctly resource all processes in the operation, all time consuming activities must be scheduled dynamically. 5 Sustainable Solutions when Cost Cutting There are numerous methods to cutting costs that are sustainable, such as: Renegotiating contract rates to a lower price Removing non-value adding activities and resources Delaying expansion projects Increasing process productivity However we thought we would give some different solutions rather the more traditional ones: 1. Check policies and improvements for individual processes and see if they truly benefit the system Localised improvements for a process can quite often be to the detriment of the system. If the value is only measured at the process without analysing upstream and downstream processes, it may not be aligned with the revenue of the operation. Operating standards/requirements also tend to accumulate over time. An example of this is a localised improvement that reduces the number of trucks needed to haul coal by breaking up the long hauls into shorter segments, thereby reducing the peak loads of haulage. This could result in a saving of $5 million per year. However, undertaking a system-wide approach to improvements would reveal that more coal rehandling increases fines generation, creating an overload in the fines circuit of the CHPP and dropping the coal yield from these areas by 8%, reducing revenue by $17 million per year. In addition to the loss in coal produced, there could be other downstream issues, such as reducing handleability in the logistics chain or client concerns with
  • 9. 9Total System Value the increased fines. All process improvements and policy changes should undertake a system-wide analysis to ensure that all unintended consequences are found and examined. 2. Look at opportunities to reduce the variation in the processes At TSV Mining we analyse six main sources of variation that are typically found within the commodity value chain of the open cut mining environment. Reducing variation in the system is always possible. Interrelationships between variation sources have exponential effects on any operation. Some reduction can be relatively cheap and provides for the sustainable cost reduction in many areas through a reduction in the required sprint capacity or the inventory. Some examples of reduction in system variation include: Normalising the length of stripping circuits by planning hauls and dump locations more thoroughly, ensuring that the operation is hauling “long dirt” to the short dumps and “short dirt” to the long dumps Improving grade control practices Upskilling of frontline supervision to a consistent standard Improving water management capacity to reduce the effects of future weather events Balancing block sizes so that coal/ore is released on a more consistent basis Improving quality control in the processing area so that penalty components are closer to the customer specification while still not getting penalised Understanding the sources of variation and how the systems reacts to changing variation is one of the largest opportunities to reducing costs in most operations. 3. Look at getting the right inventories in the right locations There is a huge amount of working capital tied up in inventories. Getting inventory levels and locations right ensures the system throughput, but getting them wrong is simply tying up working capital or reducing the potential throughput of the operation. Often when working with clients we find that risk mitigation strategies have inventories in low value locations (usually because these are the areas where inventory can be held more easily, regardless of whether it adds value), when
  • 10. 10Total System Value alternative locations can reduce costs significantly and improve the risk mitigation. It is not just overall quantities of inventories that need to be monitored; the right quantities must be in theright locationsin order to be cost effective. 4. Customise the cost reduction for each operation Anchoring is a cognitive bias that affects us all, where we tend to overly focus on what has worked previously, both in our personal experience and what we have seen work for others. However, no two operations are the same, and taking a solution from one operation to another may have a detrimental effect if it isn’t considered whether the reasons for the solution working elsewhere are still applicable in the new environment. Operations can have a sustainable cut in costs in the right areas. But assuming that all sites are the same, and using the same technique across the board can be fraught with danger and actually cause costs to increase in certain situations. Process improvement resources are always in scarce supply, no more so than in the current environment. Therefore it is crucial that a “boil the ocean” approach is not taken. Time should be taken to identify the constraining process that is holding back overall throughput and then commitment made to not make cuts in this area. All process improvement resources should then be targeted at the one constraining process with a laser-like focus. Cost-cutting can then be applied in other areas where there is excessive capacity (be sure to understand what excessive is), with a scalpel, not a broad brush. However, each cut should consider the effect on the rest of the operation. Decisions should be made considering the operation as a complete system, not as a group of siloed processes. Targeting areas to cut costs where they will not impact throughput is of high importance, and may not be where you would like to cut. We have seen damaging cuts made to the productive capacity of a process that was the main capacity constraint of an operation just because 50% of the site’s costs were in that process. Always customise the cost cutting for each operation as small differences between two operations can cause big changes in where the focal areas need to be to improve throughput and reduce costs.
  • 11. 11Total System Value 5. Look at incremental, not overall process costs When there are multiple processes required to move material, with cost analysis changing the process from one to the next, the costs need to be analysed on anincremental basis. Whether it is moving from dozer push to excavator, increasing cast, choosing the dragline horizon with prestrip, or adding equipment to an excavator circuit, overall process costs will not give a clear picture. As with most things discussed here, incremental costs are not linear; they again go up exponentially as productivity deteriorates exponentially: raising the dragline horizon will go through larger step changes in rehandle (increasing rehandle exponentially), dozer push productivity will decrease with longer and steeper uphill pushes (productivity deteriorating exponentially), the benefits from increasing powder factor to achieve a higher cast or improve diggability will decay exponentially, adding more trucks to a circuit will have a exponentially decaying benefit in additional throughput. Overall process costs hide exponential cost increases. Bringing it all together Short term cost reduction benefits can have many hidden traps. There are many aspects of an operation where sustainable cost reduction can be undertaken. In this paper there are several underlying themes: Always look at how the system is reacting to change, not just the individual processes Inventories will hide potential throughput issues for a period of time. Any inventory contained within the system that constantly deteriorates is a lead indicator that current production levels with current application of resources is unsustainable Most elements in mining do not change in a linear fashion, they tend to change exponentially Traditional methods of measuring resource requirements may no longer work Keeping these themes in mind when looking for opportunities to cut costs and increase throughput will have you well-armed in avoiding many of the traps and pitfalls we have mentioned here. TSV Mining has many years of applying systems thinking principles to the open cut mining industry using simulation modelling and statistical analysis, amongst other techniques. If you would like to discuss how these or dozens of other methods could be applied at your site to improve cash flow, please contact cbraund@tsvmining.com.auor visit our website at www.tsvmining.com.au