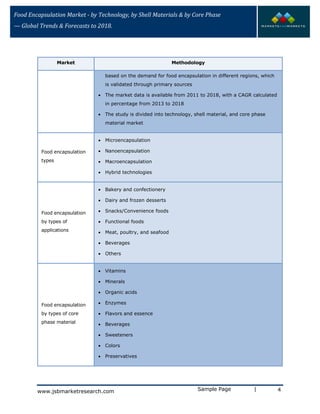
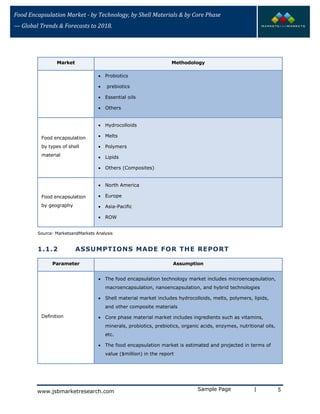
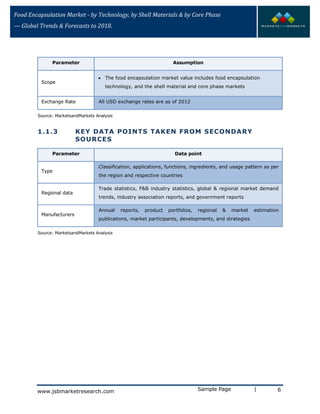
The document provides an overview and market analysis of the global food encapsulation market from 2011 to 2018. It segments the market by technology, shell materials, core phase, applications, and geography. Some key findings include:
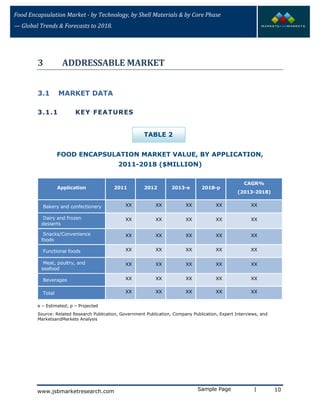
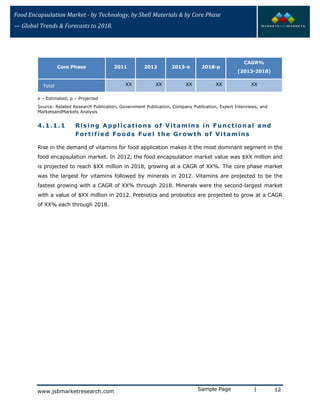
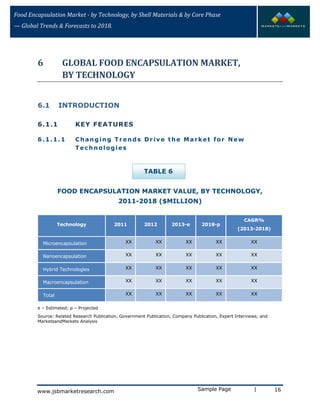
- The food encapsulation market was valued at $XX million in 2012 and is projected to reach $XX million by 2018, growing at a CAGR of XX%.
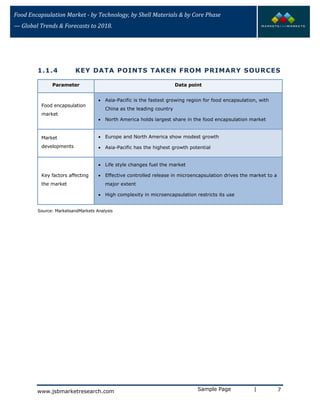
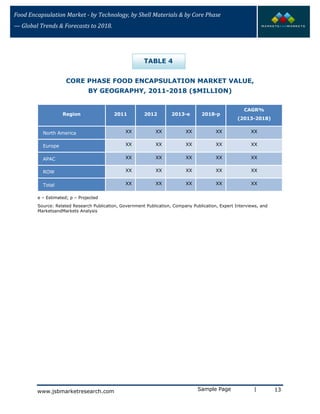
- Asia Pacific is the fastest growing region due to increasing demand from countries like China.
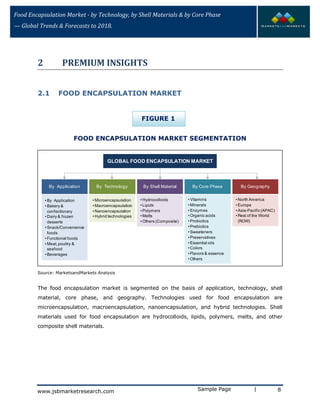
- Microencapsulation has the largest market share by technology due to its ability to provide controlled release.
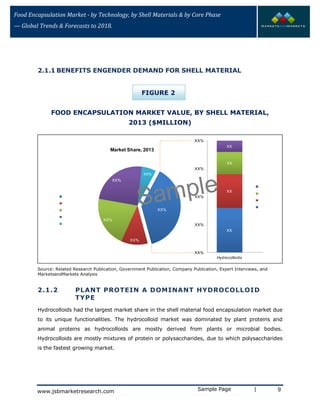
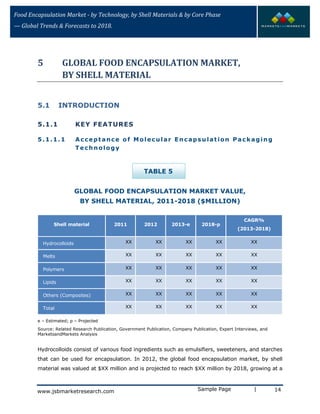
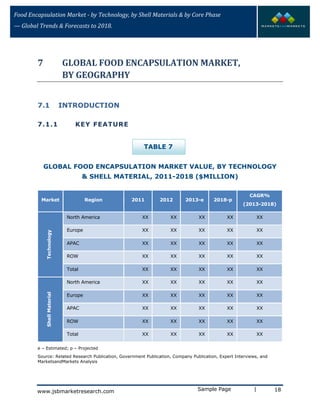
- Hydrocolloids have the largest market share by shell material.


![제 23회 보아즈(BOAZ) 빅데이터 컨퍼런스 - [MBOAX] : ABSA를 활용한 소비자 반응 분석 기반 운영 효율화 대시보드 설계](https://cdn.slidesharecdn.com/ss_thumbnails/3-1boaz23rdconferencemboax-260203102709-9d519923-thumbnail.jpg?width=640&height=640&fit=bounds)


