Download to read offline
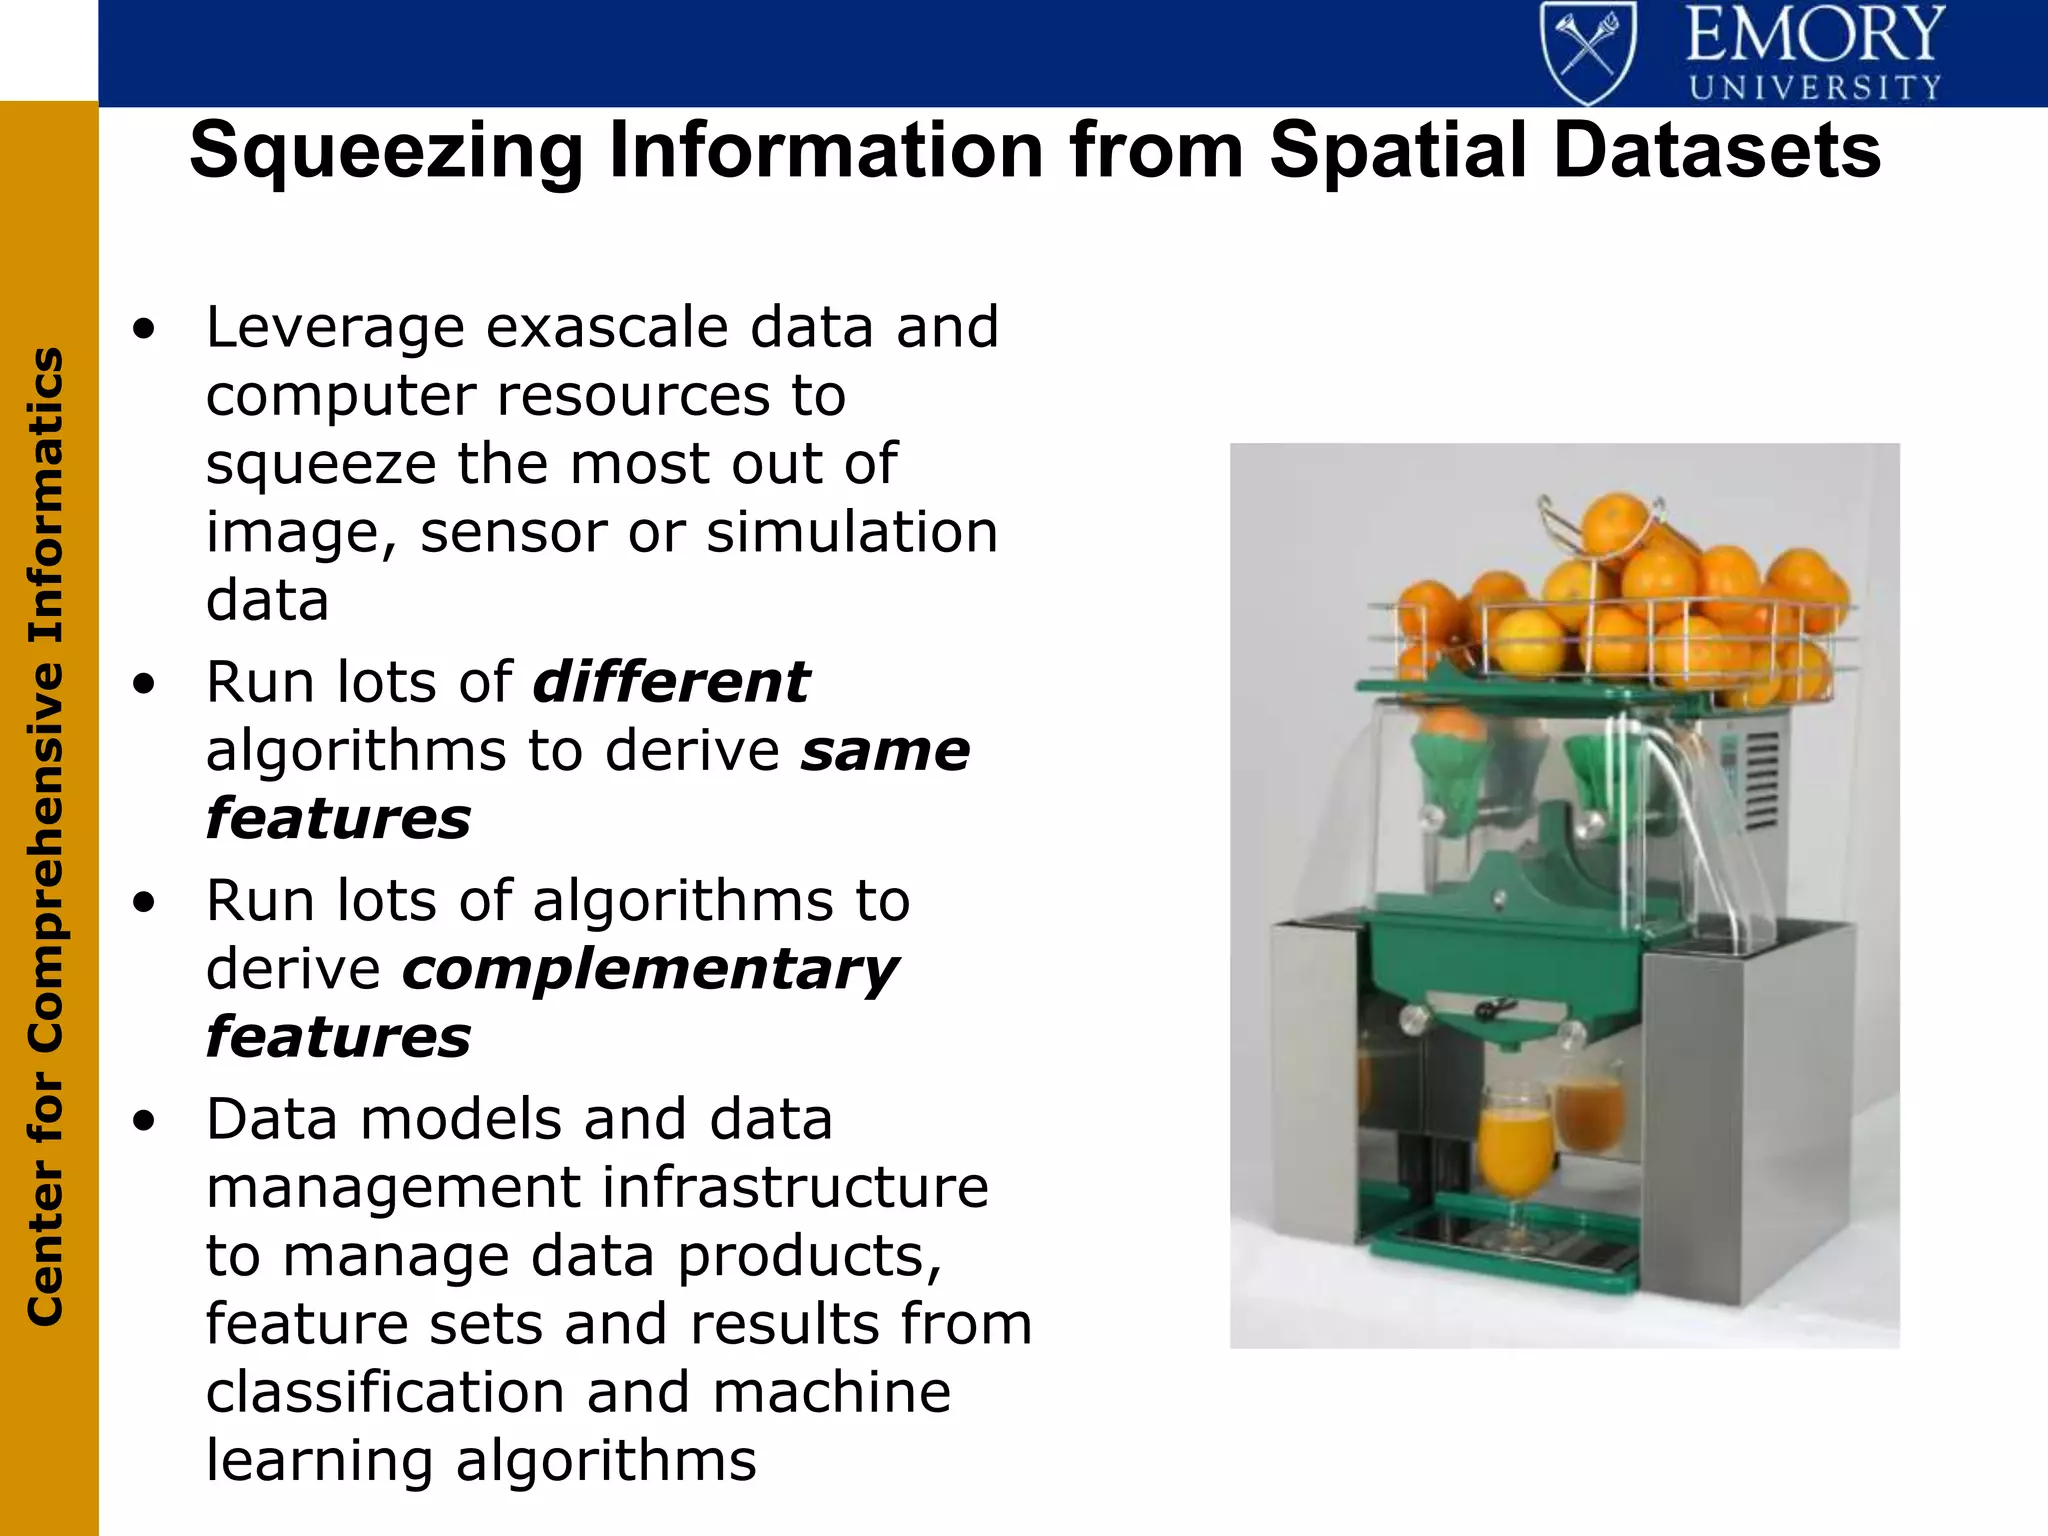
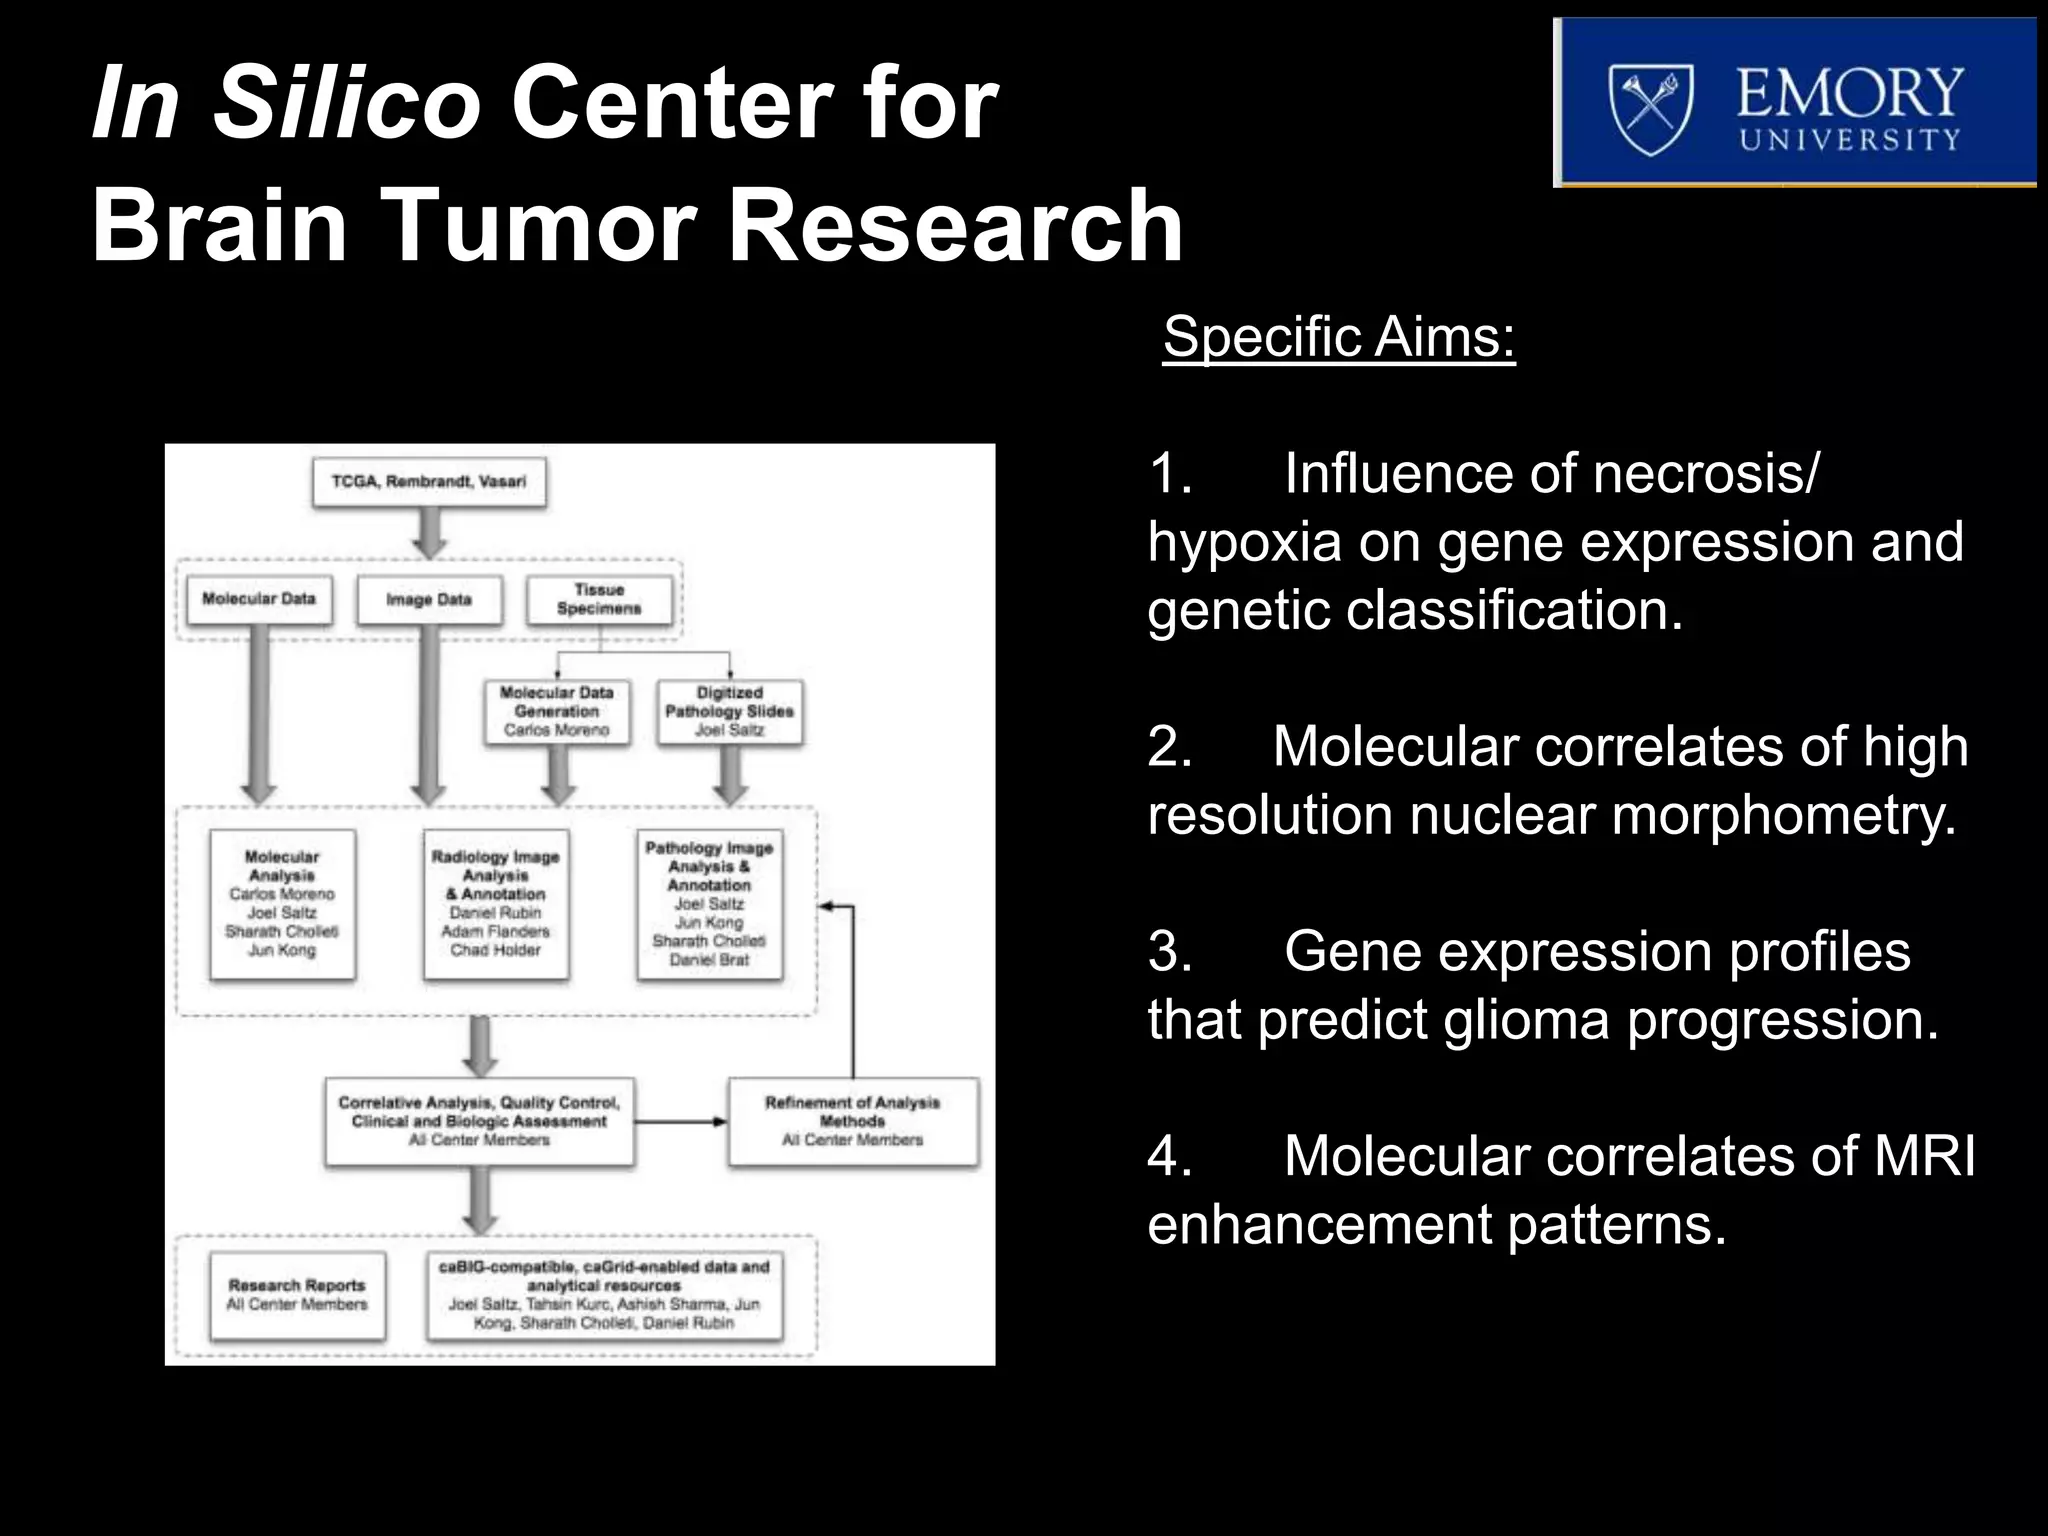
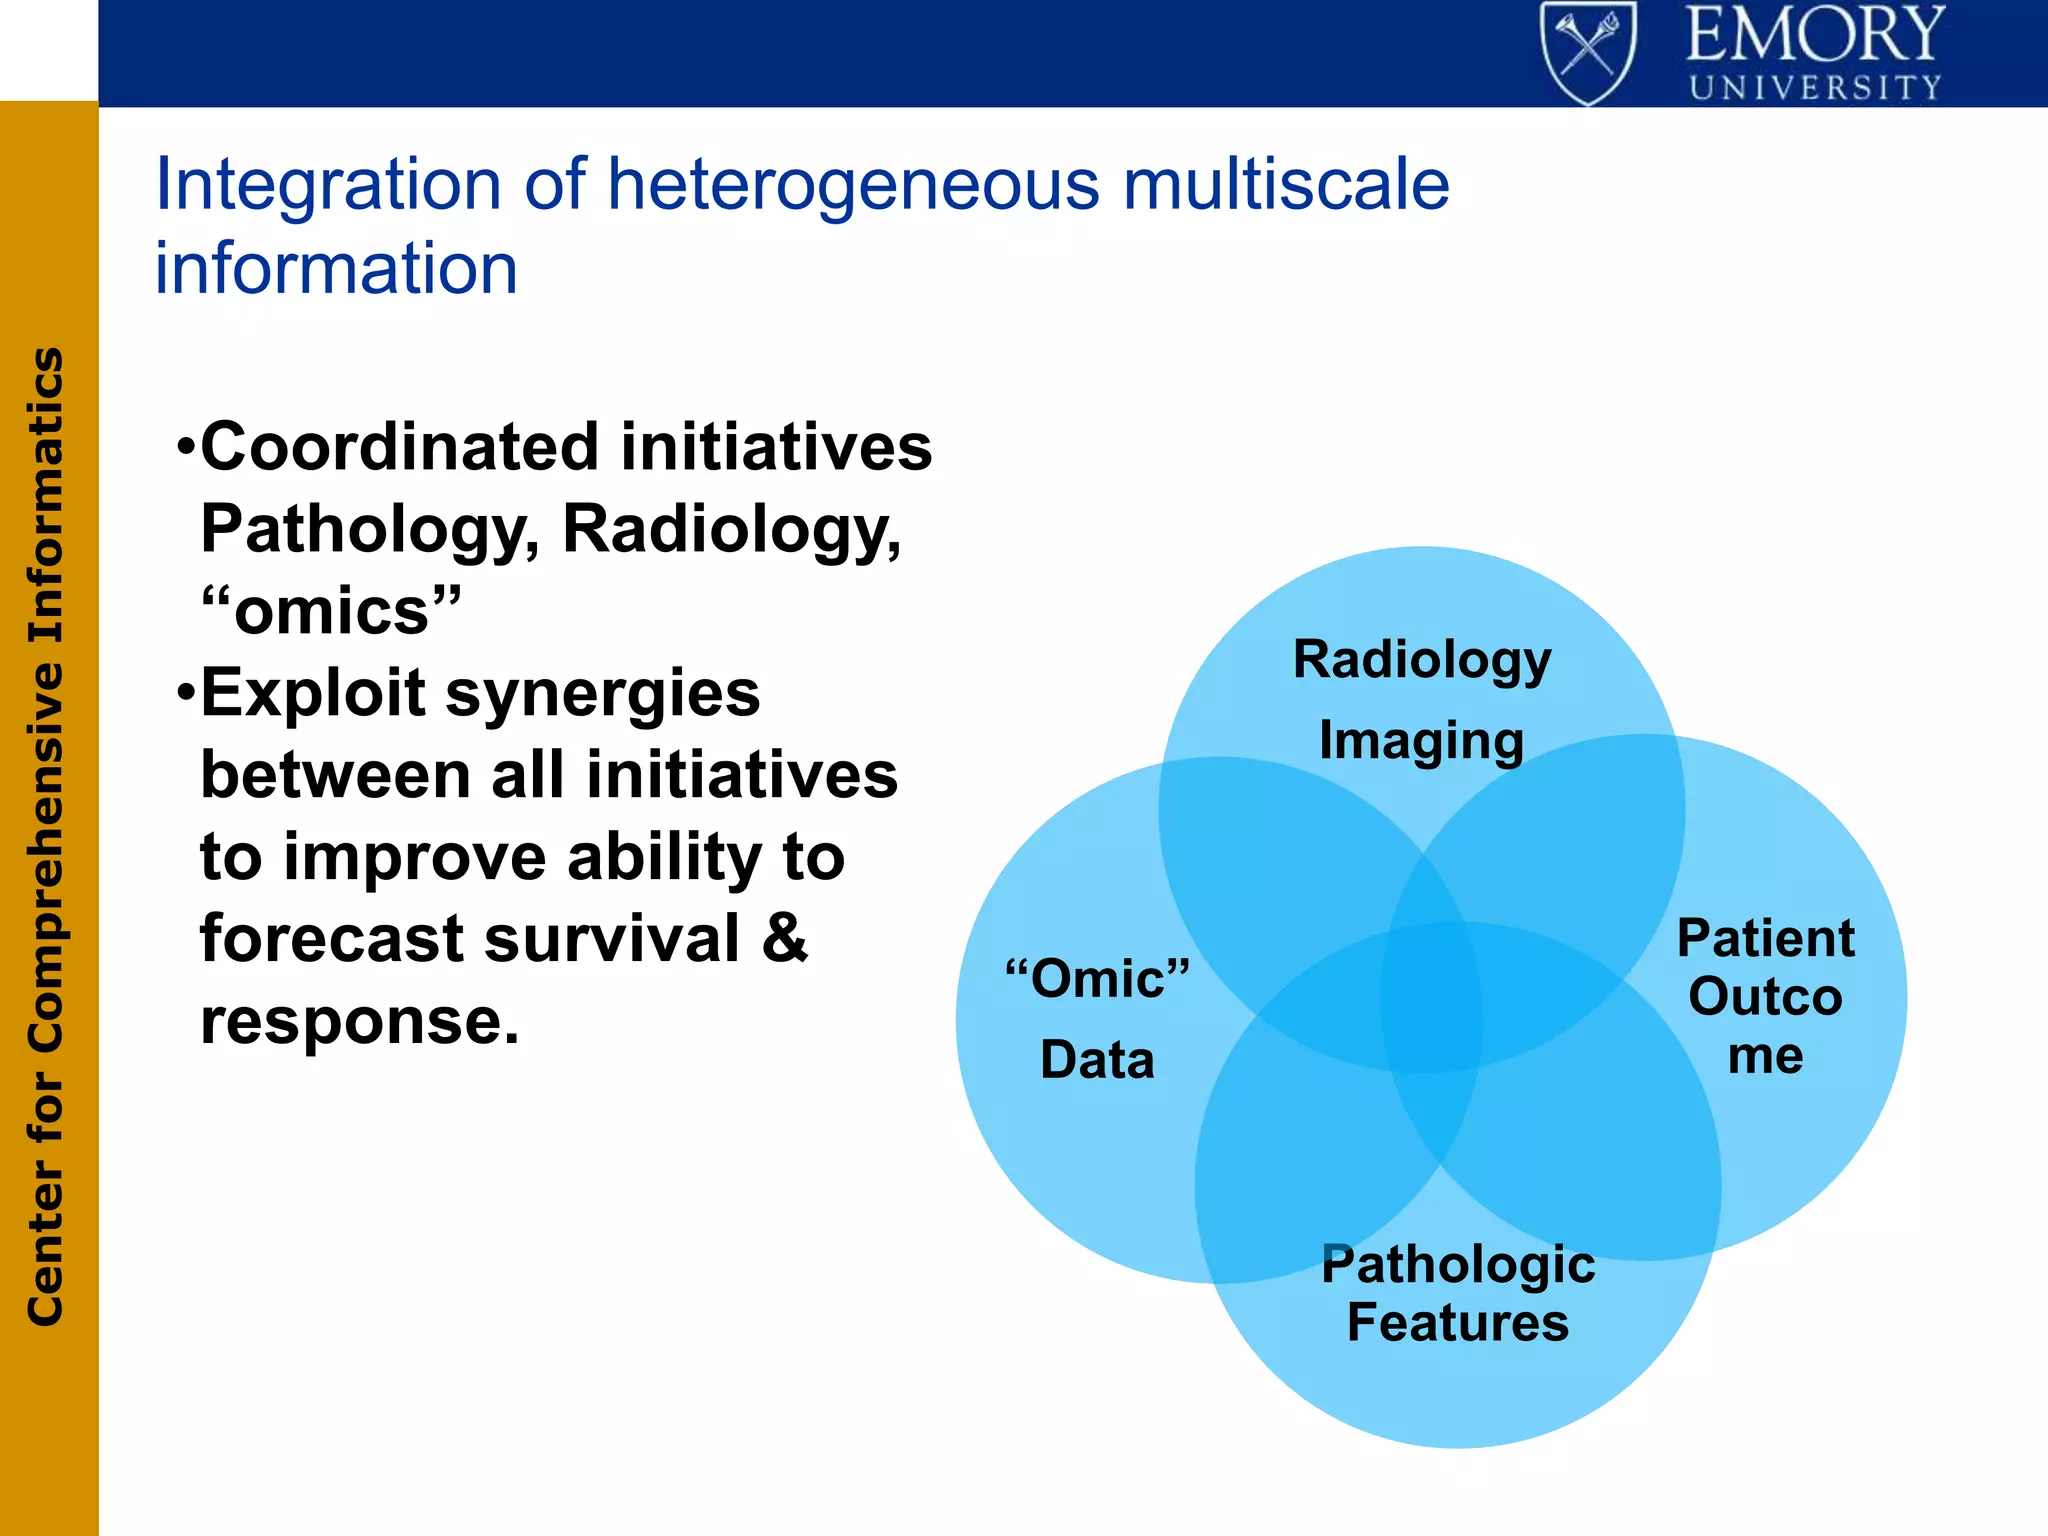
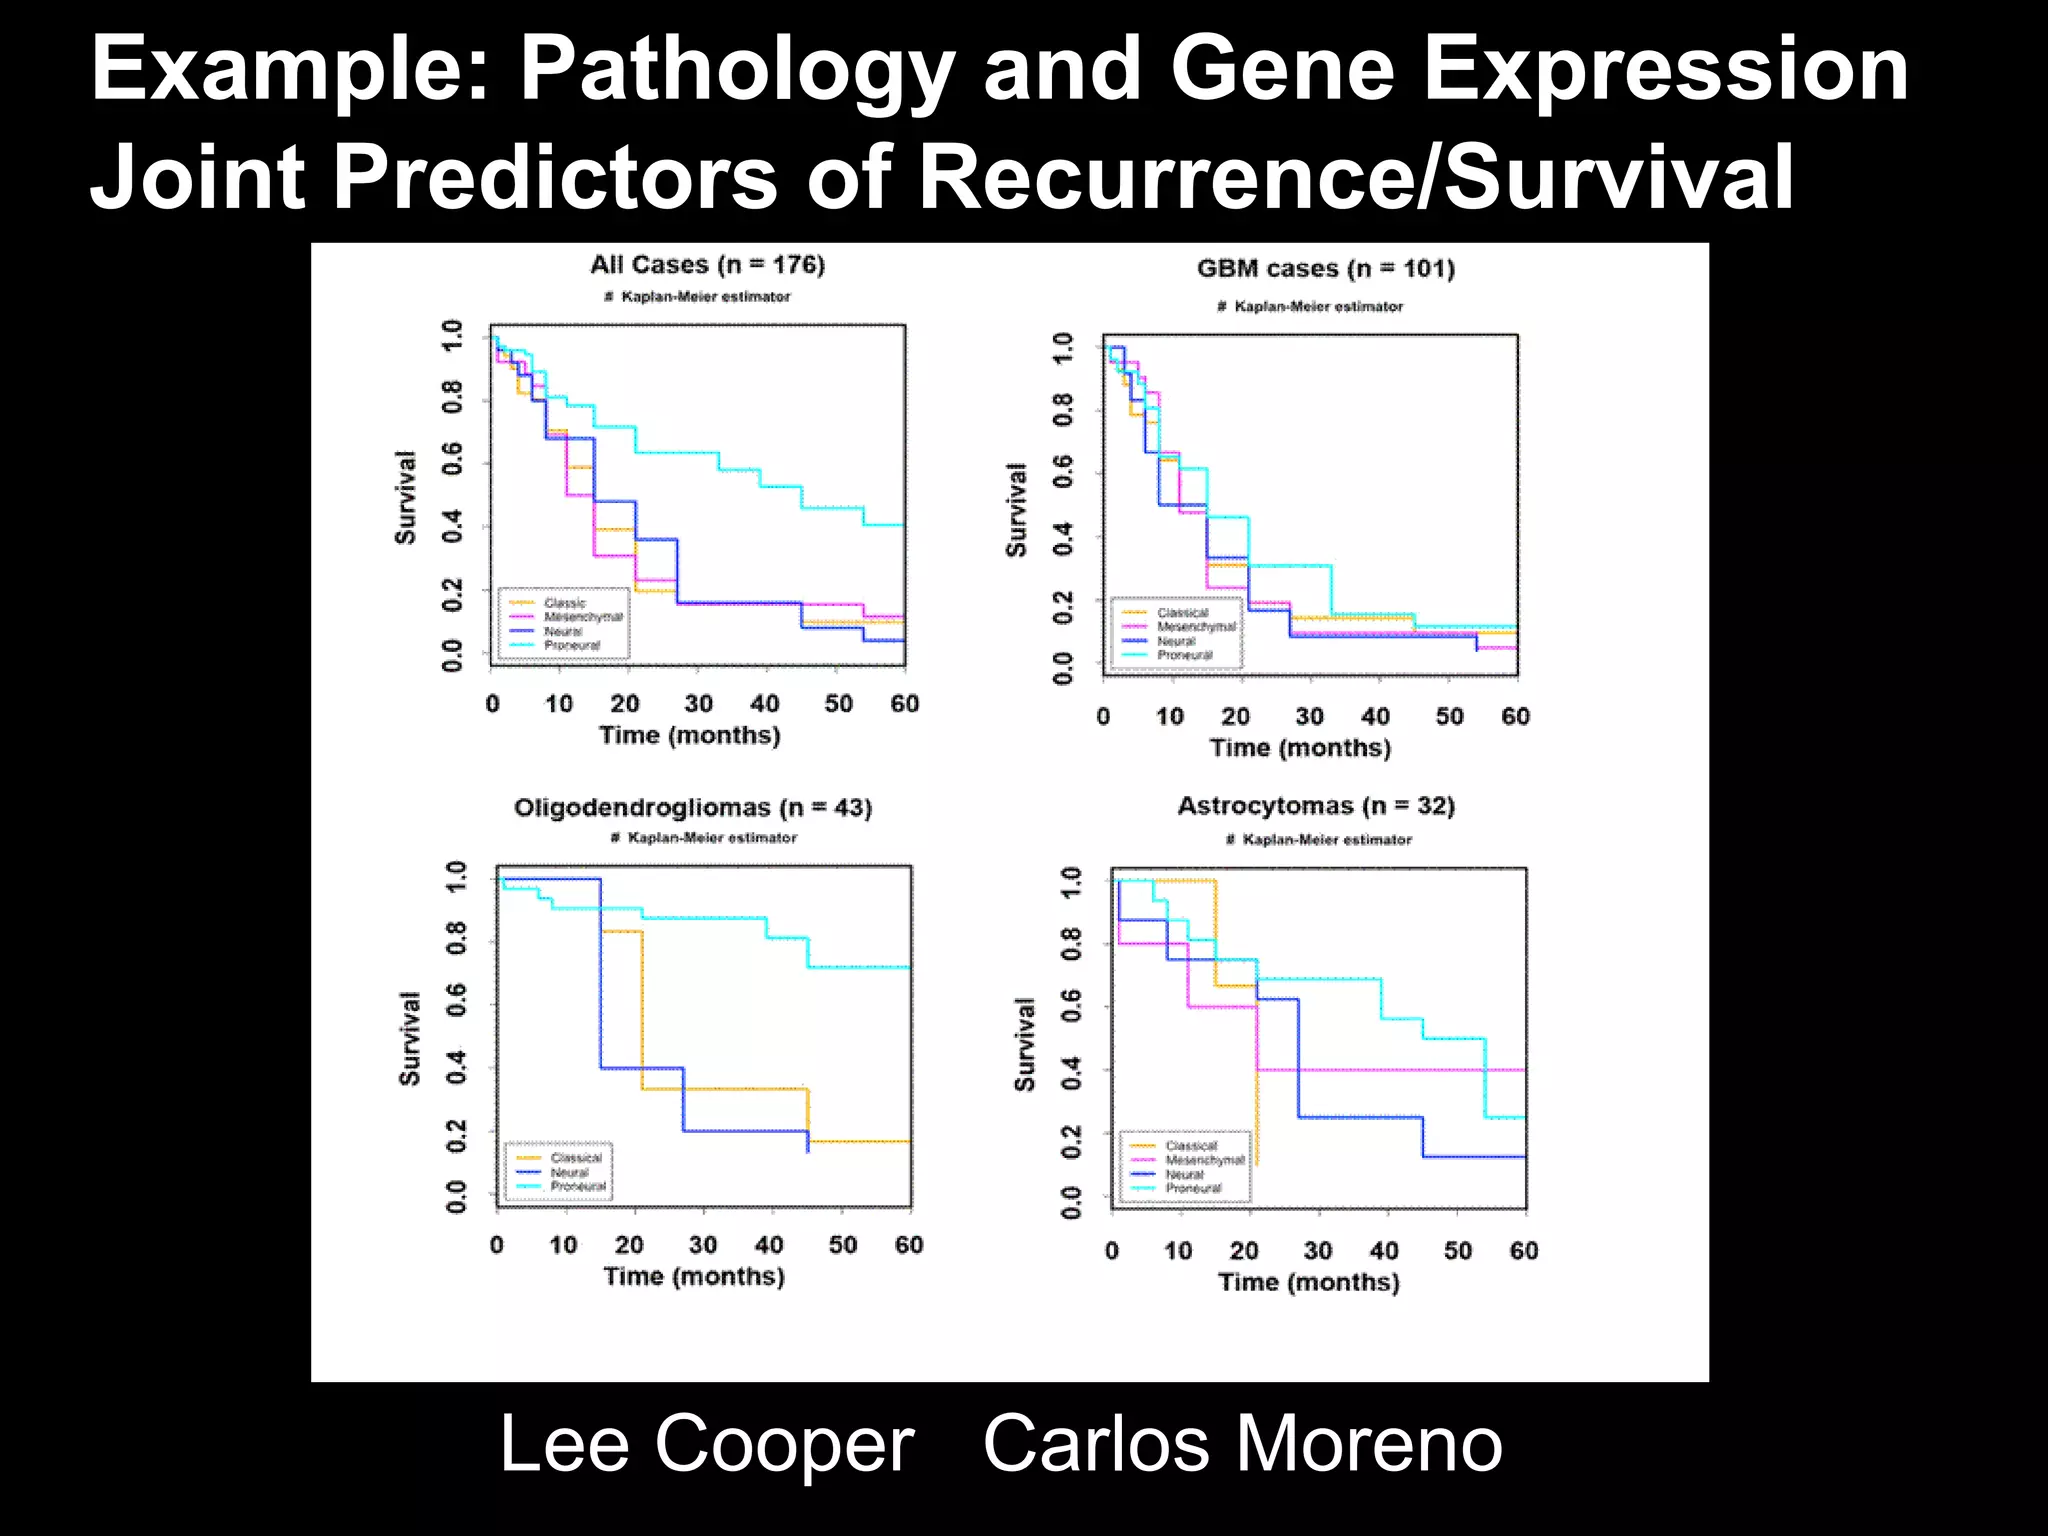
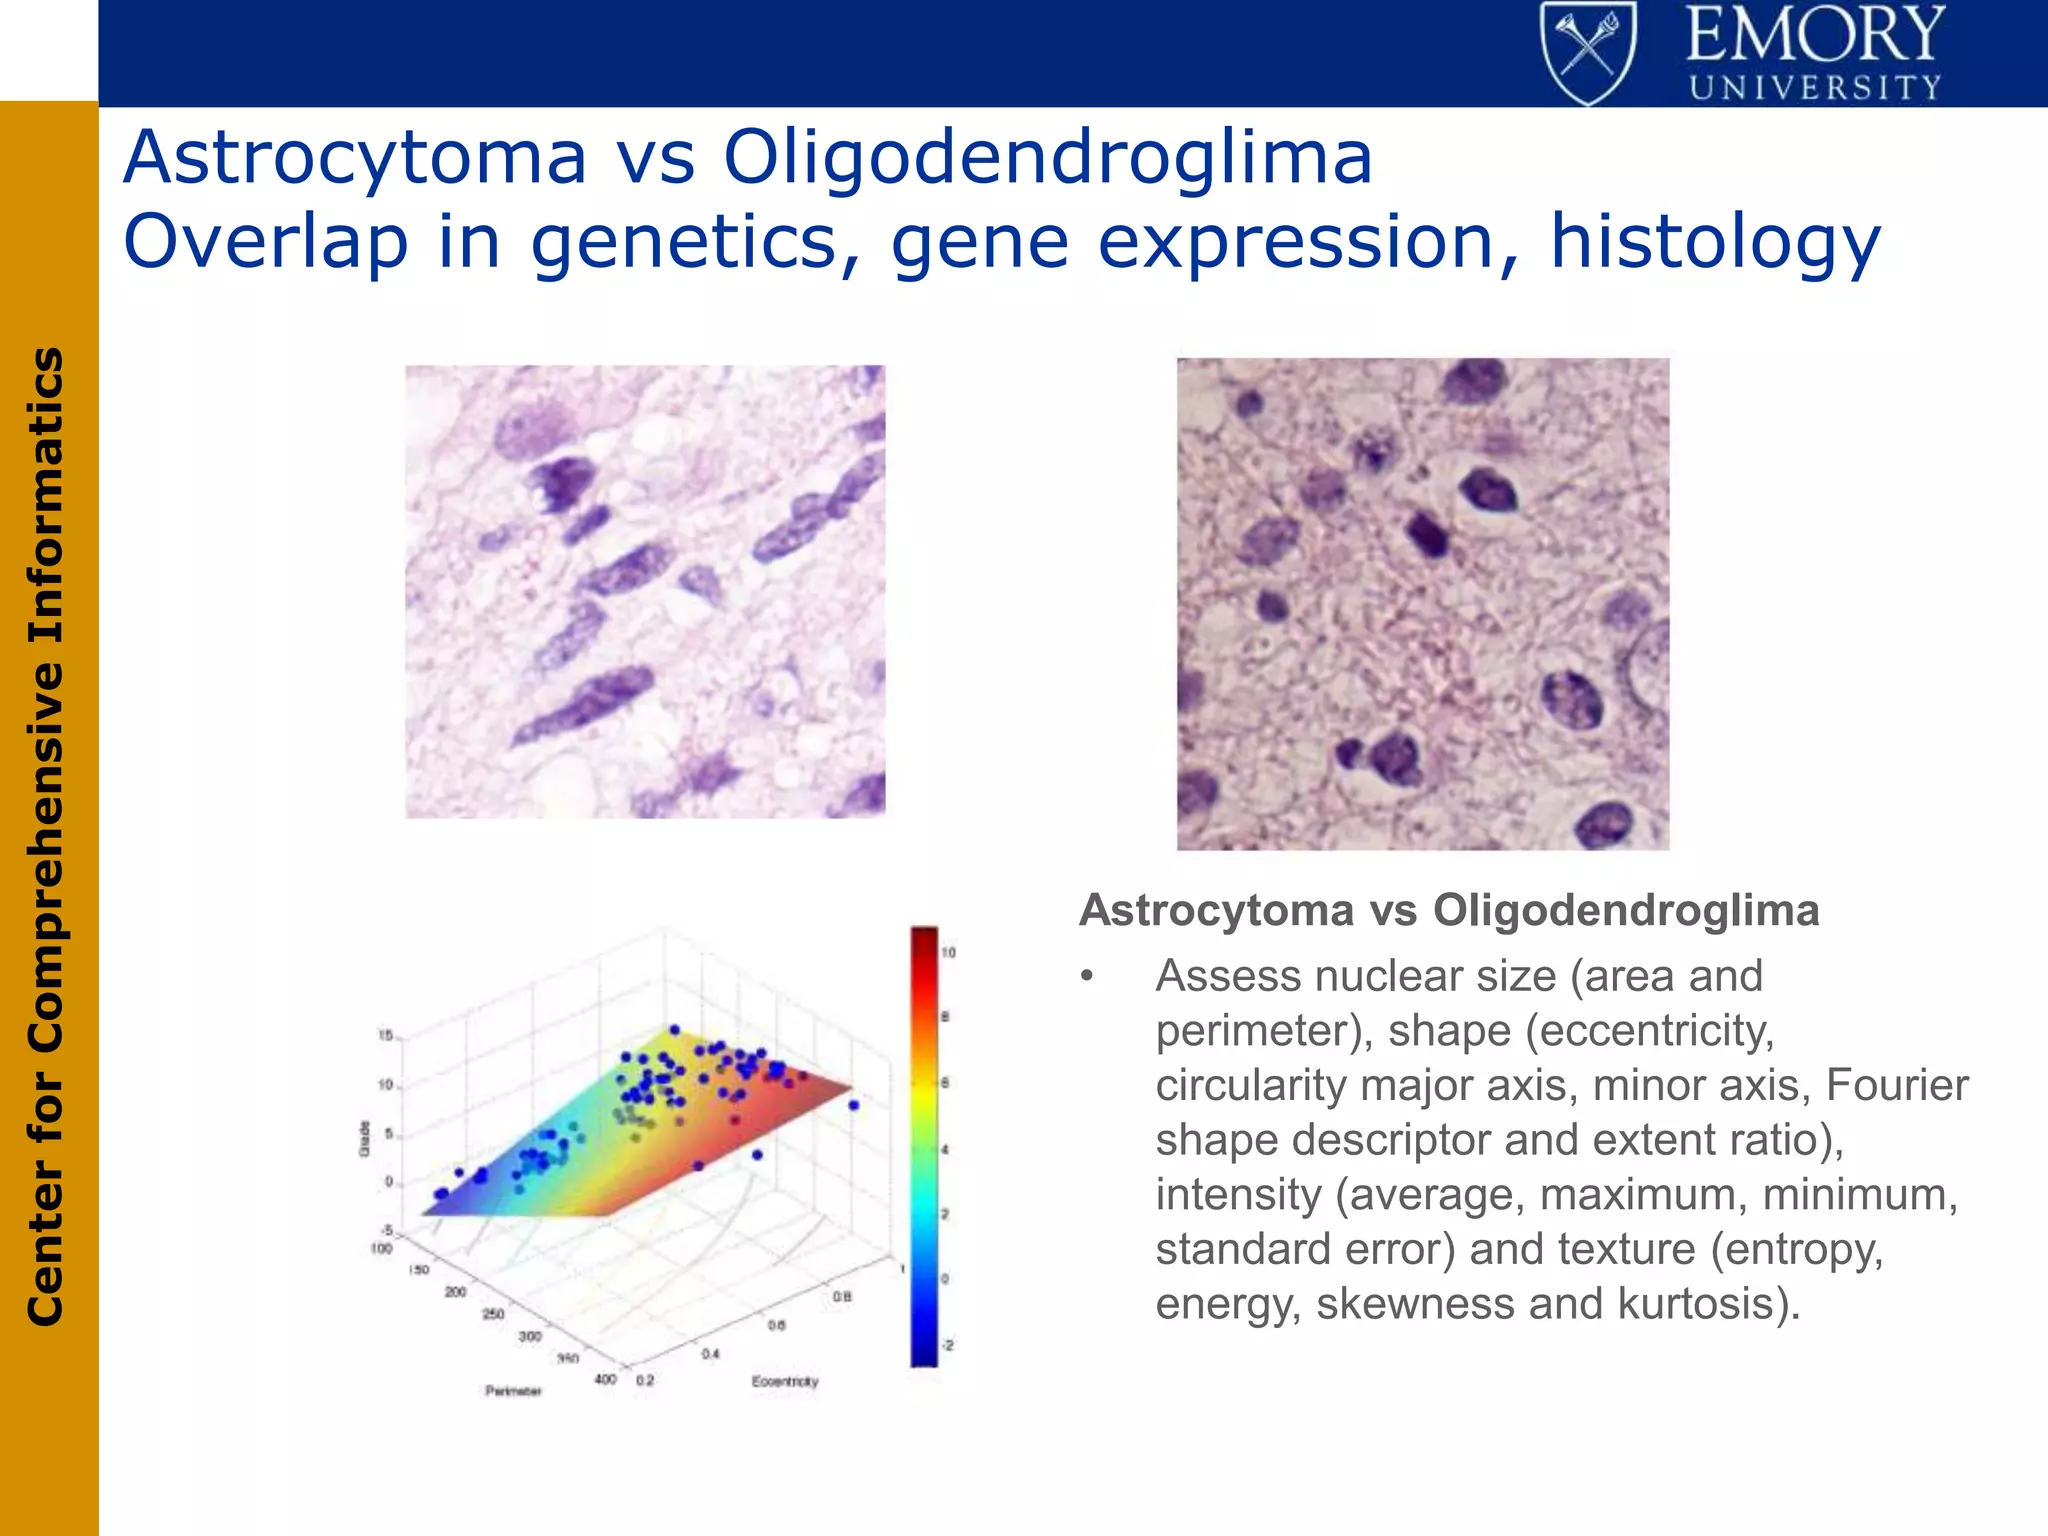
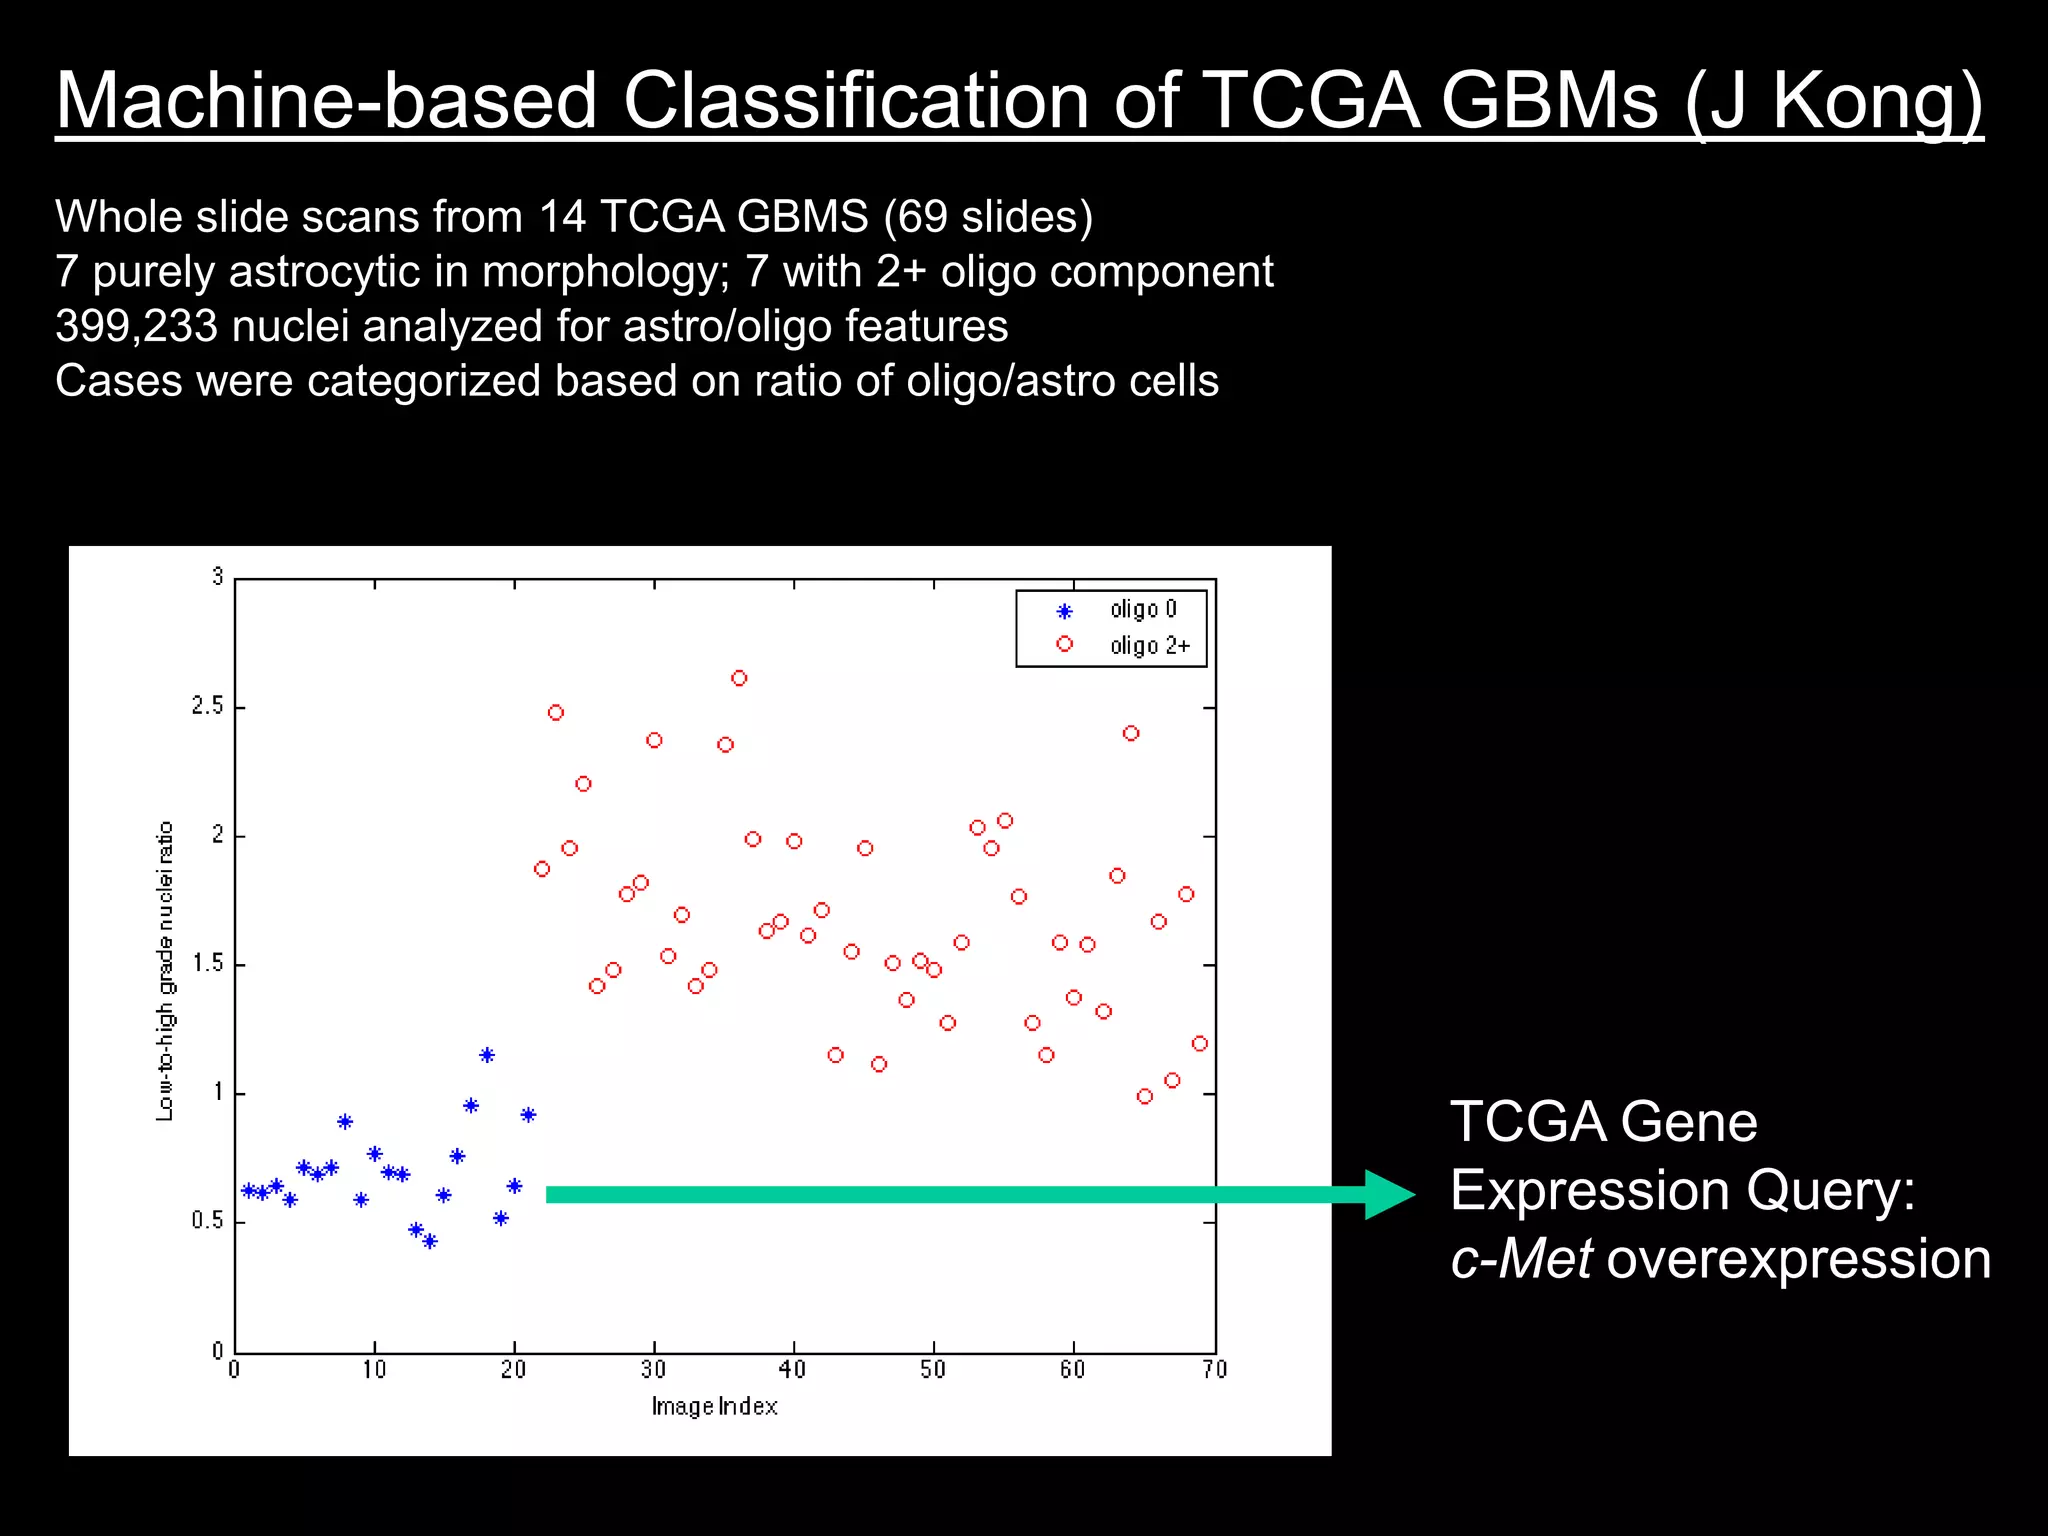
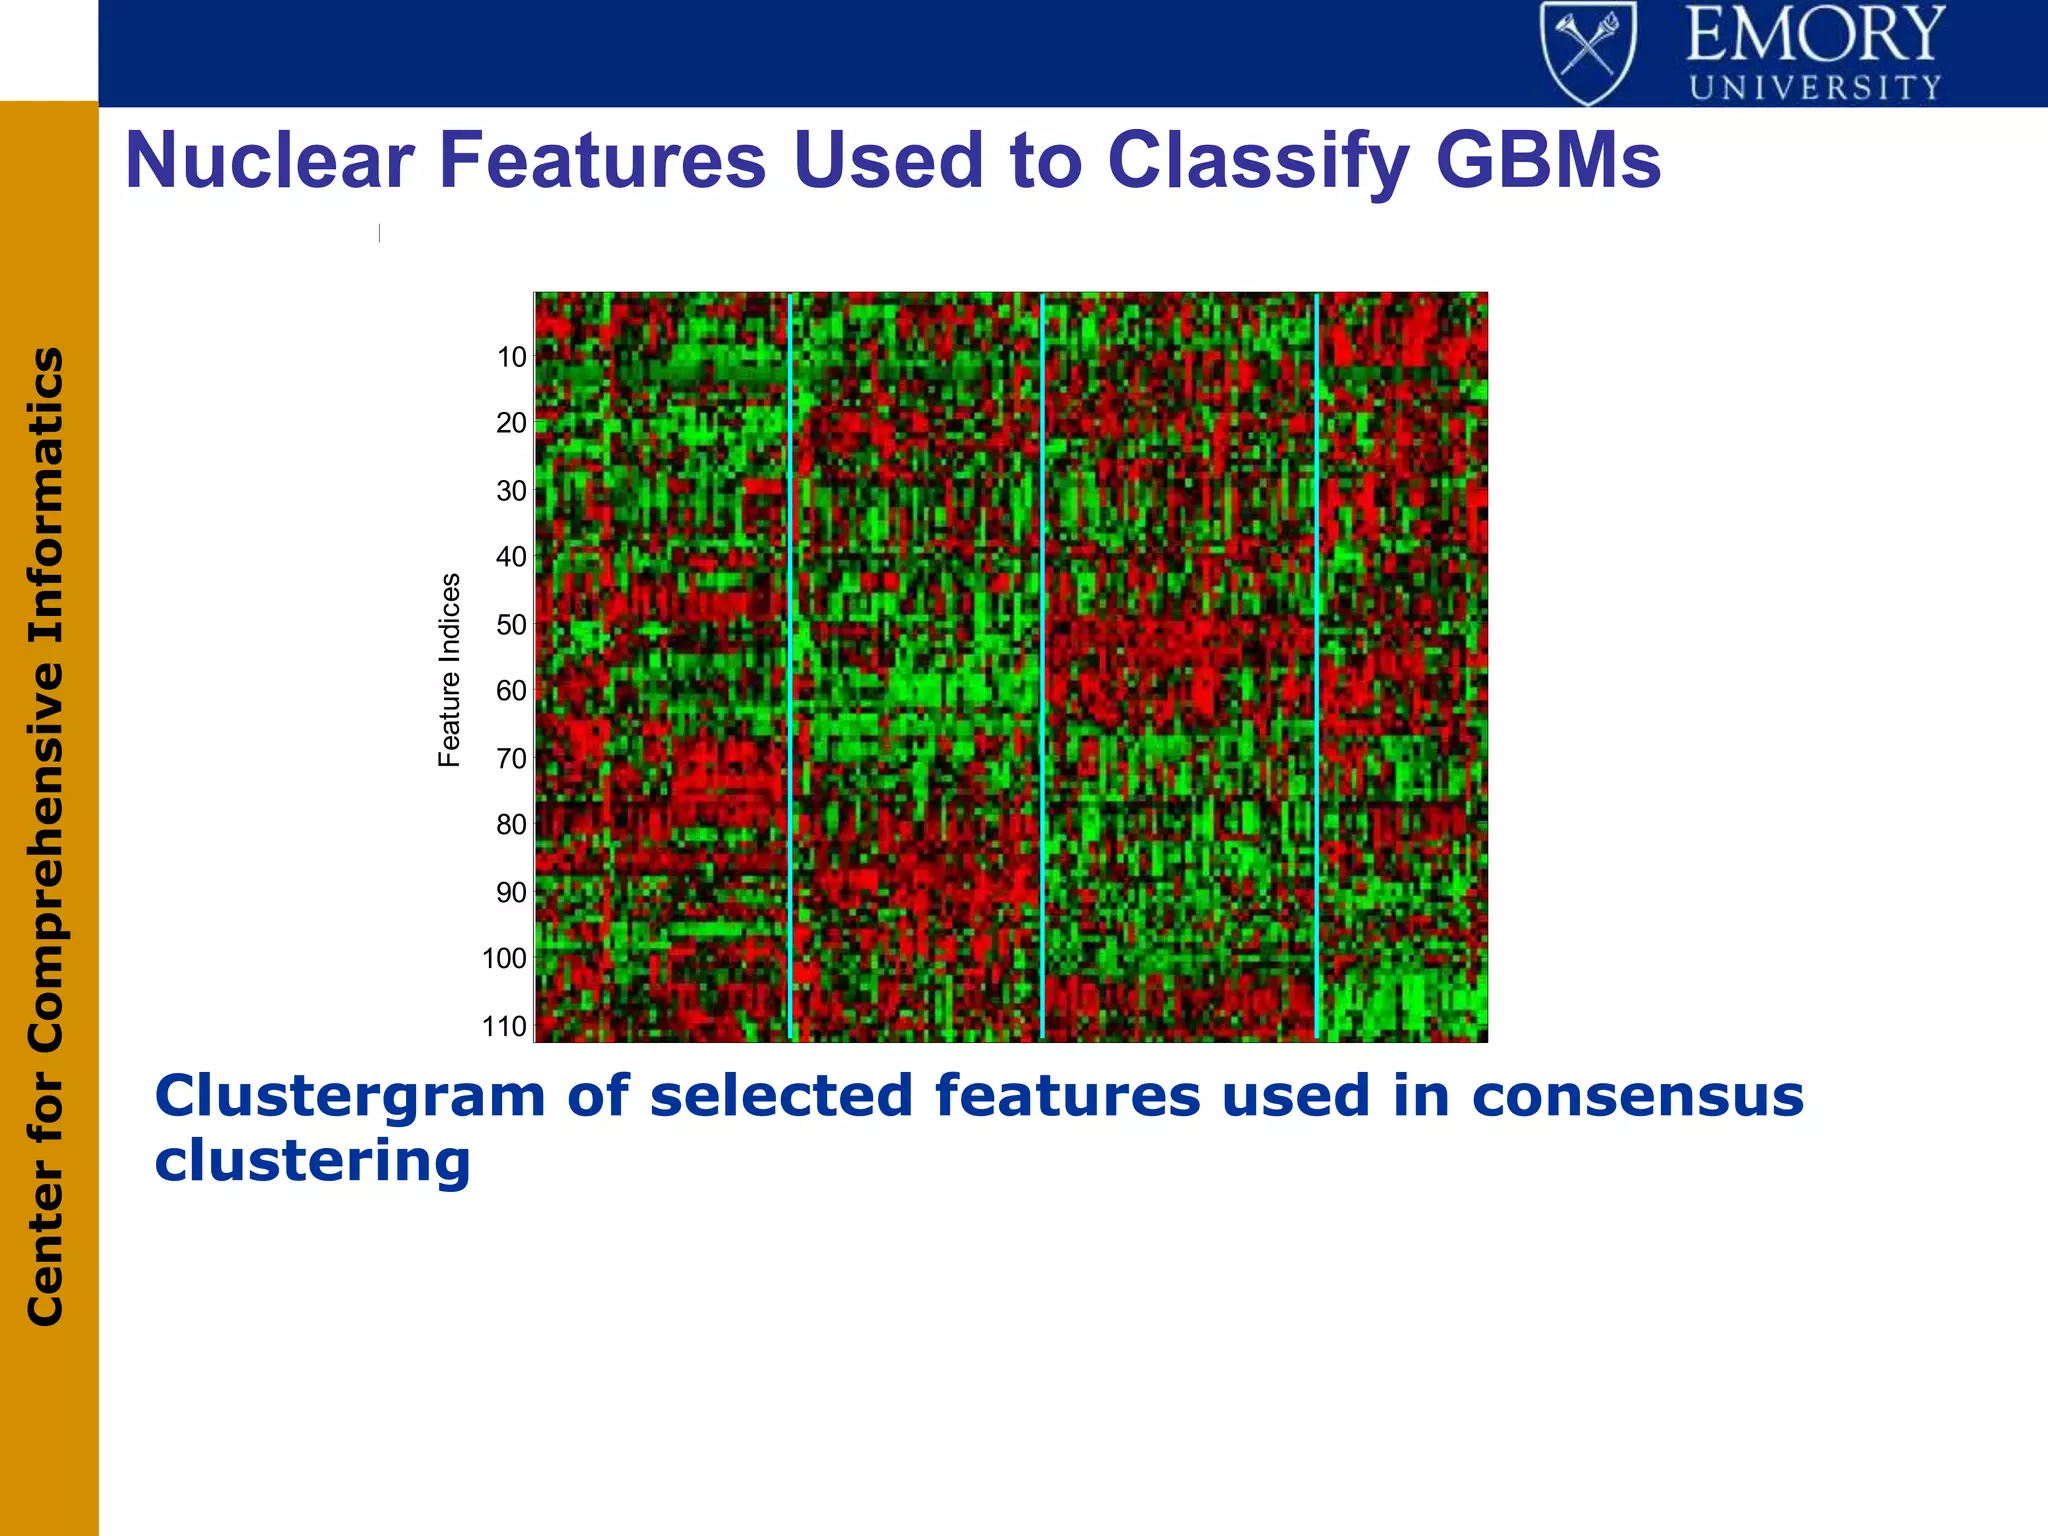
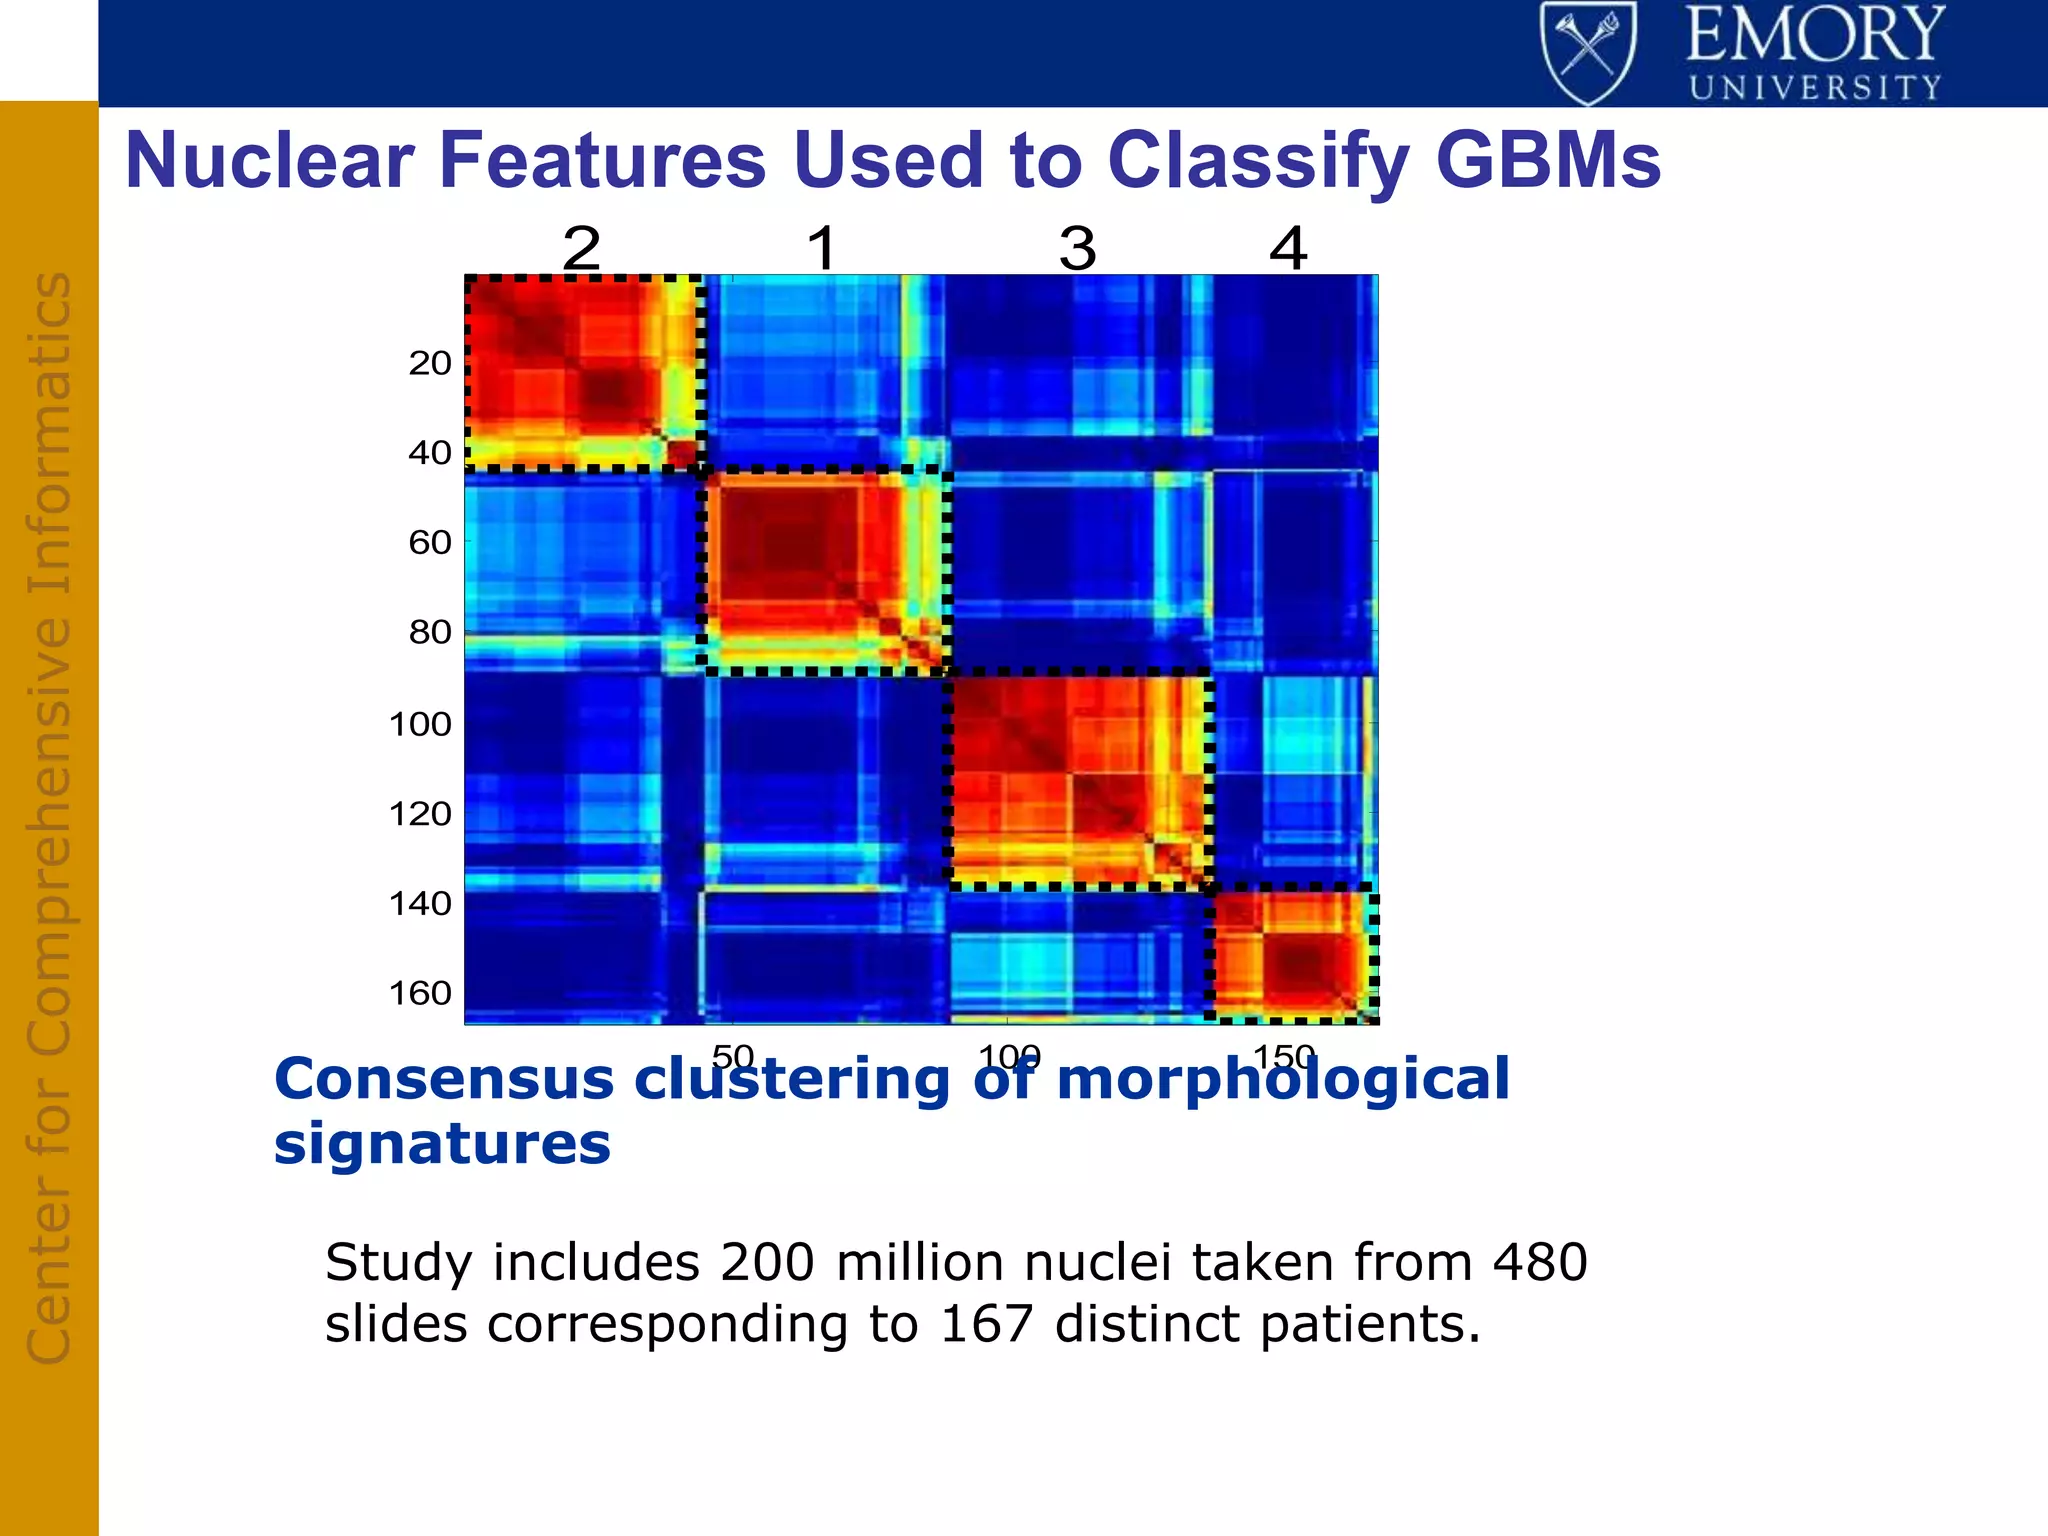
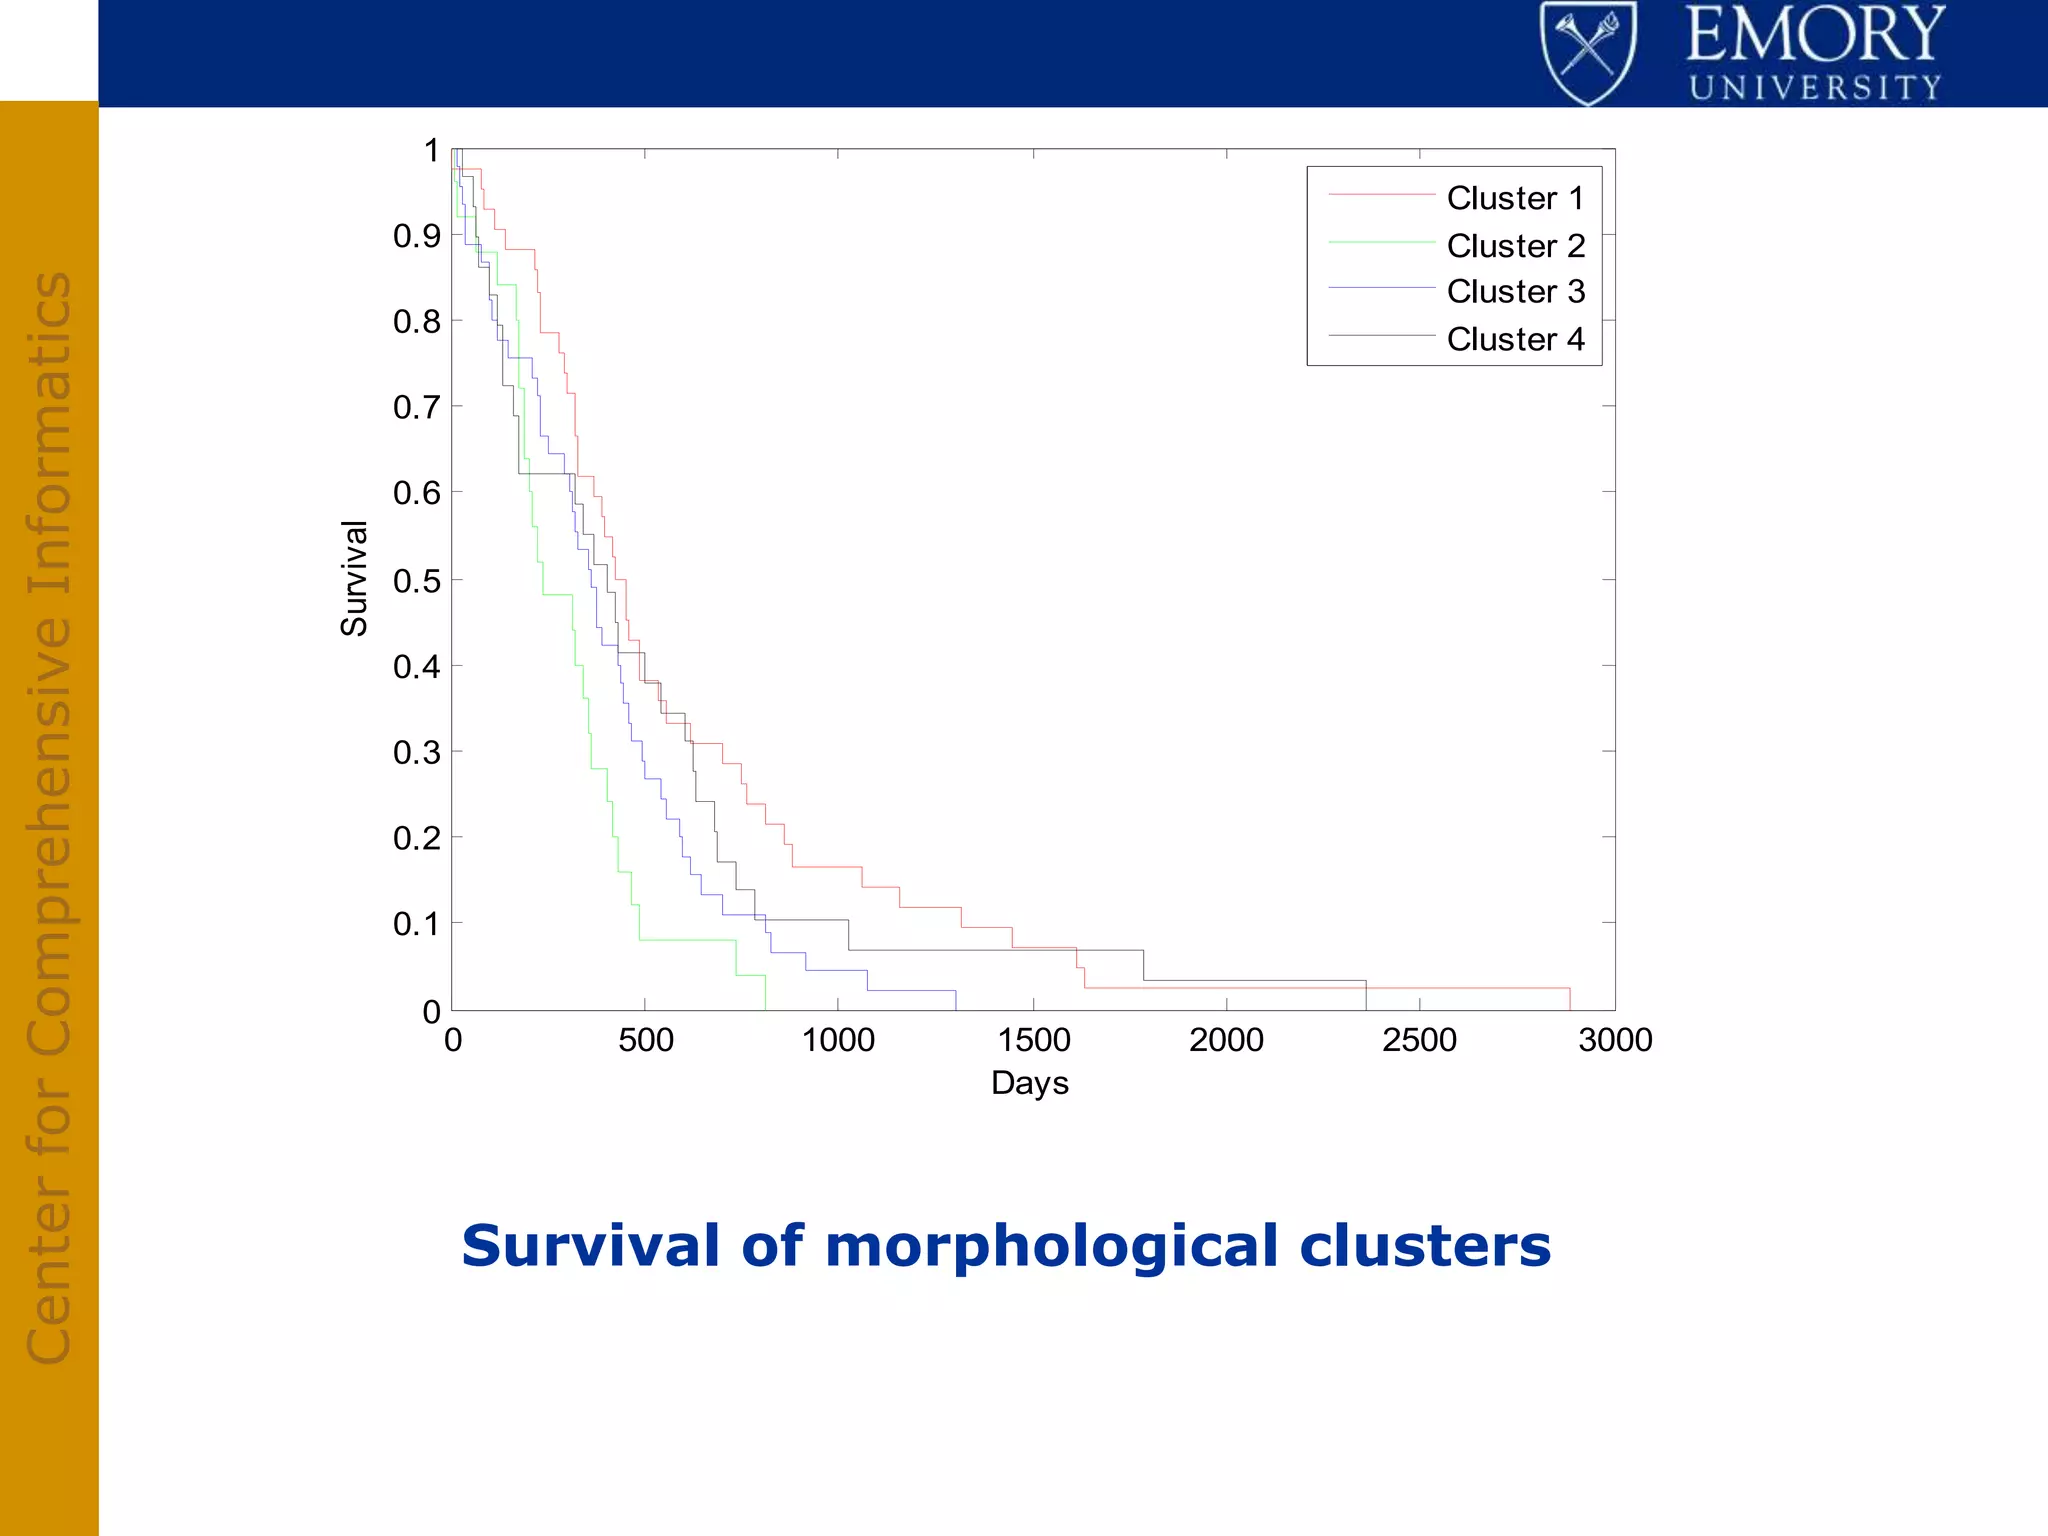
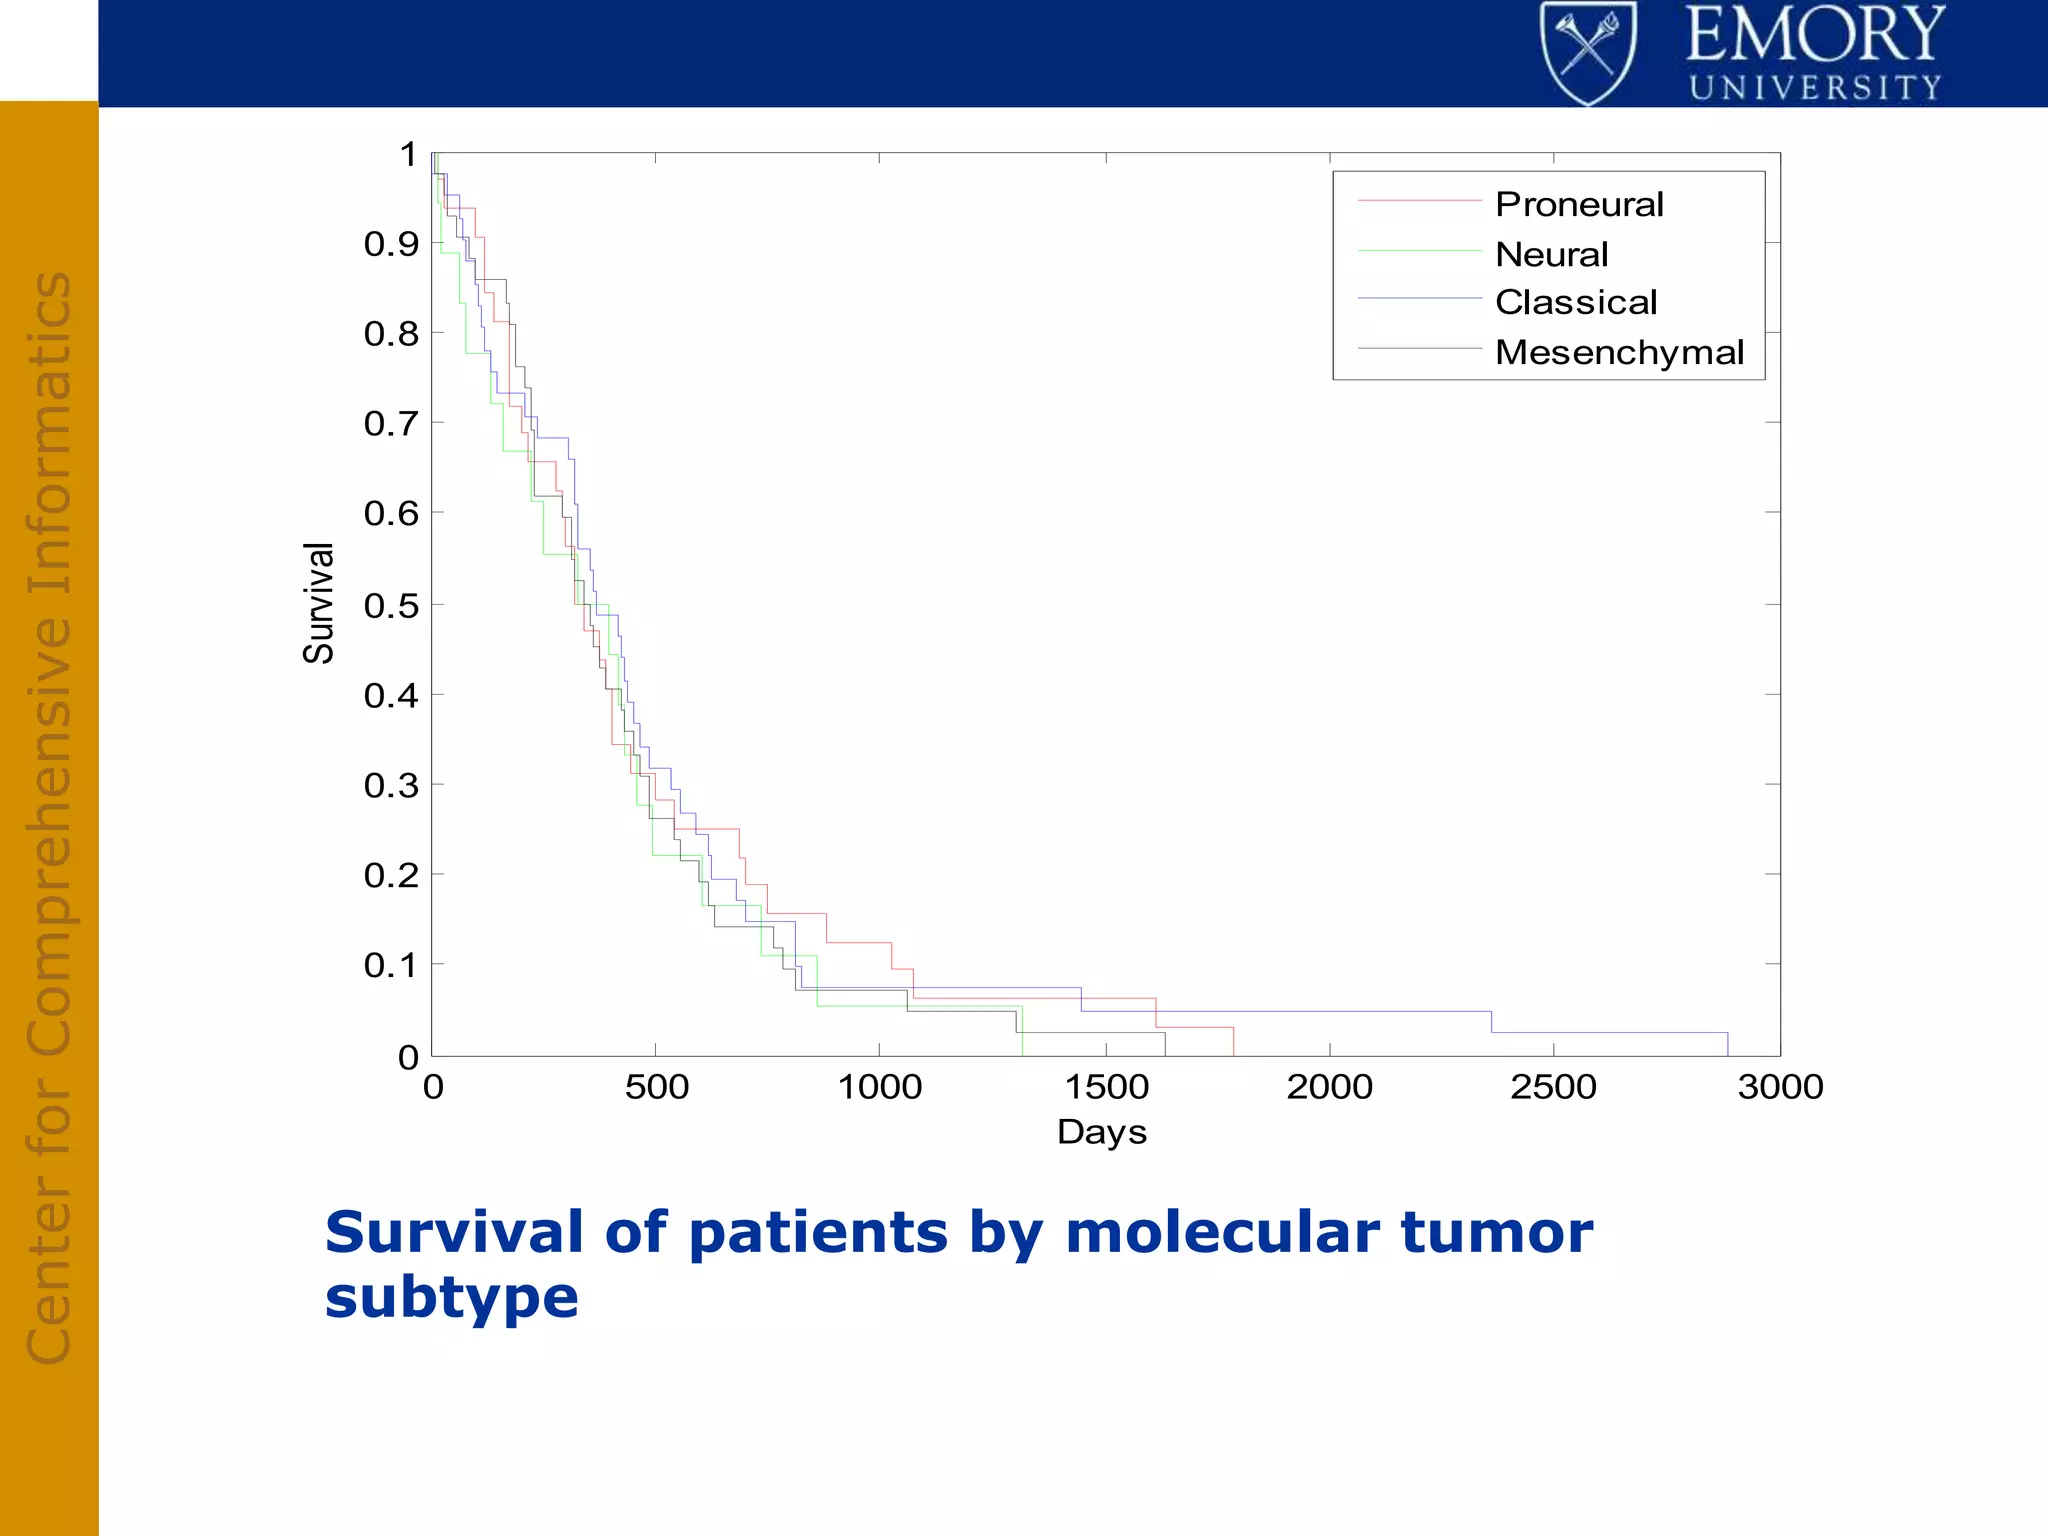
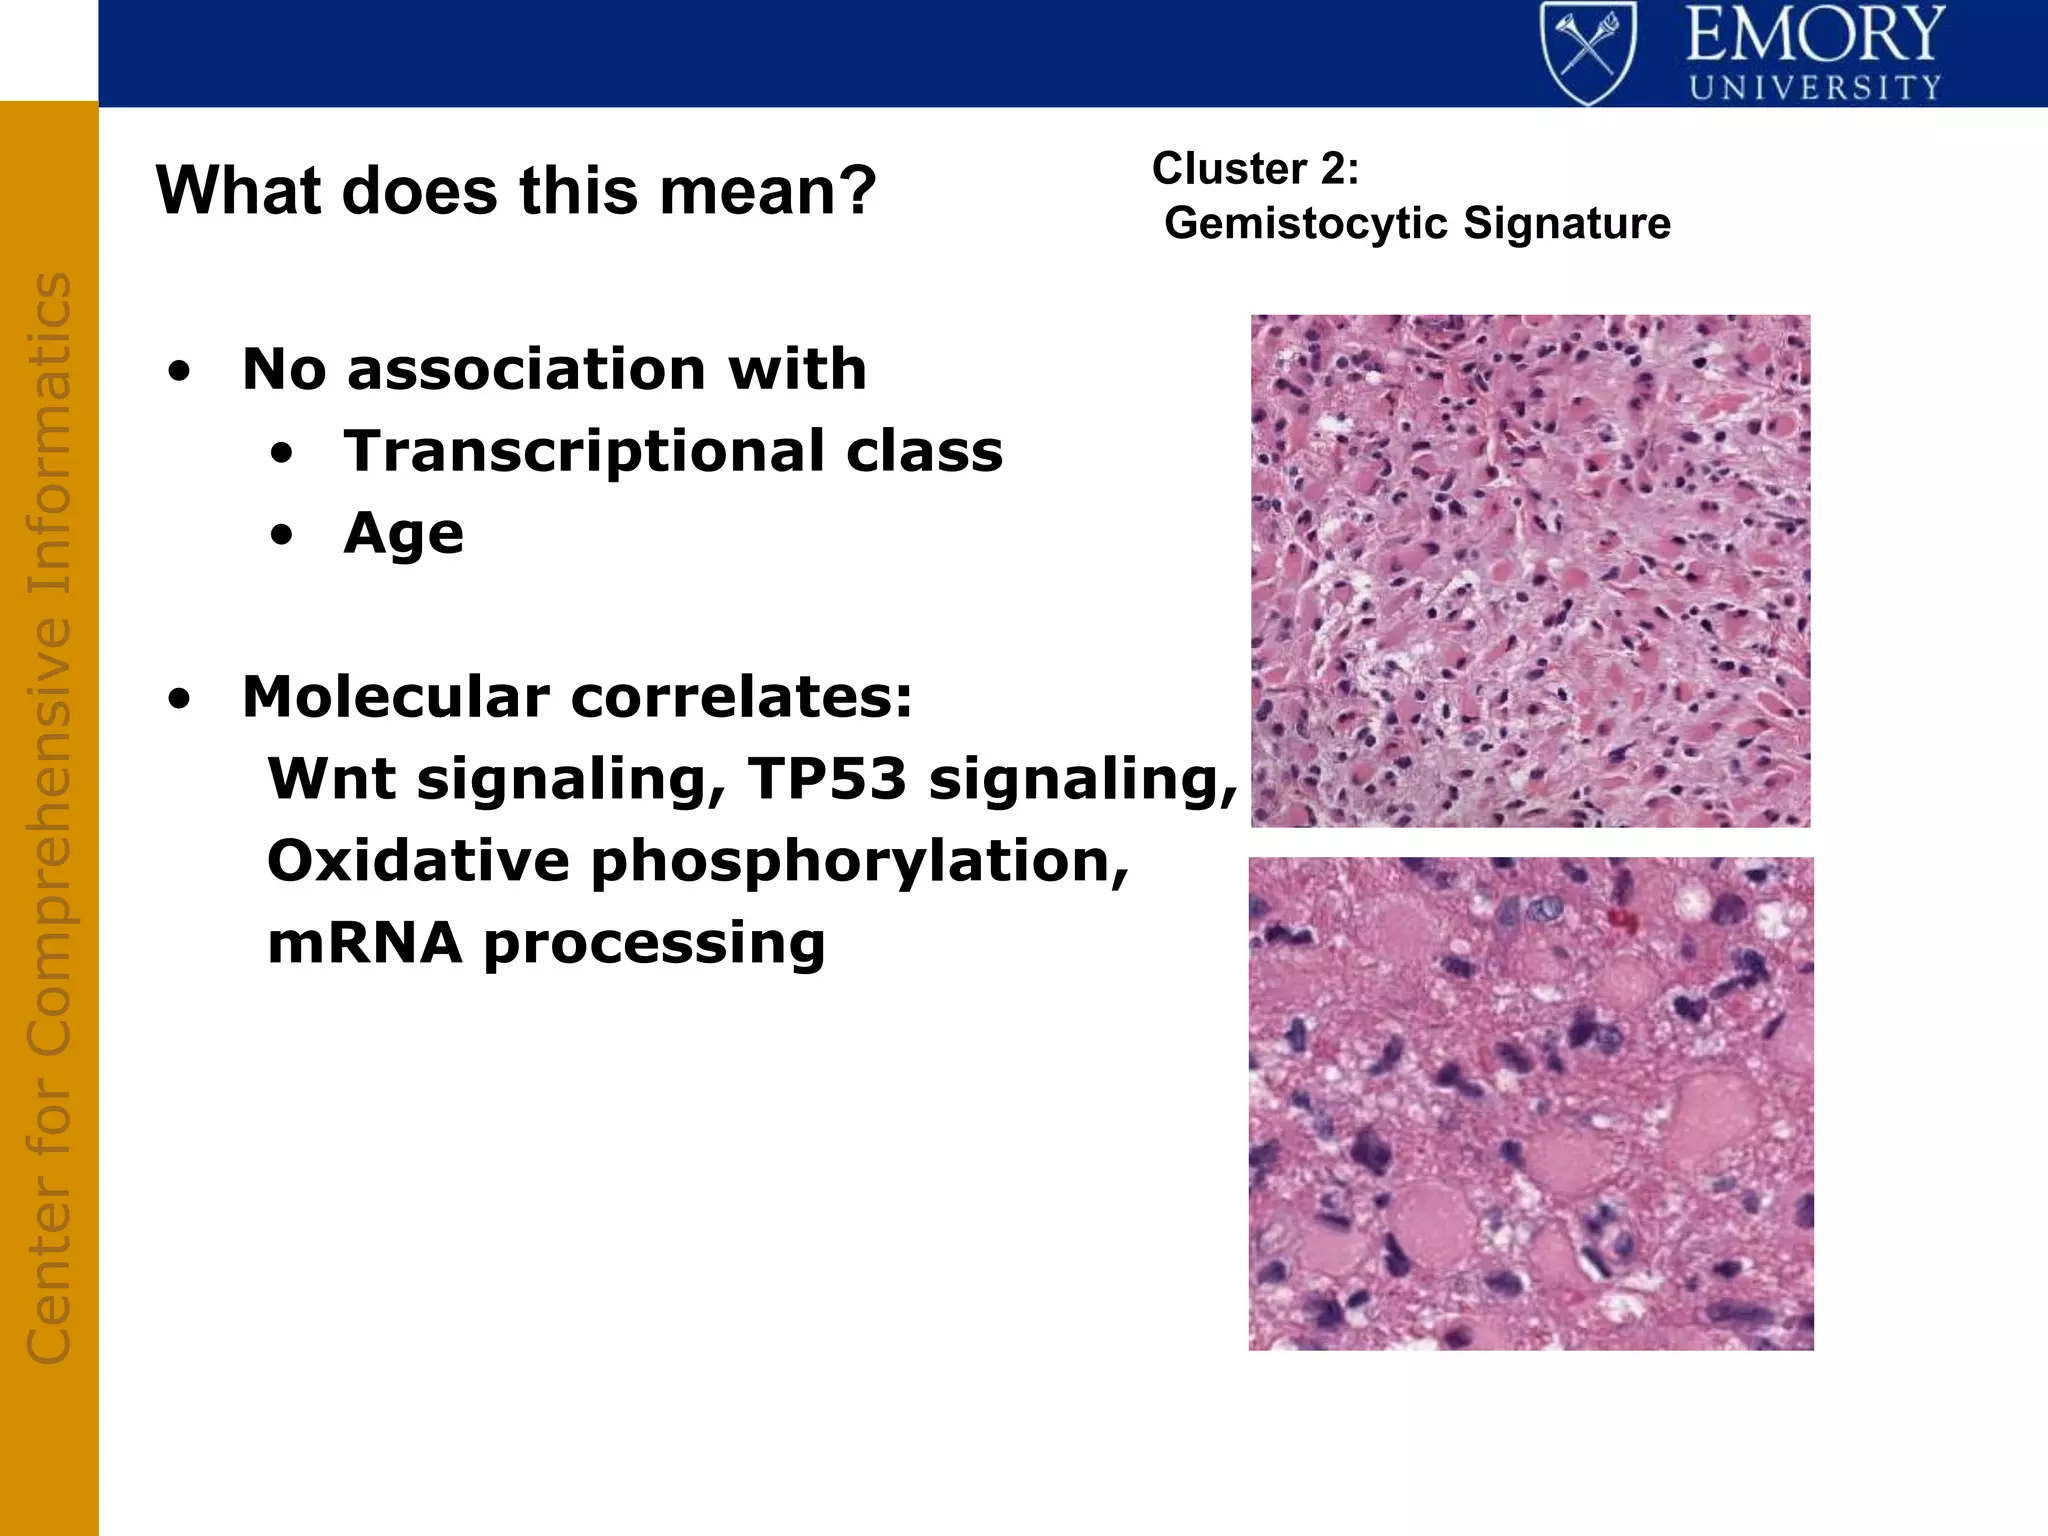


The document discusses the Center for Comprehensive Informatics' efforts in integrative multi-scale biomedical informatics, focusing on analyzing spatial datasets and leveraging exascale data for improved image processing in brain tumor research. It highlights collaborative initiatives in pathology, radiology, and omics, emphasizing the development of data models and management infrastructures for classification and predictive analysis of brain tumors. Key findings include the integration of molecular and imaging data to better understand glioma progression and prognosis, using advanced analytical methods and multi-resolution imaging techniques.