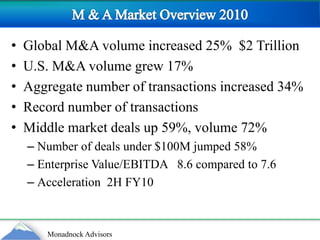
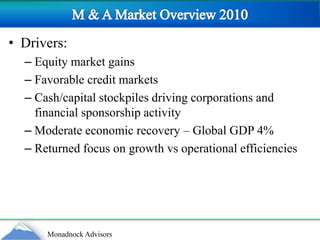
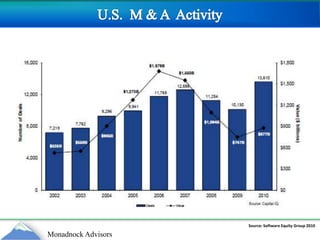
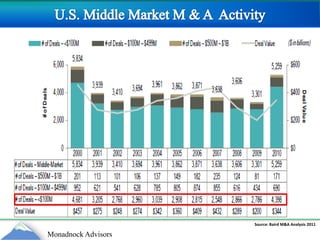
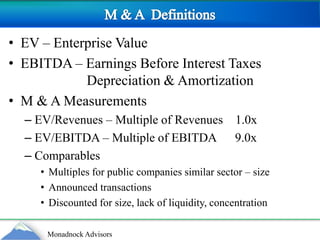
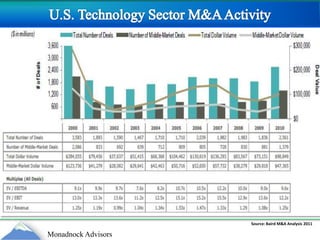
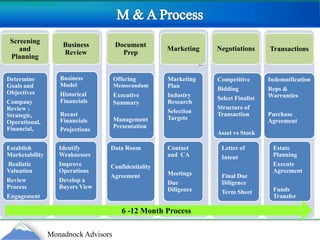
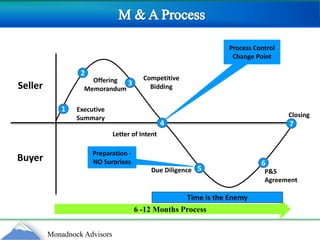
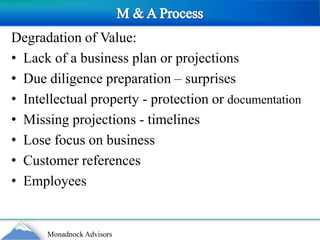
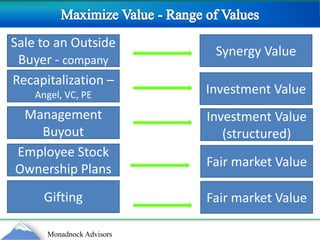
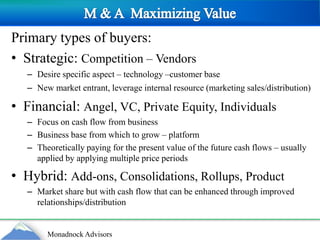
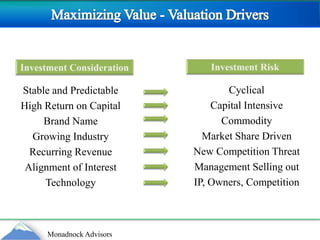
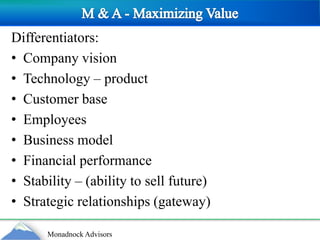
Hank NelsonMonadnock Advisors LLC.Mergers & Acquisitions OverviewMarket Overview – M & A ProcessMaximizing Value
M & A Market Overview 2010Global M&A volume increased 25%  $2 TrillionU.S. M&A volume grew 17%Aggregate number of transactions increased 34%Record number of transactionsMiddle market deals up 59%, volume 72%Number of deals under $100M jumped 58%Enterprise Value/EBITDA   8.6 compared to 7.6Acceleration  2H FY10
M & A Market Overview 2010Drivers:Equity market gainsFavorable credit markets Cash/capital stockpiles driving corporations and financial sponsorship activityModerate economic recovery – Global GDP 4%Returned focus on growth vs operational efficiencies
U.S.  M & A  ActivitySource: Software Equity Group 2010
U.S. Middle Market M & A  Activity Source: Baird M&A Analysis 2011
M & A  Definitions EV – Enterprise ValueEBITDA – Earnings Before Interest Taxes                                    Depreciation & AmortizationM & A MeasurementsEV/Revenues – Multiple of Revenues    1.0xEV/EBITDA – Multiple of EBITDA      9.0xComparables Multiples for public companies similar sector – size  Announced transactionsDiscounted for size, lack of liquidity, concentration
U.S. Technology Sector M&A ActivitySource: Baird M&A Analysis 2011
M & A Overview 2011General outlook - continued growth from 2H FY10R. Blair & Co.  “Dollar volumes would be consistent with levels achieved in 2005 record year of the previous M&A recovery.”Pepperdine Survey IB’s – Private Sale Increase 51%Significant Increase 21%Drivers:Strategic buyers flush with cash  $2T in U.S. Co.Modest economic growth projectedM & A perceived as best way for growthFinancial sponsors (PE) opportunitySmaller companies- Make vs. BuyCredit markets in playTiming….
M & A  ProcessRole of the M & A AdvisorQuarterback of Advisory TeamLegal, Tax, Accounting, Wealth MgmtOperations ConsultantStrategy AdvisorPreparation for SaleMarketer of BusinessDeal TechnicianFinancial Advisor
M & A  ProcessM & A Advisor:Cultivate relationship(s) as part of your company development processFree advice – market knowledge, timing, business model Forces outward discussion and viewpointExcellent preparation for first time sellerAbility to respond immediately to any inquiries
M & A Process MarketingMarketingDocument PrepBusiness ReviewNegotiationsScreening and Planning TransactionsBusiness Model Historical FinancialsRecastFinancials ProjectionsOffering MemorandumExecutive SummaryManagement PresentationMarketing PlanIndustry ResearchSelection TargetsDetermine Goals and ObjectivesCompany  Review : Strategic, Operational, Financial, CompetitiveBiddingSelect FinalistStructure of TransactionAsset vs StockIndemnification Reps & WarrantiesPurchase Agreement Identify Weaknesses Improve OperationsDevelop a Buyers ViewData Room ConfidentialityAgreementEstate PlanningExecute AgreementFunds TransferLetter ofIntentFinal Due DiligenceTerm Sheet TaxesContact and  CAMeetingsDue  DiligenceEstablish Marketability  Realistic Valuation Review  ProcessEngagement6 -12 Month Process
 M & A ProcessProcess Control Change Point 2Competitive Bidding Offering Memorandum Seller3Executive Summary1Closing47Letter of Intent Preparation -NO SurprisesBuyer65Due Diligence P&S  Agreement Time is the Enemy6 -12 Months Process
M & A ProcessDegradation of Value:Lack of a business plan or projectionsDue diligence preparation – surprisesIntellectual property - protection or documentationMissing projections - timelinesLose focus on businessCustomer referencesEmployees
Maximize Value - Range of ValuesSynergy ValueSale to an Outside Buyer - company Recapitalization –Angel, VC, PEInvestment ValueManagement BuyoutInvestment Value (structured)Employee Stock Ownership PlansFair market ValueGiftingFair market Value
M & A  Maximizing ValuePrimary types of buyers:Strategic: Competition – Vendors Desire specific aspect – technology –customer baseNew market entrant, leverage internal resource (marketing sales/distribution)Financial: Angel, VC, Private Equity, Individuals Focus on cash flow from businessBusiness base from which to grow – platformTheoretically paying for the present value of the future cash flows – usually applied by applying multiple price periodsHybrid: Add-ons, Consolidations, Rollups, ProductMarket share but with cash flow that can be enhanced through improved relationships/distribution
Risk vs. Return by Investor Class                             Risk Angel Investor VC InvestorPE InvestorStrategic BuyerMultiple
Risk Assessment = EBITDA Multiple Private Business – Growing -Mature 10012%10017%=  5.9x=  8.3xHigher Risk Assessment by buyer will generate a lower EBITDA Multiple Private Business – Mid Stage/SMB 10035% 10025%=  2.9x=  4.0x
Maximizing Value - Valuation Drivers Investment RiskInvestment ConsiderationCyclicalCapital IntensiveCommodityMarket Share DrivenNew Competition ThreatManagement Selling outIP, Owners, CompetitionStable and Predictable High Return on CapitalBrand NameGrowing IndustryRecurring RevenueAlignment of InterestTechnology
M & A - Maximizing ValueDifferentiators:Company visionTechnology – productCustomer baseEmployeesBusiness modelFinancial performanceStability – (ability to sell future)Strategic relationships (gateway)
M & A  Maximizing ValueMarket Reality for the Entrepreneur:Companies no longer look at one opportunity to satisfy needs, but evaluate, compare, assigning weighted value and riskLarge companies are presented hundreds or more opportunities a month for 5- 15 deals a yearNeed to differentiateMarket is usually the determinant of time to sell
M & A             M & A is a process not an event                             Hank Nelson                   Monadnock Advisors LLC.hnelson@monadnockadvisors.netwww.monadnockadvisors.net

Mergers & Acquisitions Overview: Market, Process and Maximizing Your Value

  • 1.
    Hank NelsonMonadnock AdvisorsLLC.Mergers & Acquisitions OverviewMarket Overview – M & A ProcessMaximizing Value
  • 2.
    M & AMarket Overview 2010Global M&A volume increased 25% $2 TrillionU.S. M&A volume grew 17%Aggregate number of transactions increased 34%Record number of transactionsMiddle market deals up 59%, volume 72%Number of deals under $100M jumped 58%Enterprise Value/EBITDA 8.6 compared to 7.6Acceleration 2H FY10
  • 3.
    M & AMarket Overview 2010Drivers:Equity market gainsFavorable credit markets Cash/capital stockpiles driving corporations and financial sponsorship activityModerate economic recovery – Global GDP 4%Returned focus on growth vs operational efficiencies
  • 4.
    U.S. M& A ActivitySource: Software Equity Group 2010
  • 5.
    U.S. Middle MarketM & A Activity Source: Baird M&A Analysis 2011
  • 6.
    M & A Definitions EV – Enterprise ValueEBITDA – Earnings Before Interest Taxes Depreciation & AmortizationM & A MeasurementsEV/Revenues – Multiple of Revenues 1.0xEV/EBITDA – Multiple of EBITDA 9.0xComparables Multiples for public companies similar sector – size Announced transactionsDiscounted for size, lack of liquidity, concentration
  • 7.
    U.S. Technology SectorM&A ActivitySource: Baird M&A Analysis 2011
  • 8.
    M & AOverview 2011General outlook - continued growth from 2H FY10R. Blair & Co. “Dollar volumes would be consistent with levels achieved in 2005 record year of the previous M&A recovery.”Pepperdine Survey IB’s – Private Sale Increase 51%Significant Increase 21%Drivers:Strategic buyers flush with cash $2T in U.S. Co.Modest economic growth projectedM & A perceived as best way for growthFinancial sponsors (PE) opportunitySmaller companies- Make vs. BuyCredit markets in playTiming….
  • 9.
    M & A ProcessRole of the M & A AdvisorQuarterback of Advisory TeamLegal, Tax, Accounting, Wealth MgmtOperations ConsultantStrategy AdvisorPreparation for SaleMarketer of BusinessDeal TechnicianFinancial Advisor
  • 10.
    M & A ProcessM & A Advisor:Cultivate relationship(s) as part of your company development processFree advice – market knowledge, timing, business model Forces outward discussion and viewpointExcellent preparation for first time sellerAbility to respond immediately to any inquiries
  • 11.
    M & AProcess MarketingMarketingDocument PrepBusiness ReviewNegotiationsScreening and Planning TransactionsBusiness Model Historical FinancialsRecastFinancials ProjectionsOffering MemorandumExecutive SummaryManagement PresentationMarketing PlanIndustry ResearchSelection TargetsDetermine Goals and ObjectivesCompany Review : Strategic, Operational, Financial, CompetitiveBiddingSelect FinalistStructure of TransactionAsset vs StockIndemnification Reps & WarrantiesPurchase Agreement Identify Weaknesses Improve OperationsDevelop a Buyers ViewData Room ConfidentialityAgreementEstate PlanningExecute AgreementFunds TransferLetter ofIntentFinal Due DiligenceTerm Sheet TaxesContact and CAMeetingsDue DiligenceEstablish Marketability Realistic Valuation Review ProcessEngagement6 -12 Month Process
  • 12.
    M &A ProcessProcess Control Change Point 2Competitive Bidding Offering Memorandum Seller3Executive Summary1Closing47Letter of Intent Preparation -NO SurprisesBuyer65Due Diligence P&S Agreement Time is the Enemy6 -12 Months Process
  • 13.
    M & AProcessDegradation of Value:Lack of a business plan or projectionsDue diligence preparation – surprisesIntellectual property - protection or documentationMissing projections - timelinesLose focus on businessCustomer referencesEmployees
  • 14.
    Maximize Value -Range of ValuesSynergy ValueSale to an Outside Buyer - company Recapitalization –Angel, VC, PEInvestment ValueManagement BuyoutInvestment Value (structured)Employee Stock Ownership PlansFair market ValueGiftingFair market Value
  • 15.
    M & A Maximizing ValuePrimary types of buyers:Strategic: Competition – Vendors Desire specific aspect – technology –customer baseNew market entrant, leverage internal resource (marketing sales/distribution)Financial: Angel, VC, Private Equity, Individuals Focus on cash flow from businessBusiness base from which to grow – platformTheoretically paying for the present value of the future cash flows – usually applied by applying multiple price periodsHybrid: Add-ons, Consolidations, Rollups, ProductMarket share but with cash flow that can be enhanced through improved relationships/distribution
  • 16.
    Risk vs. Returnby Investor Class Risk Angel Investor VC InvestorPE InvestorStrategic BuyerMultiple
  • 17.
    Risk Assessment =EBITDA Multiple Private Business – Growing -Mature 10012%10017%= 5.9x= 8.3xHigher Risk Assessment by buyer will generate a lower EBITDA Multiple Private Business – Mid Stage/SMB 10035% 10025%= 2.9x= 4.0x
  • 18.
    Maximizing Value -Valuation Drivers Investment RiskInvestment ConsiderationCyclicalCapital IntensiveCommodityMarket Share DrivenNew Competition ThreatManagement Selling outIP, Owners, CompetitionStable and Predictable High Return on CapitalBrand NameGrowing IndustryRecurring RevenueAlignment of InterestTechnology
  • 19.
    M & A- Maximizing ValueDifferentiators:Company visionTechnology – productCustomer baseEmployeesBusiness modelFinancial performanceStability – (ability to sell future)Strategic relationships (gateway)
  • 20.
    M & A Maximizing ValueMarket Reality for the Entrepreneur:Companies no longer look at one opportunity to satisfy needs, but evaluate, compare, assigning weighted value and riskLarge companies are presented hundreds or more opportunities a month for 5- 15 deals a yearNeed to differentiateMarket is usually the determinant of time to sell
  • 21.
    M & A M & A is a process not an event Hank Nelson Monadnock Advisors LLC.hnelson@monadnockadvisors.netwww.monadnockadvisors.net