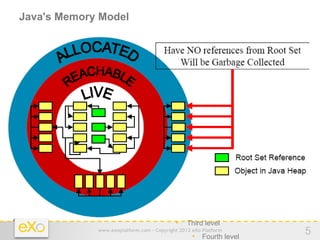
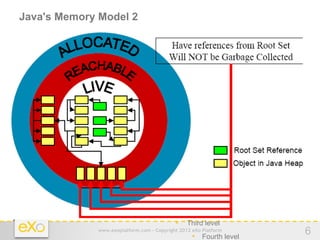
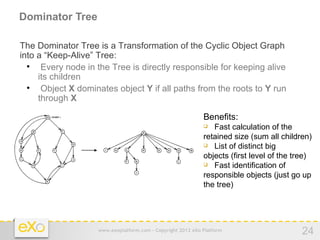
The document outlines steps for analyzing Java heap dumps:
1. Java heap dumps provide a snapshot of objects in memory and can be obtained automatically or on demand.
2. The Eclipse Memory Analyzer (MAT) can be used to analyze heap dumps and identify memory leaks and inefficient object usage.
3. MAT allows examining the size and relationships between objects to understand memory consumption and find the root causes of leaks and bloat.

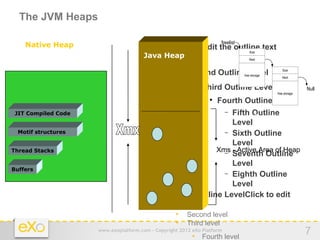
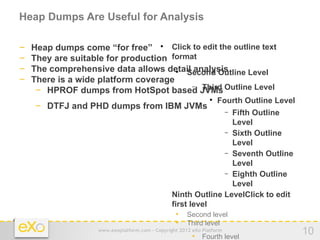

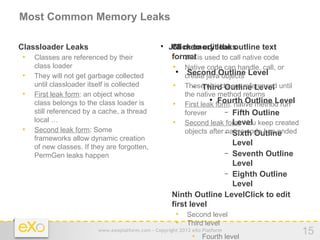
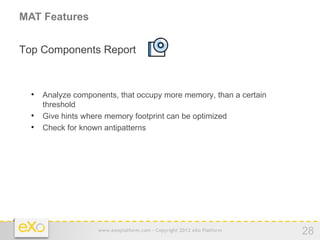
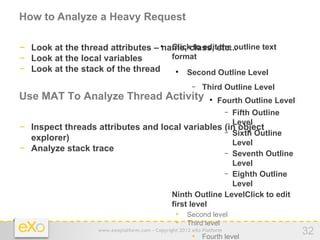
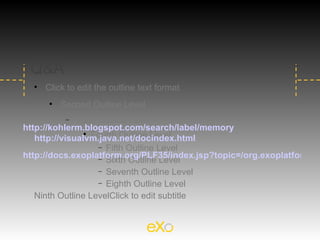
![View of the leaking data structure
Significant entities Leak Root
Click to edit the outline text
MyClass
format Owner
– An owner chain Chain
Container
Second HashSet
Outline Level
– A leak root − Third Outline Level
– A container Leaking HashMap
Fourth Outline Level
Unit
– The unit of the leak −
Fifth Outline
HM$Entry
Level
HM$Entry HM$Entry
– Leak contents − Sixth Outline
Level
String String String
− Seventh Outline
Level
Contents Char[] Char[] Char[]
− Eighth Outline
Level
− Ninth Outline LevelClick to edit
first level
• Second level
• Third level
www.exoplatform.com - Copyright 2012 eXo Platform
• Fourth level
17](https://image.slidesharecdn.com/memoryandruntimeanalysis-120328212300-phpapp02/85/Memory-and-runtime-analysis-17-320.jpg)
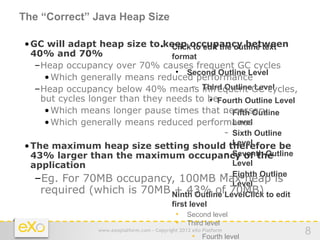
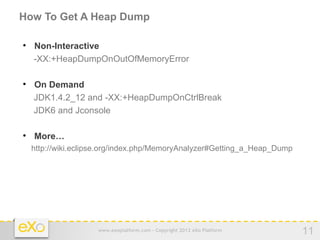
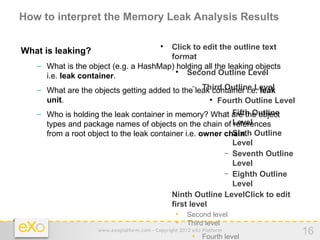
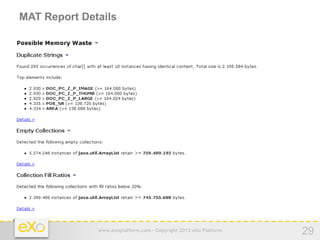
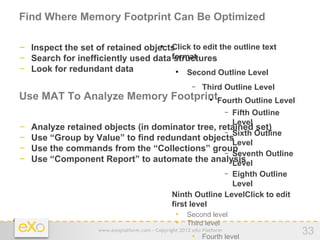
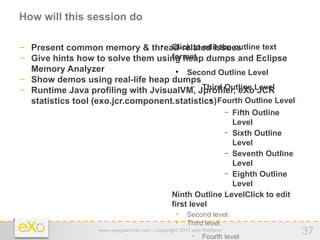
![Memory Leak Example
public class MyClass { Leak
Click to edit the outline text
Root
format
static HashSet myContainer = new HashSet();
Second Outline Level
public void leak(int numObjects) { − Third Outline Level Leak
Container
for (int i = 0; i < numObjects; ++i) {
Fourth Outline Level
String leakingUnit = new String("this is leaking object: " + i);
−
Fifth Outline
myContainer.add(leakingUnit);
Level
}
− Sixth Outline
}
Leaking
public static void main(String[] args) throws Exception {
Level Units
− Seventh Outline
{
Level
MyClass myObj = new MyClass();
− Eighth Outline
myObj.leak(1000000); // 1 million
Level
}
− Ninth Outline LevelClick to edit
System.gc();
first level
}
• Second level
} • Third level
www.exoplatform.com - Copyright 2012 eXo Platform
• Fourth level
18](https://image.slidesharecdn.com/memoryandruntimeanalysis-120328212300-phpapp02/85/Memory-and-runtime-analysis-18-320.jpg)


![ESUG 2009: [Project planning], by Tim Mackinnon](https://cdn.slidesharecdn.com/ss_thumbnails/esug2009-planning-251028124040-b55d3034-thumbnail.jpg?width=640&height=640&fit=bounds)