Download to read offline
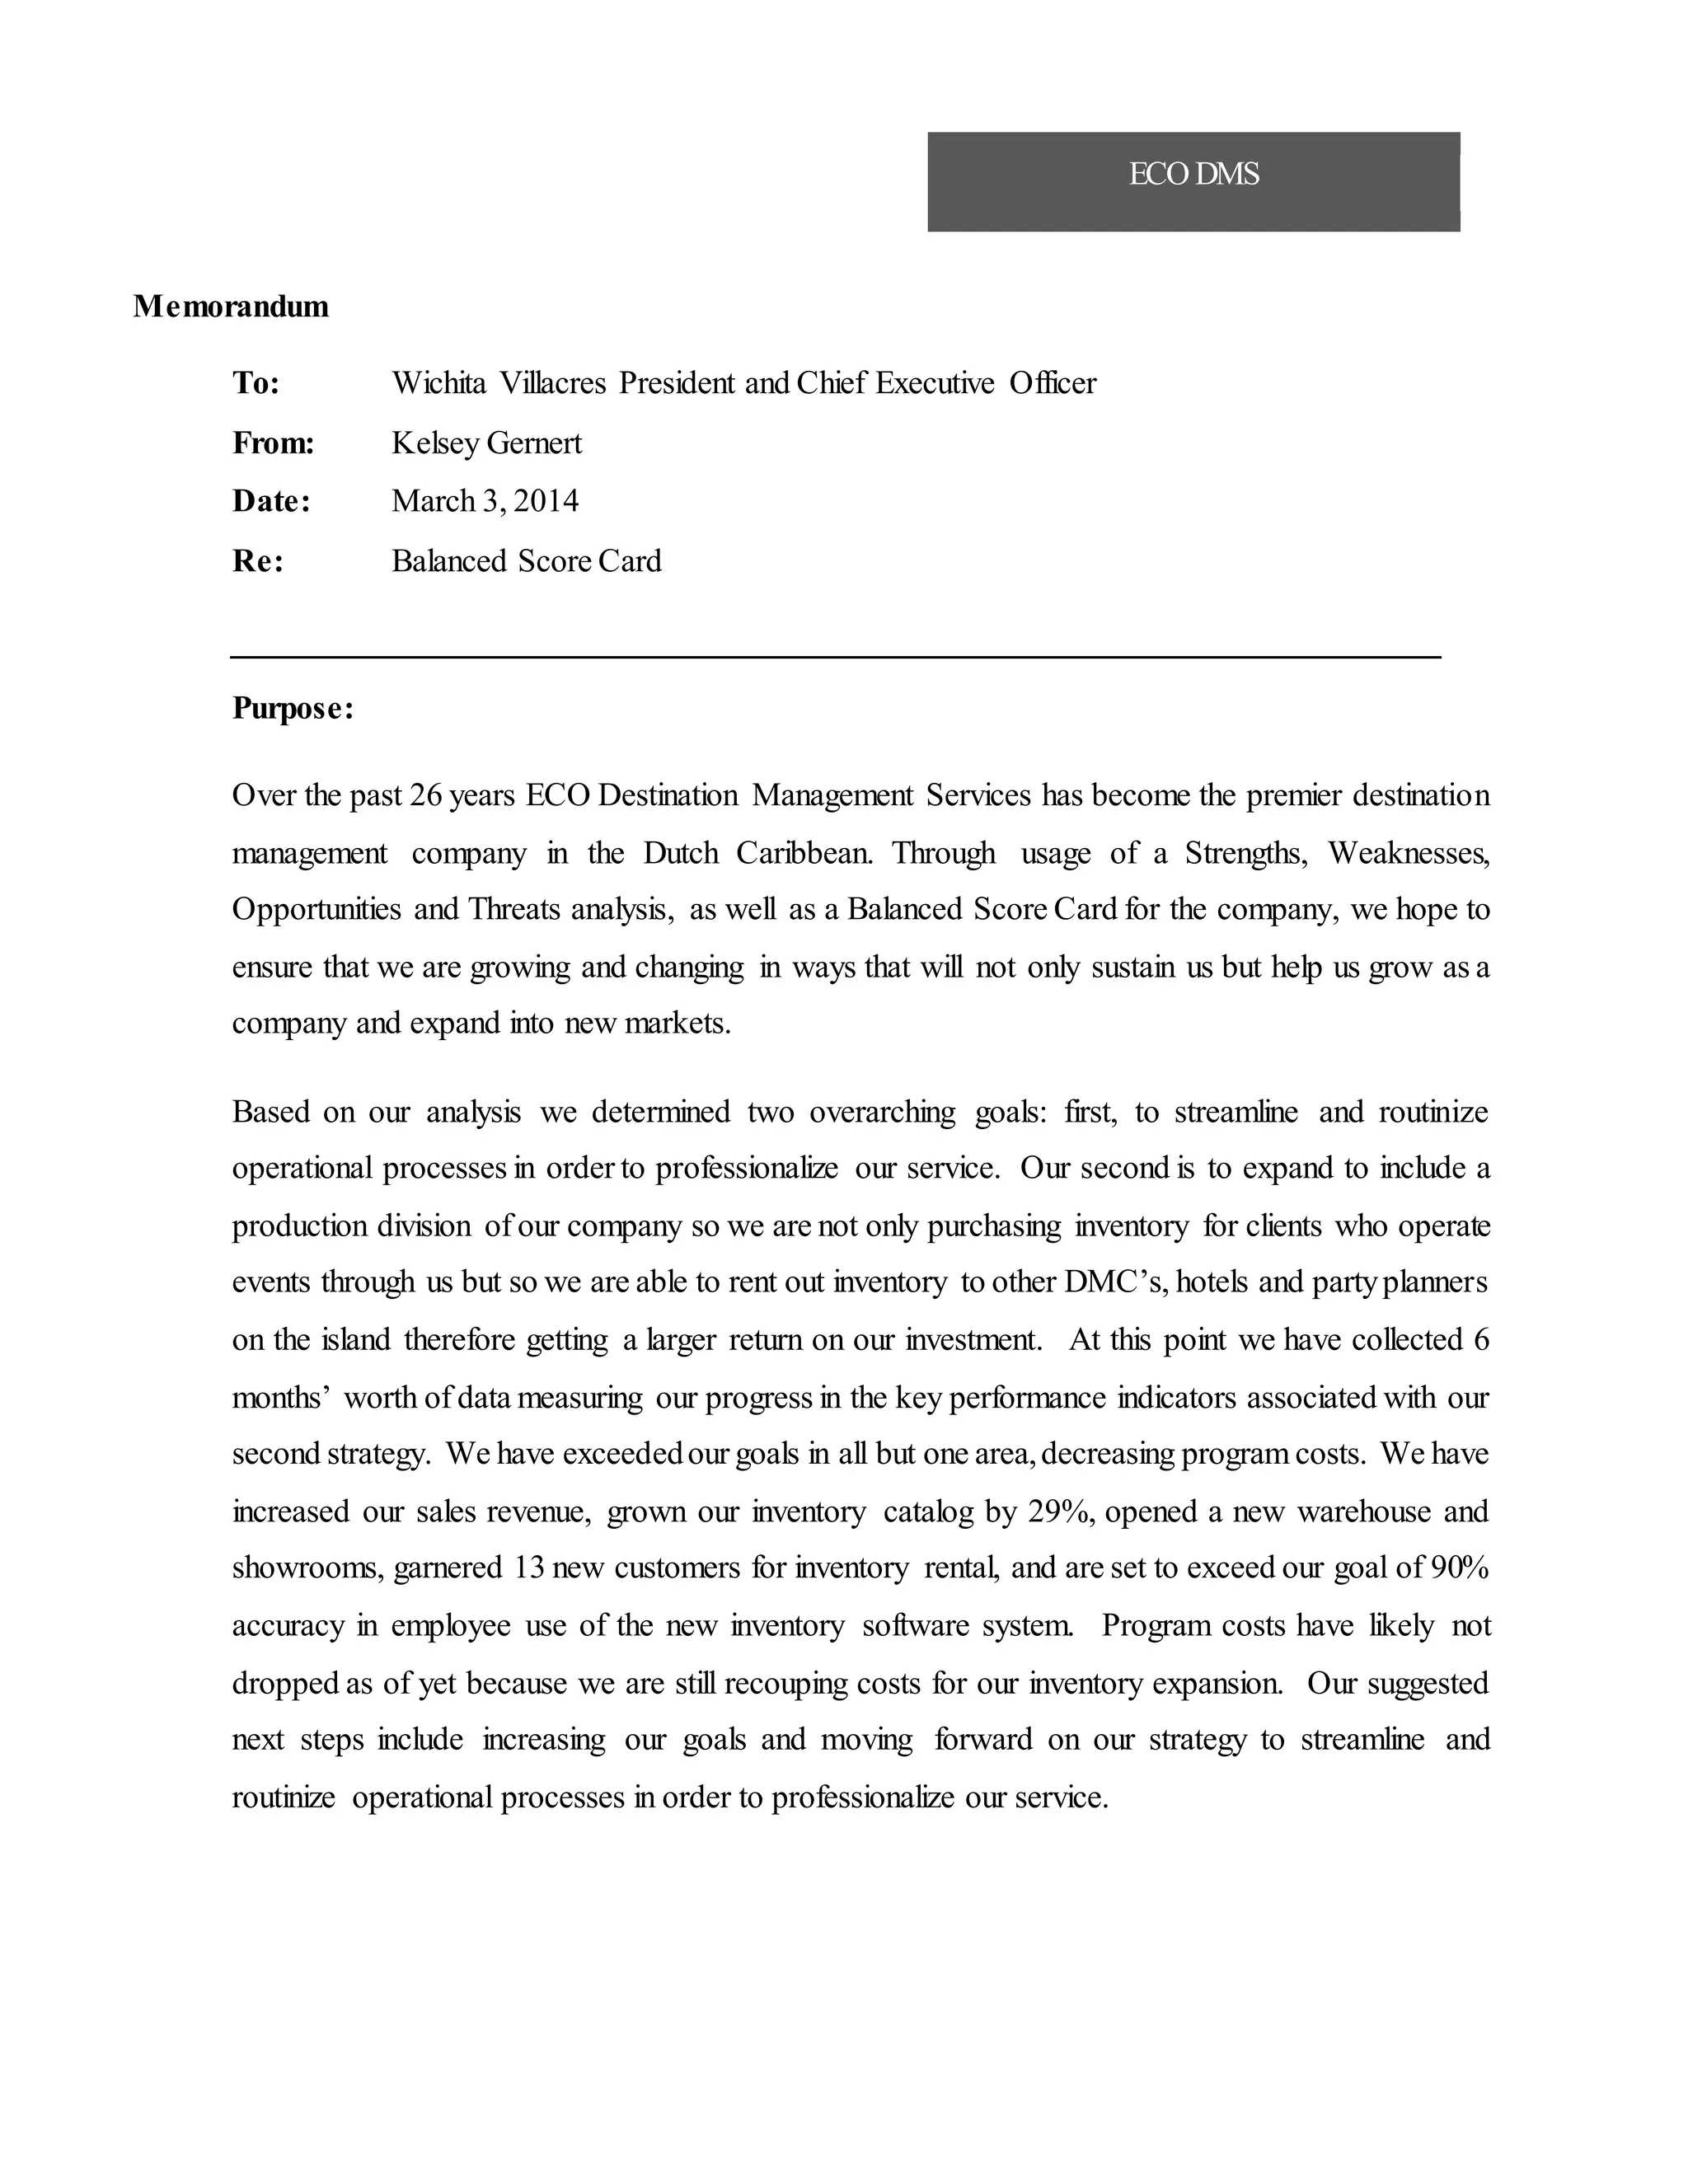
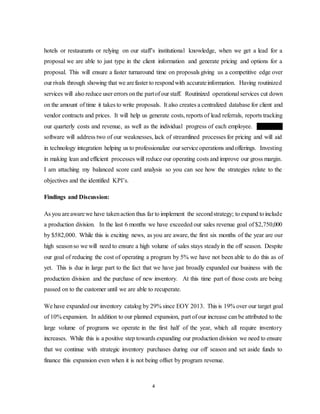
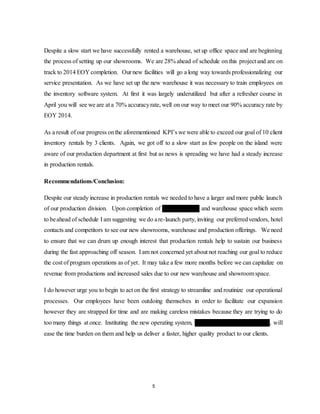
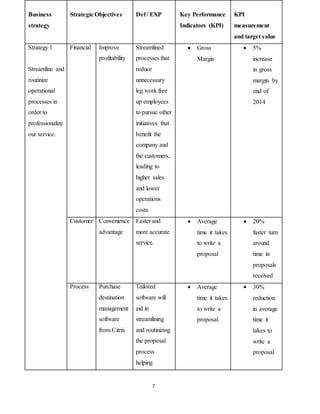
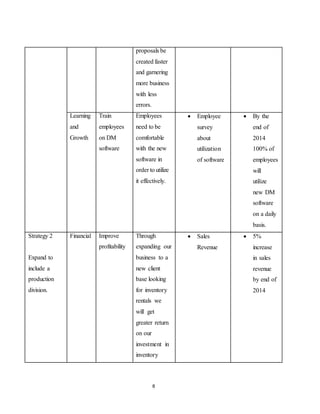
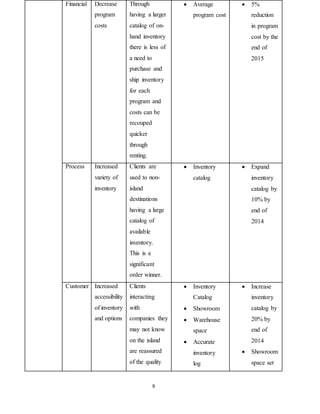
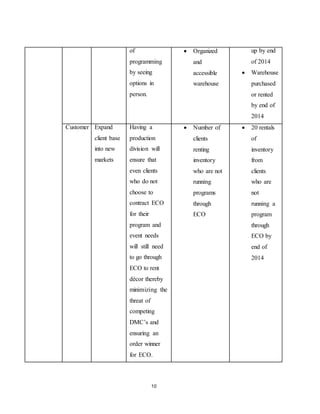
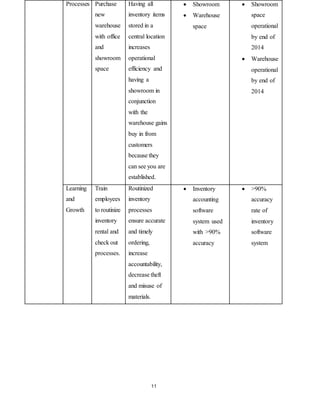
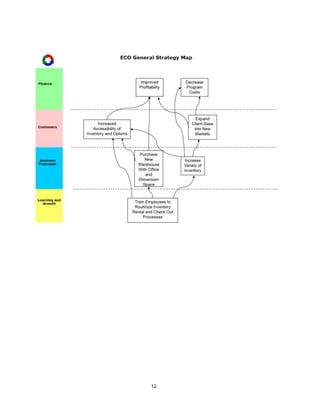
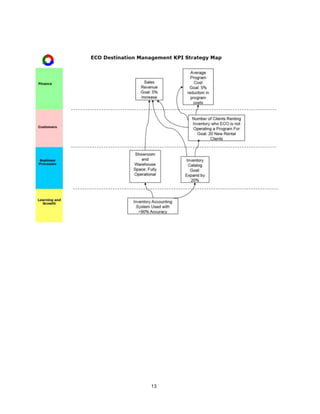
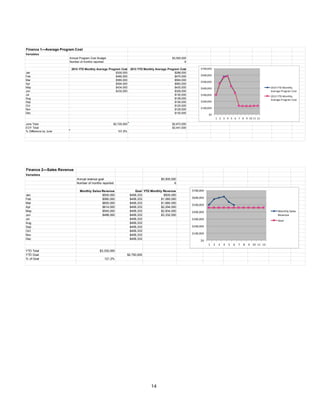
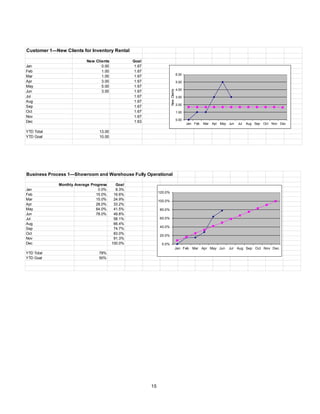
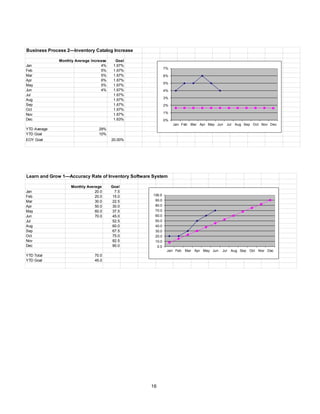

The memorandum discusses a balanced scorecard analysis conducted by ECO Destination Management Services to ensure future growth and expansion. The company identified two goals: streamlining operations and expanding into event production by renting inventory. For the production expansion, the company exceeded revenue targets but not cost reduction goals due to initial expansion costs. Overall the analysis found that expanding event inventory rental aligned with professionalizing services and could help the company grow if referrals decrease.


![Recomm-Letter(1)[1] Lacouty](https://cdn.slidesharecdn.com/ss_thumbnails/c1fe020e-f4cc-4017-9411-b5a2ef025f1a-160216190204-thumbnail.jpg?width=640&height=640&fit=bounds)


![Self analysis[1]](https://cdn.slidesharecdn.com/ss_thumbnails/selfanalysis1-130216053055-phpapp01-thumbnail.jpg?width=640&height=640&fit=bounds)


