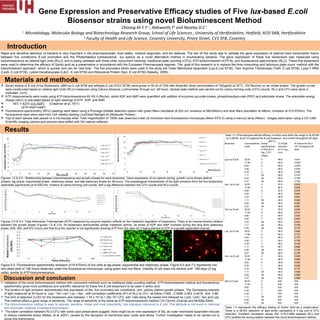
SlideShare a Scribd company logo
1 of 1
Gene Expression and Preservative Efficacy studies of Five lux-based E.coli
Biosensor strains using novel Bioluminescent Method
Choong.M.Y.Y 1
, Aldsworth,T2
and Naseby.D.C1
1
Microbiology, Molecular Biology and Biotechnology Research Group, School of Life Sciences , University of Hertfordshire, Hatfield, Al10 9AB, Hertfordshire
2
Faculty of Health and Life Science, Coventry University, Priory Street, CV1 5FB, Coventry
.
Introduction
Rapid and sensitive detection of bacteria is very important in the pharmaceuticals, food safety, medical diagnostic, and bio defense. The aim of this study was to validate the gene expression of plasmid bore transcription fusion
between five constitutive E.coli promoters and the Photorhabdus luminescence lux operon as a novel alternative method in enumerating bacteria. The gene expression of these five biosensors was measured using
bioluminescence as relative light units (RLU), and is being validated with three other concurrent methods; traditional plate counting (CFU); ATP-bioluminescent (ATP-B); and fluorescence spectrometry (RLU). These five biosensors
were used to determine the efficacy of Sorbic acid as a preservative in accordance with the European Pharmacopeia regimes. The goal of this research is to replace the time consuming and laborious plate count method with the
bioluminescent approach which is quicker and can be ‘real time’. The five promoters which were used in the study are Outer Membrane lipoprotein (Lpp-E.coli 8739), Twin Arginine Translocase (TatA- E.coli 8739), Lysyl-T-RNA
(LysS- E.coli 8739), Lysine Decarboxylase (LdcC- E.coli 8739) and Ribosomal Protein (Spc- E.coli 8739) (Naseby, 2006).
Materials and methods
 Seven strains of E.coli (5-lux Biosensors, pBR-lux E.coli 8739 and wildtype E.coli ATCC 8739) were grown in 50 ml of TSA with Ampicillin (final concentration of 100μg/ml) at 32°C, 100 Rev/min on an orbital shaker. The growth curves
were constructed based on relative light Units (RLU) measured using Celcius Advance Luminometer through out 48 hours. Spread plate method was carried out for colony forming units (CFU) counts. RLU and CFU were dpne in
triplicates. (n=3).
 ATP measurements were made using ATP-bioluminescence Kit HS II (Roche), whilst ADP and AMP were quantified with addition of enzymes pyruvate kinase, phosphoneolpyruvate (PEP) and adenylate kinase. The adenylate energy
charge (AEC) is calculated based on light readings of ATP, ADP, and AMP.
 AEC = ATP+ 0.5 (ADP) (Chapman et al.,1971)
 (ATP+ADP+AMP)
 Fluorescence spectrometry (RFU) readings were taken using a Promega GloMax detection system with green filters (excitation at 525 nm, emission at 580-640nm) and blue filters (excitation at 490nm, emission at 510-570nm). The
fluorescence dyes were used from Cell viability staining Live/Dead Baclight kit (Molecular Probes).
 10μl of each sample was placed on a microscope slide. Total magnification of 1000x was observed under oil immersion lens fluorescence microscope (Nikon EFD-3) using a mercury lamp (Nikon). Images were taken using a GX CAM
Scientific imaging camera and pictures were edited with GX capture software.
Results
Figures 1.0 & 2.0 : Relationship between bioluminescence and growth phases for each biosensor. Gene expression of lux operon during growth curve shows distinct
phases; lag phase, exponential phase , stationary phase and late stationary phase for 48 hours .The physiological characteristic of the light emission from the five biosensors
resembles significantly (p<0.005) the kinetics of colony forming unit counts with a log difference between the CFU counts and RLU counts.
Biosensor Concentrations
(mM)
Actual
sampling time
to time to≥ 3
log10 CFU
(Days)
% of light
reduction
at 3 ≥ log10
CFU
R2
Values for RLU-
CFU throughout 28
days
Lpp-lux E.coli 35.67 0 99.9 0.647***
17.84 0 99.9 0.563***
8.92 0 99.9 0.563***
4.46 1 99.9 0.595***
2.23 2 99.9 0.496*
1.11 28 99.9 0.510*
0.55 28 99.9 0.765*
0.27 28 99.9 0.754*
Spc- lux E.coli 35.67 0 97.9 0.978*
17.84 0 90.4 0.930*
8.92 0 87.6 0.975*
4.46 7 99.9 0.936*
2.23 7 99.9 0.981*
1.11 28 99.9 0.992*
0.55 28 99.9 0.992*
0.27 28 99.9 0.987*
Tat- lux E.coli 35.67 0 99.5 0.834*
17.84 0 99.9 0.874*
8.92 0 99.9 0.926*
4.46 7 99.8 0.903*
2.23 28 99.0 0.924*
1.11 28 99.4 0.708*
0.55 28 99.9 0.716*
Lys- lux E.coli 35.67 0 96.0 0.840*
17.84 0 96.2 0.772*
8.92 0 99.5 0.773*
4.46 2 99.4 0.700*
2.23 7 99.5 0.750*
1.11 21 99.7 0.888
0.55 28 99.9 0.744*
*
0.27 28 96.6 0.708*
Ldc- lux E.coli 35.67 0 99.9 0.985*
17.84 0 99.9 0.985*
8.92 0 99.8 0.830*
4.46 1 99.9 0.829*
2.23 7 99.9 0.727*
1.11 28 99.9 0.998*
0.55 28 99.9 0.998*
0.27 28 99.9 0.998*
pBr-lux E.coli 35.67 0 N/A N/A
17.84 0 N/A N/A
8.92 0 N/A N/A
4.46 7 N/A N/A
2.23 7 N/A N/A
1.11 28 N/A N/A
0.55 28 N/A N/A
0.27 28 N/A N/A
Table 1.0: Pharmacopeia defined efficacy of sorbic acid within the range of 35.67mM
to 0.28mM at pH 5.0 against five E.coli biosensor and control throughout 28 days
(20°C)
Figures 3.0 & 4.0: Total Adenosine Triphosphate (ATP) measured by enzyme reaction reflects on the metabolic regulation of biosensors. There is an inverse kinetics relation
between the growth phase (Figures 1.0 & 2.0). All biosensors demonstrate similar metabolic activity, as levels of ADP and AMP increase during the long term stationary
phase (336, 504, and 672 hours) and that thus the reporter is not significantly draining ATP from the cells nor it being starved of ATP in a growth dependent manner.
Figure 5.0: Fluorescence spectrometry emission (510-570nm) of live cells at lag phase, exponential and stationary phase. Figure 6.0 and 7.0 represents live
and dead cells of 168 hours observed under the fluorescence microscope using green and red filters. Viability of cell does not decline until 168 days (2 log
units), similar to ATP-bioluminescence.
Discussion and conclusion
Table 1.0 represents the efficacy testing of Sorbic Acid as a preservative.
There is a 99.9% reduction of light which represents a 3 log unit of CFU
reduction. Excellent correlation values (R2: 0.70-0.998) between RLU and
CFU certifies the strong relation between the novel bioluminescent method.
 Validation of the novel bioluminescent method with concurrent methods such as traditional plate counting method, ATP-bioluminescent method and fluorescence
spectrometry gives more confidence and scientific relevance for these five E.coli biosensors to be used in sorbic acid.
 The kinetics of light emission demonstrates that expression of the five promoters are constitutive, and portray distinct growth phases. The Decreasing intensity
of light measured at 24 hours is Lpp> Tat> Ldc> Lys > Spc , with correlation coefficients (R2
) of RLU to CFU as follow; 0.992 , 0.9485 ,0.953 ,0.9418 , and 0.88.
 The limit of detection (LOD) for the biosensors was between 1.16 x 10⁴
to 1.20x 10⁵
CFU, with TatA being the lowest limit followed by LysS, LdcC, Spc and Lpp.
This method offers a good range of sensitivity. The range of sensitivity is the same as ATP-bioluminescence method (104
Cfu/ml) (Gracias and McKillip,2004).
 The bioluminescence method is easy to operate, sensitive, cheap and most importantly, has biological relevance to E.coli. This attribute is not found in chemical
and enzymatic methods of bacteria enumeration.
 The lower correlation between RLU-CFU with sorbic acid preservative suggest, there might be an over expression of Slp, an outer membrane lipoprotein induced
to reduce metabolite stress (Mates, et al.,2007), caused by the disruption of membrane layer under acid stress. Further investigation needs to be carried out to
prove this phenomena.

More Related Content

What's hot

Application of UV-vis in natural product research
Application of UV-vis in natural product researchApplication of UV-vis in natural product research
Application of UV-vis in natural product researchZarTaj2
 
Online Size-Exclusion High-Performance Liquid Chromatography Light Scattering...
Online Size-Exclusion High-Performance Liquid Chromatography Light Scattering...Online Size-Exclusion High-Performance Liquid Chromatography Light Scattering...
Online Size-Exclusion High-Performance Liquid Chromatography Light Scattering...KBI Biopharma
 
76 Lab Review
76 Lab Review76 Lab Review
76 Lab Reviewflguppie
 
Fluorimoetric and manometric methods of enzyme assay
Fluorimoetric and manometric methods of enzyme assayFluorimoetric and manometric methods of enzyme assay
Fluorimoetric and manometric methods of enzyme assayGokulArora
 
Jattir Emerging Scholars Poster
Jattir Emerging Scholars PosterJattir Emerging Scholars Poster
Jattir Emerging Scholars PosterJattir Farve
 
Bukovec_Melanie_ResearchPaper
Bukovec_Melanie_ResearchPaperBukovec_Melanie_ResearchPaper
Bukovec_Melanie_ResearchPaperMelanie Bukovec
 
CortniDick_BME2015abstract
CortniDick_BME2015abstractCortniDick_BME2015abstract
CortniDick_BME2015abstractCortni Dick
 
MSc Final Project - Alvaro Diaz Mendoza
MSc Final Project - Alvaro Diaz MendozaMSc Final Project - Alvaro Diaz Mendoza
MSc Final Project - Alvaro Diaz MendozaAlvaro Diaz Mendoza
 
Rapid analysis of polymers and petroleum by Ion-mobility mass spectrometry
Rapid analysis of polymers and petroleum by Ion-mobility mass spectrometryRapid analysis of polymers and petroleum by Ion-mobility mass spectrometry
Rapid analysis of polymers and petroleum by Ion-mobility mass spectrometryWaters Corporation - Chemical Materials
 
Application of uv visible spectroscopy in pharmaceutical industry
Application of uv visible spectroscopy in pharmaceutical industryApplication of uv visible spectroscopy in pharmaceutical industry
Application of uv visible spectroscopy in pharmaceutical industryFarhad Ashraf
 
Molecular_bilogy_lab_report_1
Molecular_bilogy_lab_report_1Molecular_bilogy_lab_report_1
Molecular_bilogy_lab_report_1Elijah Willie
 

What's hot (20)

Application of UV-vis in natural product research
Application of UV-vis in natural product researchApplication of UV-vis in natural product research
Application of UV-vis in natural product research
 
Interpreting MS\\MS Results
Interpreting  MS\\MS ResultsInterpreting  MS\\MS Results
Interpreting MS\\MS Results
 
Online Size-Exclusion High-Performance Liquid Chromatography Light Scattering...
Online Size-Exclusion High-Performance Liquid Chromatography Light Scattering...Online Size-Exclusion High-Performance Liquid Chromatography Light Scattering...
Online Size-Exclusion High-Performance Liquid Chromatography Light Scattering...
 
76 Lab Review
76 Lab Review76 Lab Review
76 Lab Review
 
Fluorimoetric and manometric methods of enzyme assay
Fluorimoetric and manometric methods of enzyme assayFluorimoetric and manometric methods of enzyme assay
Fluorimoetric and manometric methods of enzyme assay
 
Jattir Emerging Scholars Poster
Jattir Emerging Scholars PosterJattir Emerging Scholars Poster
Jattir Emerging Scholars Poster
 
methods of enzyme assay
methods of enzyme assaymethods of enzyme assay
methods of enzyme assay
 
CMB 426 Final Report
CMB 426 Final ReportCMB 426 Final Report
CMB 426 Final Report
 
RBC Poster Final
RBC Poster FinalRBC Poster Final
RBC Poster Final
 
Cholinesterase Paper
Cholinesterase PaperCholinesterase Paper
Cholinesterase Paper
 
Bukovec_Melanie_ResearchPaper
Bukovec_Melanie_ResearchPaperBukovec_Melanie_ResearchPaper
Bukovec_Melanie_ResearchPaper
 
Enzyme Assay Methods
Enzyme Assay MethodsEnzyme Assay Methods
Enzyme Assay Methods
 
150 journal reprt
150  journal reprt150  journal reprt
150 journal reprt
 
CortniDick_BME2015abstract
CortniDick_BME2015abstractCortniDick_BME2015abstract
CortniDick_BME2015abstract
 
MSc Final Project - Alvaro Diaz Mendoza
MSc Final Project - Alvaro Diaz MendozaMSc Final Project - Alvaro Diaz Mendoza
MSc Final Project - Alvaro Diaz Mendoza
 
Rapid analysis of polymers and petroleum by Ion-mobility mass spectrometry
Rapid analysis of polymers and petroleum by Ion-mobility mass spectrometryRapid analysis of polymers and petroleum by Ion-mobility mass spectrometry
Rapid analysis of polymers and petroleum by Ion-mobility mass spectrometry
 
Oak Ridge Conference 2008
Oak Ridge Conference 2008Oak Ridge Conference 2008
Oak Ridge Conference 2008
 
Application of uv visible spectroscopy in pharmaceutical industry
Application of uv visible spectroscopy in pharmaceutical industryApplication of uv visible spectroscopy in pharmaceutical industry
Application of uv visible spectroscopy in pharmaceutical industry
 
Molecular_bilogy_lab_report_1
Molecular_bilogy_lab_report_1Molecular_bilogy_lab_report_1
Molecular_bilogy_lab_report_1
 
poster grace print
poster grace printposter grace print
poster grace print
 

Similar to Gene Expression E.coli Biosensors Bioluminescence Preservative Efficacy

melissa Poster SGM 2013
melissa Poster SGM 2013melissa Poster SGM 2013
melissa Poster SGM 2013Melissa Choong
 
housman_mini_4_5 foot PPT poster template 50 percent
housman_mini_4_5 foot PPT poster template 50 percenthousman_mini_4_5 foot PPT poster template 50 percent
housman_mini_4_5 foot PPT poster template 50 percentJonathan Oyler
 
Ivan Lafayette - QSI Symposium - Poster - Final version
Ivan Lafayette - QSI Symposium - Poster - Final versionIvan Lafayette - QSI Symposium - Poster - Final version
Ivan Lafayette - QSI Symposium - Poster - Final versionIvan Lafayette
 
Bioanalytical method development and validation .
Bioanalytical method development and validation .Bioanalytical method development and validation .
Bioanalytical method development and validation .Shubham Bora
 
Analysis of bioreactor parameters online and offline
Analysis of bioreactor parameters online and offlineAnalysis of bioreactor parameters online and offline
Analysis of bioreactor parameters online and offlinevikash_94
 
laser-induced fluorescence orUV detectors for analysis of EPO and Tobramycin ...
laser-induced fluorescence orUV detectors for analysis of EPO and Tobramycin ...laser-induced fluorescence orUV detectors for analysis of EPO and Tobramycin ...
laser-induced fluorescence orUV detectors for analysis of EPO and Tobramycin ...Wael Ebied
 
Advantages And Disadvantages Of Reverse Sequence Syphilis...
Advantages And Disadvantages Of Reverse Sequence Syphilis...Advantages And Disadvantages Of Reverse Sequence Syphilis...
Advantages And Disadvantages Of Reverse Sequence Syphilis...Lynn Holkesvik
 
Enzyme based Biosensor for pesticide Detection
Enzyme based Biosensor for pesticide DetectionEnzyme based Biosensor for pesticide Detection
Enzyme based Biosensor for pesticide DetectionSubhasis Sarkar
 
Metabolomic Profiling of Spent Biomass Of Marine Microalgae, Chlorella vulgaris
Metabolomic Profiling of Spent Biomass Of Marine Microalgae, Chlorella vulgarisMetabolomic Profiling of Spent Biomass Of Marine Microalgae, Chlorella vulgaris
Metabolomic Profiling of Spent Biomass Of Marine Microalgae, Chlorella vulgarispriyanka raviraj
 
Emans et al 1995 relatime HC
Emans et al 1995 relatime HCEmans et al 1995 relatime HC
Emans et al 1995 relatime HCNeil Emans, Ph.D
 
Conventional and modern methods for detection of spoilage
Conventional and modern methods for detection of spoilageConventional and modern methods for detection of spoilage
Conventional and modern methods for detection of spoilageAnuKiruthika
 
UV-vis. spectroscopy N HPLC (rilpivirine) by RJcharan.
UV-vis. spectroscopy N HPLC (rilpivirine) by RJcharan.UV-vis. spectroscopy N HPLC (rilpivirine) by RJcharan.
UV-vis. spectroscopy N HPLC (rilpivirine) by RJcharan.RJ Charan
 
BME 302 Cellular Engineering Common Cell & Molecu.docx
BME 302 Cellular Engineering  Common Cell & Molecu.docxBME 302 Cellular Engineering  Common Cell & Molecu.docx
BME 302 Cellular Engineering Common Cell & Molecu.docxhartrobert670
 
A brief review of exosome & its detection
A brief review of exosome & its detectionA brief review of exosome & its detection
A brief review of exosome & its detectionPeng-Wen Liu
 
Lab review
Lab reviewLab review
Lab reviewktanaka2
 
Multi-residue pesticide analysis of food samples using acetonitrile extractio...
Multi-residue pesticide analysis of food samples using acetonitrile extractio...Multi-residue pesticide analysis of food samples using acetonitrile extractio...
Multi-residue pesticide analysis of food samples using acetonitrile extractio...Kate?ina Svobodov
 
Conceição et al, 2006. orpotrin a novel vasoconstrictor peptide from the veno...
Conceição et al, 2006. orpotrin a novel vasoconstrictor peptide from the veno...Conceição et al, 2006. orpotrin a novel vasoconstrictor peptide from the veno...
Conceição et al, 2006. orpotrin a novel vasoconstrictor peptide from the veno...pryloock
 
LCMS PHYTOCHEMICAL ANALYSIS
LCMS PHYTOCHEMICAL ANALYSISLCMS PHYTOCHEMICAL ANALYSIS
LCMS PHYTOCHEMICAL ANALYSISBushraYasin4
 

Similar to Gene Expression E.coli Biosensors Bioluminescence Preservative Efficacy (20)

melissa Poster SGM 2013
melissa Poster SGM 2013melissa Poster SGM 2013
melissa Poster SGM 2013
 
housman_mini_4_5 foot PPT poster template 50 percent
housman_mini_4_5 foot PPT poster template 50 percenthousman_mini_4_5 foot PPT poster template 50 percent
housman_mini_4_5 foot PPT poster template 50 percent
 
Ivan Lafayette - QSI Symposium - Poster - Final version
Ivan Lafayette - QSI Symposium - Poster - Final versionIvan Lafayette - QSI Symposium - Poster - Final version
Ivan Lafayette - QSI Symposium - Poster - Final version
 
Bioanalytical method development and validation .
Bioanalytical method development and validation .Bioanalytical method development and validation .
Bioanalytical method development and validation .
 
Analysis of bioreactor parameters online and offline
Analysis of bioreactor parameters online and offlineAnalysis of bioreactor parameters online and offline
Analysis of bioreactor parameters online and offline
 
laser-induced fluorescence orUV detectors for analysis of EPO and Tobramycin ...
laser-induced fluorescence orUV detectors for analysis of EPO and Tobramycin ...laser-induced fluorescence orUV detectors for analysis of EPO and Tobramycin ...
laser-induced fluorescence orUV detectors for analysis of EPO and Tobramycin ...
 
Publication
PublicationPublication
Publication
 
Advantages And Disadvantages Of Reverse Sequence Syphilis...
Advantages And Disadvantages Of Reverse Sequence Syphilis...Advantages And Disadvantages Of Reverse Sequence Syphilis...
Advantages And Disadvantages Of Reverse Sequence Syphilis...
 
Enzyme based Biosensor for pesticide Detection
Enzyme based Biosensor for pesticide DetectionEnzyme based Biosensor for pesticide Detection
Enzyme based Biosensor for pesticide Detection
 
Metabolomic Profiling of Spent Biomass Of Marine Microalgae, Chlorella vulgaris
Metabolomic Profiling of Spent Biomass Of Marine Microalgae, Chlorella vulgarisMetabolomic Profiling of Spent Biomass Of Marine Microalgae, Chlorella vulgaris
Metabolomic Profiling of Spent Biomass Of Marine Microalgae, Chlorella vulgaris
 
ASMSPoster_2015
ASMSPoster_2015ASMSPoster_2015
ASMSPoster_2015
 
Emans et al 1995 relatime HC
Emans et al 1995 relatime HCEmans et al 1995 relatime HC
Emans et al 1995 relatime HC
 
Conventional and modern methods for detection of spoilage
Conventional and modern methods for detection of spoilageConventional and modern methods for detection of spoilage
Conventional and modern methods for detection of spoilage
 
UV-vis. spectroscopy N HPLC (rilpivirine) by RJcharan.
UV-vis. spectroscopy N HPLC (rilpivirine) by RJcharan.UV-vis. spectroscopy N HPLC (rilpivirine) by RJcharan.
UV-vis. spectroscopy N HPLC (rilpivirine) by RJcharan.
 
BME 302 Cellular Engineering Common Cell & Molecu.docx
BME 302 Cellular Engineering  Common Cell & Molecu.docxBME 302 Cellular Engineering  Common Cell & Molecu.docx
BME 302 Cellular Engineering Common Cell & Molecu.docx
 
A brief review of exosome & its detection
A brief review of exosome & its detectionA brief review of exosome & its detection
A brief review of exosome & its detection
 
Lab review
Lab reviewLab review
Lab review
 
Multi-residue pesticide analysis of food samples using acetonitrile extractio...
Multi-residue pesticide analysis of food samples using acetonitrile extractio...Multi-residue pesticide analysis of food samples using acetonitrile extractio...
Multi-residue pesticide analysis of food samples using acetonitrile extractio...
 
Conceição et al, 2006. orpotrin a novel vasoconstrictor peptide from the veno...
Conceição et al, 2006. orpotrin a novel vasoconstrictor peptide from the veno...Conceição et al, 2006. orpotrin a novel vasoconstrictor peptide from the veno...
Conceição et al, 2006. orpotrin a novel vasoconstrictor peptide from the veno...
 
LCMS PHYTOCHEMICAL ANALYSIS
LCMS PHYTOCHEMICAL ANALYSISLCMS PHYTOCHEMICAL ANALYSIS
LCMS PHYTOCHEMICAL ANALYSIS
 

Gene Expression E.coli Biosensors Bioluminescence Preservative Efficacy

  • 1. Gene Expression and Preservative Efficacy studies of Five lux-based E.coli Biosensor strains using novel Bioluminescent Method Choong.M.Y.Y 1 , Aldsworth,T2 and Naseby.D.C1 1 Microbiology, Molecular Biology and Biotechnology Research Group, School of Life Sciences , University of Hertfordshire, Hatfield, Al10 9AB, Hertfordshire 2 Faculty of Health and Life Science, Coventry University, Priory Street, CV1 5FB, Coventry . Introduction Rapid and sensitive detection of bacteria is very important in the pharmaceuticals, food safety, medical diagnostic, and bio defense. The aim of this study was to validate the gene expression of plasmid bore transcription fusion between five constitutive E.coli promoters and the Photorhabdus luminescence lux operon as a novel alternative method in enumerating bacteria. The gene expression of these five biosensors was measured using bioluminescence as relative light units (RLU), and is being validated with three other concurrent methods; traditional plate counting (CFU); ATP-bioluminescent (ATP-B); and fluorescence spectrometry (RLU). These five biosensors were used to determine the efficacy of Sorbic acid as a preservative in accordance with the European Pharmacopeia regimes. The goal of this research is to replace the time consuming and laborious plate count method with the bioluminescent approach which is quicker and can be ‘real time’. The five promoters which were used in the study are Outer Membrane lipoprotein (Lpp-E.coli 8739), Twin Arginine Translocase (TatA- E.coli 8739), Lysyl-T-RNA (LysS- E.coli 8739), Lysine Decarboxylase (LdcC- E.coli 8739) and Ribosomal Protein (Spc- E.coli 8739) (Naseby, 2006). Materials and methods  Seven strains of E.coli (5-lux Biosensors, pBR-lux E.coli 8739 and wildtype E.coli ATCC 8739) were grown in 50 ml of TSA with Ampicillin (final concentration of 100μg/ml) at 32°C, 100 Rev/min on an orbital shaker. The growth curves were constructed based on relative light Units (RLU) measured using Celcius Advance Luminometer through out 48 hours. Spread plate method was carried out for colony forming units (CFU) counts. RLU and CFU were dpne in triplicates. (n=3).  ATP measurements were made using ATP-bioluminescence Kit HS II (Roche), whilst ADP and AMP were quantified with addition of enzymes pyruvate kinase, phosphoneolpyruvate (PEP) and adenylate kinase. The adenylate energy charge (AEC) is calculated based on light readings of ATP, ADP, and AMP.  AEC = ATP+ 0.5 (ADP) (Chapman et al.,1971)  (ATP+ADP+AMP)  Fluorescence spectrometry (RFU) readings were taken using a Promega GloMax detection system with green filters (excitation at 525 nm, emission at 580-640nm) and blue filters (excitation at 490nm, emission at 510-570nm). The fluorescence dyes were used from Cell viability staining Live/Dead Baclight kit (Molecular Probes).  10μl of each sample was placed on a microscope slide. Total magnification of 1000x was observed under oil immersion lens fluorescence microscope (Nikon EFD-3) using a mercury lamp (Nikon). Images were taken using a GX CAM Scientific imaging camera and pictures were edited with GX capture software. Results Figures 1.0 & 2.0 : Relationship between bioluminescence and growth phases for each biosensor. Gene expression of lux operon during growth curve shows distinct phases; lag phase, exponential phase , stationary phase and late stationary phase for 48 hours .The physiological characteristic of the light emission from the five biosensors resembles significantly (p<0.005) the kinetics of colony forming unit counts with a log difference between the CFU counts and RLU counts. Biosensor Concentrations (mM) Actual sampling time to time to≥ 3 log10 CFU (Days) % of light reduction at 3 ≥ log10 CFU R2 Values for RLU- CFU throughout 28 days Lpp-lux E.coli 35.67 0 99.9 0.647*** 17.84 0 99.9 0.563*** 8.92 0 99.9 0.563*** 4.46 1 99.9 0.595*** 2.23 2 99.9 0.496* 1.11 28 99.9 0.510* 0.55 28 99.9 0.765* 0.27 28 99.9 0.754* Spc- lux E.coli 35.67 0 97.9 0.978* 17.84 0 90.4 0.930* 8.92 0 87.6 0.975* 4.46 7 99.9 0.936* 2.23 7 99.9 0.981* 1.11 28 99.9 0.992* 0.55 28 99.9 0.992* 0.27 28 99.9 0.987* Tat- lux E.coli 35.67 0 99.5 0.834* 17.84 0 99.9 0.874* 8.92 0 99.9 0.926* 4.46 7 99.8 0.903* 2.23 28 99.0 0.924* 1.11 28 99.4 0.708* 0.55 28 99.9 0.716* Lys- lux E.coli 35.67 0 96.0 0.840* 17.84 0 96.2 0.772* 8.92 0 99.5 0.773* 4.46 2 99.4 0.700* 2.23 7 99.5 0.750* 1.11 21 99.7 0.888 0.55 28 99.9 0.744* * 0.27 28 96.6 0.708* Ldc- lux E.coli 35.67 0 99.9 0.985* 17.84 0 99.9 0.985* 8.92 0 99.8 0.830* 4.46 1 99.9 0.829* 2.23 7 99.9 0.727* 1.11 28 99.9 0.998* 0.55 28 99.9 0.998* 0.27 28 99.9 0.998* pBr-lux E.coli 35.67 0 N/A N/A 17.84 0 N/A N/A 8.92 0 N/A N/A 4.46 7 N/A N/A 2.23 7 N/A N/A 1.11 28 N/A N/A 0.55 28 N/A N/A 0.27 28 N/A N/A Table 1.0: Pharmacopeia defined efficacy of sorbic acid within the range of 35.67mM to 0.28mM at pH 5.0 against five E.coli biosensor and control throughout 28 days (20°C) Figures 3.0 & 4.0: Total Adenosine Triphosphate (ATP) measured by enzyme reaction reflects on the metabolic regulation of biosensors. There is an inverse kinetics relation between the growth phase (Figures 1.0 & 2.0). All biosensors demonstrate similar metabolic activity, as levels of ADP and AMP increase during the long term stationary phase (336, 504, and 672 hours) and that thus the reporter is not significantly draining ATP from the cells nor it being starved of ATP in a growth dependent manner. Figure 5.0: Fluorescence spectrometry emission (510-570nm) of live cells at lag phase, exponential and stationary phase. Figure 6.0 and 7.0 represents live and dead cells of 168 hours observed under the fluorescence microscope using green and red filters. Viability of cell does not decline until 168 days (2 log units), similar to ATP-bioluminescence. Discussion and conclusion Table 1.0 represents the efficacy testing of Sorbic Acid as a preservative. There is a 99.9% reduction of light which represents a 3 log unit of CFU reduction. Excellent correlation values (R2: 0.70-0.998) between RLU and CFU certifies the strong relation between the novel bioluminescent method.  Validation of the novel bioluminescent method with concurrent methods such as traditional plate counting method, ATP-bioluminescent method and fluorescence spectrometry gives more confidence and scientific relevance for these five E.coli biosensors to be used in sorbic acid.  The kinetics of light emission demonstrates that expression of the five promoters are constitutive, and portray distinct growth phases. The Decreasing intensity of light measured at 24 hours is Lpp> Tat> Ldc> Lys > Spc , with correlation coefficients (R2 ) of RLU to CFU as follow; 0.992 , 0.9485 ,0.953 ,0.9418 , and 0.88.  The limit of detection (LOD) for the biosensors was between 1.16 x 10⁴ to 1.20x 10⁵ CFU, with TatA being the lowest limit followed by LysS, LdcC, Spc and Lpp. This method offers a good range of sensitivity. The range of sensitivity is the same as ATP-bioluminescence method (104 Cfu/ml) (Gracias and McKillip,2004).  The bioluminescence method is easy to operate, sensitive, cheap and most importantly, has biological relevance to E.coli. This attribute is not found in chemical and enzymatic methods of bacteria enumeration.  The lower correlation between RLU-CFU with sorbic acid preservative suggest, there might be an over expression of Slp, an outer membrane lipoprotein induced to reduce metabolite stress (Mates, et al.,2007), caused by the disruption of membrane layer under acid stress. Further investigation needs to be carried out to prove this phenomena.