1. Automated Red Blood Cell Quality Analysis
Aditi Gupta, Delara Fadavi, Ismael Munoz, Kayla Ruggiero, Kelsey Dolk, Zack Borglin, Pedro Cabrales
Department of Bioengineering, University of California, San Diego, La Jolla, CA 92093, USA
Objective
To build a portable, inexpensive device that measures ATP levels of blood
directly after donation and uses that data, in conjunction with a deformability
test, to provide an individualized expiration date for blood donations.
Conclusion & Future Directions
Integration of the ATP quantification device with the deformability module will allow
clinicians to measure the biochemical and physical viability of RBCs. First, extensive
testing of the coupled modules is necessary in order to generate calibration curves
for each test. These relationships will allow for the estimation of viable storage length
of blood bags. The ability to better estimate the storage time will lead to a better
understanding of the efficacy of a blood transfusion. Incorporating an immobilized
reaction mix onto the cuvette will decrease the user’s effort in operating the device.
Cuvette
Holds the blood/reaction mix to be read by the luminometer
Luminometer
Quantifies the light emitted from the RBC-Luciferin Assay within the cuvette
Acknowledgements
We would like to thank Dr. Cabrales for his mentorship; Alex Williams, for advice and help
in the lab; Shawn Mailo for advice and the use of his design; Dr. Varghese for the use of
her plate reader; Dr. Cauwenberghs for his guidance on circuit design; and Dr. Mercola for
his overall guidance and productive design review meetings.
References
BioVision. (2013) StayBrite Highly Stable Luciferase Products: ATP Bioluminescence Assay
Kit Data Sheet. biovision.com.
Mailo, Shawn. “Shawn Mailo Instruction.” Personal Interview. Sept. 2014.
Thomas, Roland E., Albert L. Rosa, and Gregory J. Toussaint. The Analysis and Design of
Linear Circuits. 7th ed. Hoboken: WILEY, 2012. 1-225. Print.
Waltham, M.A.: Perkin Elmer, n.d. PDF Luminescence ATP Detection Assay System.
Background
15 million units of blood are transfused annually in the United States and the
current standard for red blood cell (RBC) storage is 42 days. Blood ages at
different rates, creating a two-fold problem: the waste of blood that is still viable,
and adverse reactions caused by transfusing deteriorated RBCs. There are no
current methods that test RBC quality. This design aims to determine
individualized blood donations’ expiration dates by testing two markers of RBC
quality: deformability and ATP content. A deformability test protocol and device
have previously been developed by Shawn Mailo. This project aims to create a
biochemical testing device to assess ATP quantity. ATP has been shown to vary
predictably in storage; the overall goal is to correlate ATP quantity upon donation
to transfusion quality over time, leading to a more accurate expiration date for
each individual blood bag. The proposed device contains three sub-designs, the
designs and testing of which are detailed in this poster.
Reagents
Biochemically quantifiy ATP through use of a modified assay
Design: A mix of highly stable luciferase, luciferin, reaction buffer, and oxidizing
agents were combined to (1) produce light proportional to the amount of ATP
present and (2) remove Hemoglobin (Hb) from the absorbance spectrum to
minimize interference with the signal.
Testing: Synthetic approximations of RBCs were formulated using Hemopure
and ATP standard; the reaction mix was tested for ability to produce light and to
oxidize Hb to metHb under various conditions within physiological parameters.
Results: Light was produced as expected, however the chosen method for
oxidizing the Hb (hydrogen peroxide) did not perform as desired.
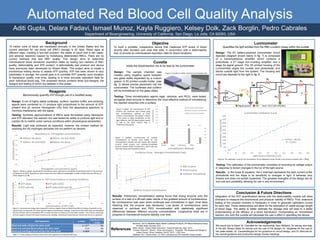
Testing: The calibration of the luminometer consisted of recording its voltage output
in response to known changes in the lux of the light source.
Results: In the linear fit equation, the y intercept represents the dark current of the
photodiode and the slope is its sensitivity to changes in light. It behaves very
linearly and does not exhibit hysteresis. The greatest strengths of the design are its
low-cost and portability, allowing for use in any environment.
Testing: Three immobilization agents (agar, cellulose, and PEG) were tested
alongside dried enzyme to determine the most effective method of immobilizing
the reaction enzymes onto a surface.
Results: Preliminary immobilization testing found that drying enzyme onto the
surface of a well of a 96-well plate results in the greatest amount of luminescence.
No luminescence was seen when luciferase was immobilized in agar, most likely
meaning that the enzyme was denatured. Low levels of luminescence were
observed in cellulose and PEG immobilization with statistically significant
differences between different enzyme concentrations. Longitudinal tests are in
progress to characterize enzyme stability over time.
Design: The sample chamber was
created using negative space between
two glass slides separated by a custom
spacer. A 3D printed cuvette holder (see
fig. 3) allows precise placement into the
luminometer. The luciferase and luciferin
will be immobilized on the glass slides.
Design: The 9V battery-powered luminometer circuit
depicted (diagram shown below in fig. 7) is composed
of a transimpedance amplifier which contains a
photodiode, a 2nd stage non-inverting amplifier, and a
stage for signal ground. The 3D printed housing of the
Luminometer aligns the cuvette and photodiode, and
blocks outside light from the system. The housing and
circuit are depicted to the right in fig. 6.
Figure 8: The calibration curve for the luminometer circuit displayed a linear fit with a very strong correlation (R2 = .9992).
Immobilization Methods
Dried Agar Cellulose PEG
Luminescence
Low enzyme concentration
Medium enzyme concentration
High enzyme concentration
-20000
-10000
0
10000
20000
30000
40000
50000
60000
0 0.2 0.4 0.6 0.8 1 1.2
Luminescence
Relative Enzyme Concentration
Luciferase Assay - Averaged Immobilization Data
Wet Enzyme
Dried Enzyme
Cellulose Immobilized
Figure 4 (right): The luminescence of ATP,
luciferin and luciferase were tested using
four immobilization methods at three
enzyme concentrations. The graph is shown
in two scales to allow visualization of the
agar, cellulose, and PEG data (bottom panel)
as well as the dried enzyme data in
comparison (top panel).
Figure 3: Cuvette in holder and close-up of sample well.
0.000
0.100
0.200
0.300
0.400
0.500
0.600
5 10 15 20 25 30 35 40
Absorbancevalues
Hemoglobin concentrations (g/dL)
Absorbance vs. Hemoglobin concentrations
492nm: Hb alone 492nm: Hb and H2O2
620nm: Hb and H2O2 610nm: Hb alone
0
5
10
15
20
25
30
35
200 300 400 500 600 700 800 900 1000
Luminescenceoutput
Concentration of ATP (nM)
Luminescence vs. ATP Concentrations in Varying Conditions
ATP alone ATP with H2O2
ATP with Hb ATP with H2O2 and Hb
y = 9.9742x + 48.978
R² = 0.9992
0
500
1000
1500
2000
2500
3000
3500
4000
4500
5000
0 50 100 150 200 250 300 350 400 450 500
LuminometerOutput(mV)
Light Source Intensity (Lux)
Luminometer Calibration Curve
Figure 5 (below): Luminescence of multiple
concentrations of enzyme were tested for two
immobilization methods and wet enzyme (the positive
control). Dried enzyme and cellulose-immobilized
enzyme showed similar luminescence, which was less
than that shown by the positive control.
Figure 1: Above is a graph visualizing the absorbance values obtained at varying Hb concentrations both in the presence
and absence of H2O2. Absorbances were measured at two different wavelengths in order to determine the efficacy of
H2O2 oxidation on Hb.
Figure 2: Luminescence output was measured in various reagent mixes to determine effect of various chemicals on the
overall assay. As expected, ATP alone had the highest luminescence readings. It was found that H2O2 does not destabilize
ATP, but Hb does seem to destabilize ATP, as shown by lower luminescence in the latter samples. The mixture containing
all three regents showed the lowest luminescence readings, meaning the hypothesized mixture did not act as expected.
Null hypothesis p-value
Significant? (p
< 0.05)
Blood and water will give the same result 2 x 10-15 Yes
Blood and sonicated blood will give the same result 0.14 No
Blood and centrifuged blood will give the same result 0.0008 Yes
Table 1: P-value analysis of various shear stress tests applied to rat blood for RBC lysis.