SlideShare a Scribd company logo
1 of 23
Download to read offline
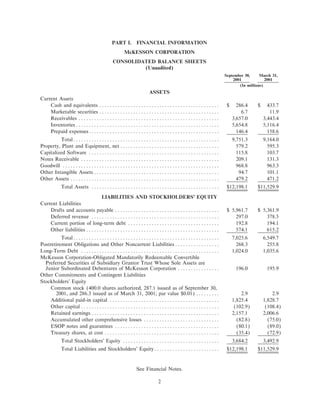
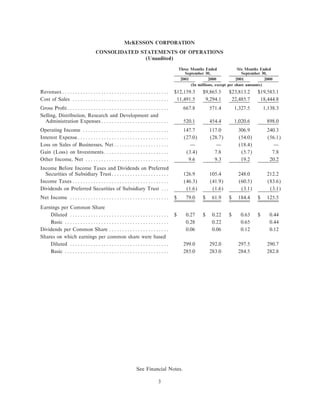
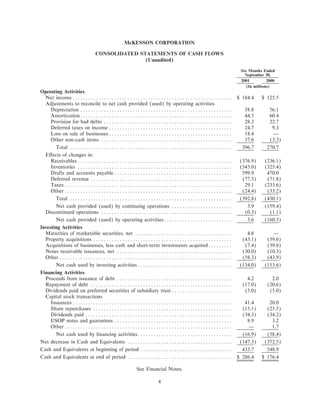
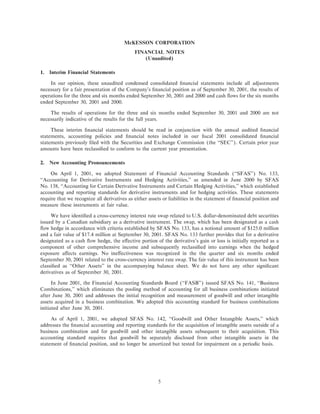
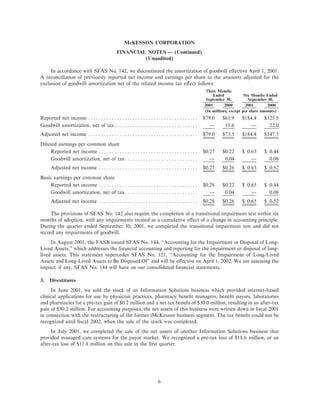
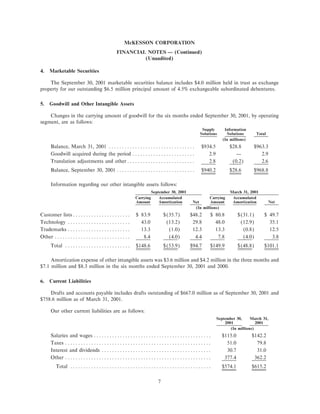
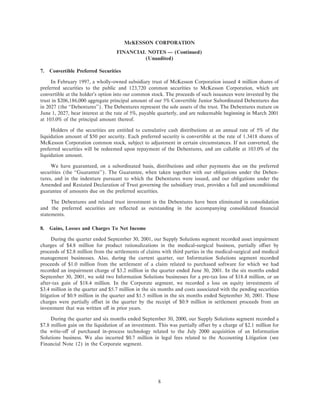
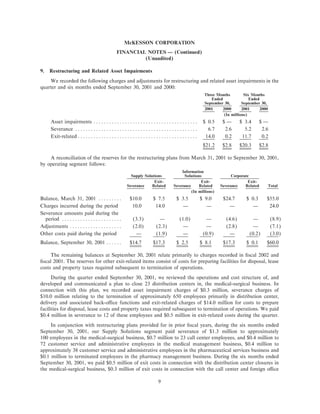
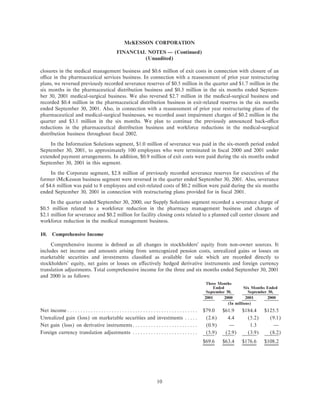
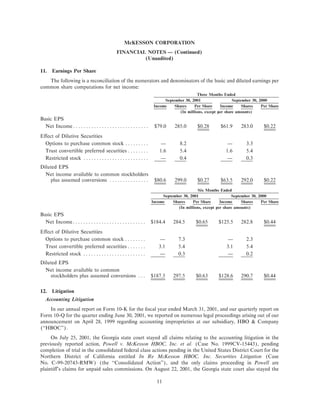
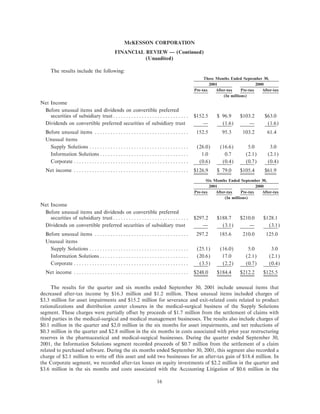
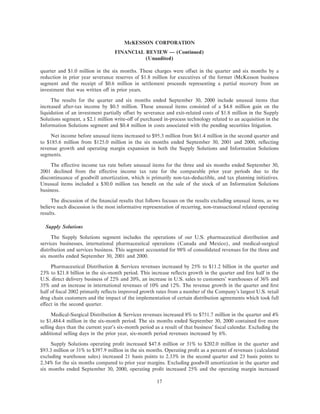
SECURITIES AND EXCHANGE COMMISSION
                                              Washington, D.C. 20549


                                                    Form 10-Q
(Mark One)
    ¥      QUARTERLY REPORT PURSUANT TO SECTION 13 OR 15(d)
           OF THE SECURITIES EXCHANGE ACT OF 1934
           For quarter ended September 30, 2001

    n      TRANSITION REPORT PURSUANT TO SECTION 13 OR 15(d)
           OF THE SECURITIES EXCHANGE ACT OF 1934
           For the transition period from                     to
                                            Commission Ñle number 1-13252


                             McKesson Corporation
                                      (Exact name of Registrant as speciÑed in its charter)

                        Delaware                                                          94-3207296
                (State or other jurisdiction of                                           (IRS Employer
               incorporation or organization)                                           IdentiÑcation No.)

     One Post Street, San Francisco, California                                                94104
           (Address of principal executive oÇces)                                             (Zip Code)

                                                      (415) 983-8300
                                      (Registrant's telephone number, including area code)

     Indicate by check mark whether the Registrant (1) has Ñled all reports required to be Ñled by Section 13
or 15(d) of the Securities Exchange Act of 1934 during the preceding 12 months (or for such shorter period
that the Registrant was required to Ñle such reports), and (2) has been subject to such Ñling requirements for
the past 90 days. Yes ¥        No n

     Indicate the number of shares outstanding of each of the issuer's classes of common stock, as of the latest
practicable date.
                                                                                         Outstanding at
                            Class                                                      September 30, 2001

            Common stock, $.01 par value                                              285,978,281 shares
McKESSON CORPORATION
                                        TABLE OF CONTENTS

Item                                                                                             Page

                                PART I. FINANCIAL INFORMATION
1.     Condensed Financial Statements
       Consolidated Balance Sheets
         September 30, 2001 and March 31, 2001ÏÏÏÏÏÏÏÏÏÏÏÏÏÏÏÏÏÏÏÏÏÏÏÏÏÏÏÏÏÏÏÏÏÏÏÏÏÏÏÏÏÏÏ           2
       Consolidated Statements of Operations
         Three and six-month periods ended September 30, 2001 and 2000 ÏÏÏÏÏÏÏÏÏÏÏÏÏÏÏÏÏÏÏÏÏ        3
       Consolidated Statements of Cash Flows
         Six-month periods ended September 30, 2001 and 2000 ÏÏÏÏÏÏÏÏÏÏÏÏÏÏÏÏÏÏÏÏÏÏÏÏÏÏÏÏÏÏ          4
       Financial Notes ÏÏÏÏÏÏÏÏÏÏÏÏÏÏÏÏÏÏÏÏÏÏÏÏÏÏÏÏÏÏÏÏÏÏÏÏÏÏÏÏÏÏÏÏÏÏÏÏÏÏÏÏÏÏÏÏÏÏÏÏÏÏÏÏÏÏ         5-13
2.     Management's Discussion and Analysis of Financial Condition and Results of Operations
         Financial Review ÏÏÏÏÏÏÏÏÏÏÏÏÏÏÏÏÏÏÏÏÏÏÏÏÏÏÏÏÏÏÏÏÏÏÏÏÏÏÏÏÏÏÏÏÏÏÏÏÏÏÏÏÏÏÏÏÏÏÏÏÏÏÏ        14-19
3.     Quantitative and Qualitative Disclosures about Market Risk ÏÏÏÏÏÏÏÏÏÏÏÏÏÏÏÏÏÏÏÏÏÏÏÏÏÏÏÏ      20

                                 PART II. OTHER INFORMATION
1.     Legal Proceedings ÏÏÏÏÏÏÏÏÏÏÏÏÏÏÏÏÏÏÏÏÏÏÏÏÏÏÏÏÏÏÏÏÏÏÏÏÏÏÏÏÏÏÏÏÏÏÏÏÏÏÏÏÏÏÏÏÏÏÏÏÏÏÏÏ          20
4.     Submission of Matters to a Vote of Security Holders ÏÏÏÏÏÏÏÏÏÏÏÏÏÏÏÏÏÏÏÏÏÏÏÏÏÏÏÏÏÏÏÏÏÏ      20
6.     Exhibits and Reports on Form 8-KÏÏÏÏÏÏÏÏÏÏÏÏÏÏÏÏÏÏÏÏÏÏÏÏÏÏÏÏÏÏÏÏÏÏÏÏÏÏÏÏÏÏÏÏÏÏÏÏÏÏ          21


                                                    1
PART I.   FINANCIAL INFORMATION
                                    McKESSON CORPORATION
                               CONSOLIDATED BALANCE SHEETS
                                        (Unaudited)
                                                                                 September 30,     March 31,
                                                                                     2001             2001
                                                                                        (In millions)
                                               ASSETS
Current Assets
    Cash and equivalents ÏÏÏÏÏÏÏÏÏÏÏÏÏÏÏÏÏÏÏÏÏÏÏÏÏÏÏÏÏÏÏÏÏÏÏÏÏÏÏÏÏÏÏÏÏÏ           $     286.4    $     433.7
    Marketable securities ÏÏÏÏÏÏÏÏÏÏÏÏÏÏÏÏÏÏÏÏÏÏÏÏÏÏÏÏÏÏÏÏÏÏÏÏÏÏÏÏÏÏÏÏÏÏ                  6.7           11.9
    Receivables ÏÏÏÏÏÏÏÏÏÏÏÏÏÏÏÏÏÏÏÏÏÏÏÏÏÏÏÏÏÏÏÏÏÏÏÏÏÏÏÏÏÏÏÏÏÏÏÏÏÏÏÏÏÏ                3,657.0        3,443.4
    InventoriesÏÏÏÏÏÏÏÏÏÏÏÏÏÏÏÏÏÏÏÏÏÏÏÏÏÏÏÏÏÏÏÏÏÏÏÏÏÏÏÏÏÏÏÏÏÏÏÏÏÏÏÏÏÏÏ                5,654.8        5,116.4
    Prepaid expensesÏÏÏÏÏÏÏÏÏÏÏÏÏÏÏÏÏÏÏÏÏÏÏÏÏÏÏÏÏÏÏÏÏÏÏÏÏÏÏÏÏÏÏÏÏÏÏÏÏÏ                  146.4          158.6
          TotalÏÏÏÏÏÏÏÏÏÏÏÏÏÏÏÏÏÏÏÏÏÏÏÏÏÏÏÏÏÏÏÏÏÏÏÏÏÏÏÏÏÏÏÏÏÏÏÏÏÏÏÏÏÏÏÏ               9,751.3        9,164.0
Property, Plant and Equipment, net ÏÏÏÏÏÏÏÏÏÏÏÏÏÏÏÏÏÏÏÏÏÏÏÏÏÏÏÏÏÏÏÏÏÏÏÏÏÏ               579.2          595.3
Capitalized Software ÏÏÏÏÏÏÏÏÏÏÏÏÏÏÏÏÏÏÏÏÏÏÏÏÏÏÏÏÏÏÏÏÏÏÏÏÏÏÏÏÏÏÏÏÏÏÏÏÏÏ                 115.8          103.7
Notes Receivable ÏÏÏÏÏÏÏÏÏÏÏÏÏÏÏÏÏÏÏÏÏÏÏÏÏÏÏÏÏÏÏÏÏÏÏÏÏÏÏÏÏÏÏÏÏÏÏÏÏÏÏÏÏ                  209.1          131.3
Goodwill ÏÏÏÏÏÏÏÏÏÏÏÏÏÏÏÏÏÏÏÏÏÏÏÏÏÏÏÏÏÏÏÏÏÏÏÏÏÏÏÏÏÏÏÏÏÏÏÏÏÏÏÏÏÏÏÏÏÏÏÏ                   968.8          963.3
Other Intangible Assets ÏÏÏÏÏÏÏÏÏÏÏÏÏÏÏÏÏÏÏÏÏÏÏÏÏÏÏÏÏÏÏÏÏÏÏÏÏÏÏÏÏÏÏÏÏÏÏÏ                 94.7          101.1
Other Assets ÏÏÏÏÏÏÏÏÏÏÏÏÏÏÏÏÏÏÏÏÏÏÏÏÏÏÏÏÏÏÏÏÏÏÏÏÏÏÏÏÏÏÏÏÏÏÏÏÏÏÏÏÏÏÏÏÏ                  479.2          471.2
         Total Assets ÏÏÏÏÏÏÏÏÏÏÏÏÏÏÏÏÏÏÏÏÏÏÏÏÏÏÏÏÏÏÏÏÏÏÏÏÏÏÏÏÏÏÏÏÏÏÏÏÏ           $12,198.1      $11,529.9
                            LIABILITIES AND STOCKHOLDERS' EQUITY
Current Liabilities
    Drafts and accounts payable ÏÏÏÏÏÏÏÏÏÏÏÏÏÏÏÏÏÏÏÏÏÏÏÏÏÏÏÏÏÏÏÏÏÏÏÏÏÏÏÏ          $ 5,961.7      $ 5,361.9
    Deferred revenue ÏÏÏÏÏÏÏÏÏÏÏÏÏÏÏÏÏÏÏÏÏÏÏÏÏÏÏÏÏÏÏÏÏÏÏÏÏÏÏÏÏÏÏÏÏÏÏÏÏ                297.0          378.5
    Current portion of long-term debt ÏÏÏÏÏÏÏÏÏÏÏÏÏÏÏÏÏÏÏÏÏÏÏÏÏÏÏÏÏÏÏÏÏÏÏ             192.8          194.1
    Other liabilities ÏÏÏÏÏÏÏÏÏÏÏÏÏÏÏÏÏÏÏÏÏÏÏÏÏÏÏÏÏÏÏÏÏÏÏÏÏÏÏÏÏÏÏÏÏÏÏÏÏÏÏ             574.1          615.2
          TotalÏÏÏÏÏÏÏÏÏÏÏÏÏÏÏÏÏÏÏÏÏÏÏÏÏÏÏÏÏÏÏÏÏÏÏÏÏÏÏÏÏÏÏÏÏÏÏÏÏÏÏÏÏÏÏÏ               7,025.6        6,549.7
Postretirement Obligations and Other Noncurrent Liabilities ÏÏÏÏÏÏÏÏÏÏÏÏÏÏÏÏÏ           268.3          255.8
Long-Term Debt ÏÏÏÏÏÏÏÏÏÏÏÏÏÏÏÏÏÏÏÏÏÏÏÏÏÏÏÏÏÏÏÏÏÏÏÏÏÏÏÏÏÏÏÏÏÏÏÏÏÏÏÏÏ                  1,024.0        1,035.6
McKesson Corporation-Obligated Mandatorily Redeemable Convertible
  Preferred Securities of Subsidiary Grantor Trust Whose Sole Assets are
  Junior Subordinated Debentures of McKesson Corporation ÏÏÏÏÏÏÏÏÏÏÏÏÏÏÏÏ              196.0          195.9
Other Commitments and Contingent Liabilities
Stockholders' Equity
     Common stock (400.0 shares authorized, 287.1 issued as of September 30,
       2001, and 286.3 issued as of March 31, 2001; par value $0.01) ÏÏÏÏÏÏÏÏÏ            2.9            2.9
     Additional paid-in capital ÏÏÏÏÏÏÏÏÏÏÏÏÏÏÏÏÏÏÏÏÏÏÏÏÏÏÏÏÏÏÏÏÏÏÏÏÏÏÏÏÏÏ            1,825.4        1,828.7
     Other capital ÏÏÏÏÏÏÏÏÏÏÏÏÏÏÏÏÏÏÏÏÏÏÏÏÏÏÏÏÏÏÏÏÏÏÏÏÏÏÏÏÏÏÏÏÏÏÏÏÏÏÏÏÏ               (102.9)       (108.4)
     Retained earnings ÏÏÏÏÏÏÏÏÏÏÏÏÏÏÏÏÏÏÏÏÏÏÏÏÏÏÏÏÏÏÏÏÏÏÏÏÏÏÏÏÏÏÏÏÏÏÏÏÏ              2,157.1        2,006.6
     Accumulated other comprehensive losses ÏÏÏÏÏÏÏÏÏÏÏÏÏÏÏÏÏÏÏÏÏÏÏÏÏÏÏÏÏ               (82.8)         (75.0)
     ESOP notes and guarantees ÏÏÏÏÏÏÏÏÏÏÏÏÏÏÏÏÏÏÏÏÏÏÏÏÏÏÏÏÏÏÏÏÏÏÏÏÏÏÏÏ                 (80.1)         (89.0)
     Treasury shares, at cost ÏÏÏÏÏÏÏÏÏÏÏÏÏÏÏÏÏÏÏÏÏÏÏÏÏÏÏÏÏÏÏÏÏÏÏÏÏÏÏÏÏÏÏÏ              (35.4)         (72.9)
         Total Stockholders' Equity ÏÏÏÏÏÏÏÏÏÏÏÏÏÏÏÏÏÏÏÏÏÏÏÏÏÏÏÏÏÏÏÏÏÏÏÏÏ             3,684.2        3,492.9
         Total Liabilities and Stockholders' EquityÏÏÏÏÏÏÏÏÏÏÏÏÏÏÏÏÏÏÏÏÏÏÏÏÏ      $12,198.1      $11,529.9


                                         See Financial Notes.

                                                   2
McKESSON CORPORATION
                        CONSOLIDATED STATEMENTS OF OPERATIONS
                                      (Unaudited)

                                                                Three Months Ended               Six Months Ended
                                                                   September 30,                   September 30,
                                                                 2001           2000            2001          2000
                                                                      (In millions, except per share amounts)
RevenuesÏÏÏÏÏÏÏÏÏÏÏÏÏÏÏÏÏÏÏÏÏÏÏÏÏÏÏÏÏÏÏÏÏÏÏÏÏÏÏÏÏ           $12,159.3        $9,865.5     $23,813.2       $19,583.1
Cost of Sales ÏÏÏÏÏÏÏÏÏÏÏÏÏÏÏÏÏÏÏÏÏÏÏÏÏÏÏÏÏÏÏÏÏÏÏÏÏ          11,491.5         9,294.1      22,485.7        18,444.8
Gross ProÑtÏÏÏÏÏÏÏÏÏÏÏÏÏÏÏÏÏÏÏÏÏÏÏÏÏÏÏÏÏÏÏÏÏÏÏÏÏÏÏ                667.8          571.4        1,327.5         1,138.3
Selling, Distribution, Research and Development and
  Administration ExpensesÏÏÏÏÏÏÏÏÏÏÏÏÏÏÏÏÏÏÏÏÏÏÏÏÏÏ               520.1          454.4        1,020.6          898.0
Operating Income ÏÏÏÏÏÏÏÏÏÏÏÏÏÏÏÏÏÏÏÏÏÏÏÏÏÏÏÏÏÏÏÏÏ                147.7          117.0         306.9           240.3
Interest ExpenseÏÏÏÏÏÏÏÏÏÏÏÏÏÏÏÏÏÏÏÏÏÏÏÏÏÏÏÏÏÏÏÏÏÏÏ               (27.0)         (28.7)        (54.0)          (56.1)
Loss on Sales of Businesses, Net ÏÏÏÏÏÏÏÏÏÏÏÏÏÏÏÏÏÏÏÏÏ              Ì              Ì           (18.4)            Ì
Gain (Loss) on InvestmentsÏÏÏÏÏÏÏÏÏÏÏÏÏÏÏÏÏÏÏÏÏÏÏÏÏ                (3.4)           7.8          (5.7)            7.8
Other Income, Net ÏÏÏÏÏÏÏÏÏÏÏÏÏÏÏÏÏÏÏÏÏÏÏÏÏÏÏÏÏÏÏÏ                  9.6            9.3          19.2            20.2
Income Before Income Taxes and Dividends on Preferred
  Securities of Subsidiary TrustÏÏÏÏÏÏÏÏÏÏÏÏÏÏÏÏÏÏÏÏÏÏ            126.9          105.4         248.0           212.2
Income Taxes ÏÏÏÏÏÏÏÏÏÏÏÏÏÏÏÏÏÏÏÏÏÏÏÏÏÏÏÏÏÏÏÏÏÏÏÏÏ                (46.3)         (41.9)        (60.5)          (83.6)
Dividends on Preferred Securities of Subsidiary Trust ÏÏÏ          (1.6)          (1.6)         (3.1)           (3.1)
Net Income ÏÏÏÏÏÏÏÏÏÏÏÏÏÏÏÏÏÏÏÏÏÏÏÏÏÏÏÏÏÏÏÏÏÏÏÏÏÏ           $      79.0      $    61.9    $    184.4      $    125.5
Earnings per Common Share
    Diluted ÏÏÏÏÏÏÏÏÏÏÏÏÏÏÏÏÏÏÏÏÏÏÏÏÏÏÏÏÏÏÏÏÏÏÏÏÏÏ          $      0.27      $    0.22    $      0.63     $     0.44
    Basic ÏÏÏÏÏÏÏÏÏÏÏÏÏÏÏÏÏÏÏÏÏÏÏÏÏÏÏÏÏÏÏÏÏÏÏÏÏÏÏÏ                 0.28           0.22           0.65           0.44
Dividends per Common Share ÏÏÏÏÏÏÏÏÏÏÏÏÏÏÏÏÏÏÏÏÏÏÏ                 0.06           0.06           0.12           0.12
Shares on which earnings per common share were based
    Diluted ÏÏÏÏÏÏÏÏÏÏÏÏÏÏÏÏÏÏÏÏÏÏÏÏÏÏÏÏÏÏÏÏÏÏÏÏÏÏ                299.0          292.0         297.5           290.7
    Basic ÏÏÏÏÏÏÏÏÏÏÏÏÏÏÏÏÏÏÏÏÏÏÏÏÏÏÏÏÏÏÏÏÏÏÏÏÏÏÏÏ                285.0          283.0         284.5           282.8


                                          See Financial Notes.

                                                    3
McKESSON CORPORATION

                        CONSOLIDATED STATEMENTS OF CASH FLOWS
                                       (Unaudited)

                                                                                        Six Months Ended
                                                                                          September 30,
                                                                                        2001          2000
                                                                                           (In millions)
Operating Activities
  Net income ÏÏÏÏÏÏÏÏÏÏÏÏÏÏÏÏÏÏÏÏÏÏÏÏÏÏÏÏÏÏÏÏÏÏÏÏÏÏÏÏÏÏÏÏÏÏÏÏÏÏÏÏÏÏÏÏÏÏÏÏÏ             $ 184.4     $ 125.5
  Adjustments to reconcile to net cash provided (used) by operating activities
     Depreciation ÏÏÏÏÏÏÏÏÏÏÏÏÏÏÏÏÏÏÏÏÏÏÏÏÏÏÏÏÏÏÏÏÏÏÏÏÏÏÏÏÏÏÏÏÏÏÏÏÏÏÏÏÏÏÏÏÏÏ              58.8        56.1
     AmortizationÏÏÏÏÏÏÏÏÏÏÏÏÏÏÏÏÏÏÏÏÏÏÏÏÏÏÏÏÏÏÏÏÏÏÏÏÏÏÏÏÏÏÏÏÏÏÏÏÏÏÏÏÏÏÏÏÏÏ               44.5        60.4
     Provision for bad debts ÏÏÏÏÏÏÏÏÏÏÏÏÏÏÏÏÏÏÏÏÏÏÏÏÏÏÏÏÏÏÏÏÏÏÏÏÏÏÏÏÏÏÏÏÏÏÏÏÏ            28.3        22.7
     Deferred taxes on income ÏÏÏÏÏÏÏÏÏÏÏÏÏÏÏÏÏÏÏÏÏÏÏÏÏÏÏÏÏÏÏÏÏÏÏÏÏÏÏÏÏÏÏÏÏÏÏ             24.7         9.3
     Loss on sale of businesses ÏÏÏÏÏÏÏÏÏÏÏÏÏÏÏÏÏÏÏÏÏÏÏÏÏÏÏÏÏÏÏÏÏÏÏÏÏÏÏÏÏÏÏÏÏÏÏ           18.4          Ì
     Other non-cash items ÏÏÏÏÏÏÏÏÏÏÏÏÏÏÏÏÏÏÏÏÏÏÏÏÏÏÏÏÏÏÏÏÏÏÏÏÏÏÏÏÏÏÏÏÏÏÏÏÏÏ              37.6        (3.3)
        Total ÏÏÏÏÏÏÏÏÏÏÏÏÏÏÏÏÏÏÏÏÏÏÏÏÏÏÏÏÏÏÏÏÏÏÏÏÏÏÏÏÏÏÏÏÏÏÏÏÏÏÏÏÏÏÏÏÏÏÏÏÏÏ             396.7       270.7
  EÅects of changes in:
     Receivables ÏÏÏÏÏÏÏÏÏÏÏÏÏÏÏÏÏÏÏÏÏÏÏÏÏÏÏÏÏÏÏÏÏÏÏÏÏÏÏÏÏÏÏÏÏÏÏÏÏÏÏÏÏÏÏÏÏÏÏ            (376.9)     (236.1)
     Inventories ÏÏÏÏÏÏÏÏÏÏÏÏÏÏÏÏÏÏÏÏÏÏÏÏÏÏÏÏÏÏÏÏÏÏÏÏÏÏÏÏÏÏÏÏÏÏÏÏÏÏÏÏÏÏÏÏÏÏÏ            (543.0)     (325.4)
     Drafts and accounts payable ÏÏÏÏÏÏÏÏÏÏÏÏÏÏÏÏÏÏÏÏÏÏÏÏÏÏÏÏÏÏÏÏÏÏÏÏÏÏÏÏÏÏÏÏÏ           599.9       470.0
     Deferred revenue ÏÏÏÏÏÏÏÏÏÏÏÏÏÏÏÏÏÏÏÏÏÏÏÏÏÏÏÏÏÏÏÏÏÏÏÏÏÏÏÏÏÏÏÏÏÏÏÏÏÏÏÏÏÏ             (77.5)      (71.8)
     Taxes ÏÏÏÏÏÏÏÏÏÏÏÏÏÏÏÏÏÏÏÏÏÏÏÏÏÏÏÏÏÏÏÏÏÏÏÏÏÏÏÏÏÏÏÏÏÏÏÏÏÏÏÏÏÏÏÏÏÏÏÏÏÏÏÏ               29.1      (233.6)
     Other ÏÏÏÏÏÏÏÏÏÏÏÏÏÏÏÏÏÏÏÏÏÏÏÏÏÏÏÏÏÏÏÏÏÏÏÏÏÏÏÏÏÏÏÏÏÏÏÏÏÏÏÏÏÏÏÏÏÏÏÏÏÏÏÏ              (24.4)      (33.2)
        Total ÏÏÏÏÏÏÏÏÏÏÏÏÏÏÏÏÏÏÏÏÏÏÏÏÏÏÏÏÏÏÏÏÏÏÏÏÏÏÏÏÏÏÏÏÏÏÏÏÏÏÏÏÏÏÏÏÏÏÏÏÏÏ            (392.8)     (430.1)
        Net cash provided (used) by continuing operations ÏÏÏÏÏÏÏÏÏÏÏÏÏÏÏÏÏÏÏÏÏÏÏ          3.9      (159.4)
  Discontinued operations ÏÏÏÏÏÏÏÏÏÏÏÏÏÏÏÏÏÏÏÏÏÏÏÏÏÏÏÏÏÏÏÏÏÏÏÏÏÏÏÏÏÏÏÏÏÏÏÏÏÏ              (0.3)       (1.1)
        Net cash provided (used) by operating activitiesÏÏÏÏÏÏÏÏÏÏÏÏÏÏÏÏÏÏÏÏÏÏÏÏÏÏ         3.6      (160.5)
Investing Activities
  Maturities of marketable securities, net ÏÏÏÏÏÏÏÏÏÏÏÏÏÏÏÏÏÏÏÏÏÏÏÏÏÏÏÏÏÏÏÏÏÏÏÏÏ           4.8          Ì
  Property acquisitions ÏÏÏÏÏÏÏÏÏÏÏÏÏÏÏÏÏÏÏÏÏÏÏÏÏÏÏÏÏÏÏÏÏÏÏÏÏÏÏÏÏÏÏÏÏÏÏÏÏÏÏÏÏ            (43.1)      (59.6)
  Acquisitions of businesses, less cash and short-term investments acquiredÏÏÏÏÏÏÏÏÏ      (7.4)      (39.8)
  Notes receivable issuances, net ÏÏÏÏÏÏÏÏÏÏÏÏÏÏÏÏÏÏÏÏÏÏÏÏÏÏÏÏÏÏÏÏÏÏÏÏÏÏÏÏÏÏÏÏ           (30.0)      (10.3)
  Other ÏÏÏÏÏÏÏÏÏÏÏÏÏÏÏÏÏÏÏÏÏÏÏÏÏÏÏÏÏÏÏÏÏÏÏÏÏÏÏÏÏÏÏÏÏÏÏÏÏÏÏÏÏÏÏÏÏÏÏÏÏÏÏÏÏÏ               (58.3)      (43.9)
        Net cash used by investing activities ÏÏÏÏÏÏÏÏÏÏÏÏÏÏÏÏÏÏÏÏÏÏÏÏÏÏÏÏÏÏÏÏÏÏÏÏ      (134.0)     (153.6)
Financing Activities
  Proceeds from issuance of debt ÏÏÏÏÏÏÏÏÏÏÏÏÏÏÏÏÏÏÏÏÏÏÏÏÏÏÏÏÏÏÏÏÏÏÏÏÏÏÏÏÏÏÏÏ              4.2         2.0
  Repayment of debt ÏÏÏÏÏÏÏÏÏÏÏÏÏÏÏÏÏÏÏÏÏÏÏÏÏÏÏÏÏÏÏÏÏÏÏÏÏÏÏÏÏÏÏÏÏÏÏÏÏÏÏÏÏÏ               (17.0)      (20.6)
  Dividends paid on preferred securities of subsidiary trust ÏÏÏÏÏÏÏÏÏÏÏÏÏÏÏÏÏÏÏÏÏÏÏ      (5.0)       (5.0)
  Capital stock transactions
     Issuances ÏÏÏÏÏÏÏÏÏÏÏÏÏÏÏÏÏÏÏÏÏÏÏÏÏÏÏÏÏÏÏÏÏÏÏÏÏÏÏÏÏÏÏÏÏÏÏÏÏÏÏÏÏÏÏÏÏÏÏÏÏ              41.4        20.0
     Share repurchases ÏÏÏÏÏÏÏÏÏÏÏÏÏÏÏÏÏÏÏÏÏÏÏÏÏÏÏÏÏÏÏÏÏÏÏÏÏÏÏÏÏÏÏÏÏÏÏÏÏÏÏÏÏ             (15.1)      (25.5)
     Dividends paid ÏÏÏÏÏÏÏÏÏÏÏÏÏÏÏÏÏÏÏÏÏÏÏÏÏÏÏÏÏÏÏÏÏÏÏÏÏÏÏÏÏÏÏÏÏÏÏÏÏÏÏÏÏÏÏÏ             (34.3)      (34.2)
     ESOP notes and guarantees ÏÏÏÏÏÏÏÏÏÏÏÏÏÏÏÏÏÏÏÏÏÏÏÏÏÏÏÏÏÏÏÏÏÏÏÏÏÏÏÏÏÏÏÏÏ               8.9         3.2
     Other ÏÏÏÏÏÏÏÏÏÏÏÏÏÏÏÏÏÏÏÏÏÏÏÏÏÏÏÏÏÏÏÏÏÏÏÏÏÏÏÏÏÏÏÏÏÏÏÏÏÏÏÏÏÏÏÏÏÏÏÏÏÏÏÏ                 Ì          1.7
        Net cash used by Ñnancing activitiesÏÏÏÏÏÏÏÏÏÏÏÏÏÏÏÏÏÏÏÏÏÏÏÏÏÏÏÏÏÏÏÏÏÏÏÏ         (16.9)      (58.4)
Net decrease in Cash and Equivalents ÏÏÏÏÏÏÏÏÏÏÏÏÏÏÏÏÏÏÏÏÏÏÏÏÏÏÏÏÏÏÏÏÏÏÏÏÏÏÏÏ           (147.3)     (372.5)
Cash and Equivalents at beginning of period ÏÏÏÏÏÏÏÏÏÏÏÏÏÏÏÏÏÏÏÏÏÏÏÏÏÏÏÏÏÏÏÏÏÏÏ          433.7       548.9
Cash and Equivalents at end of period ÏÏÏÏÏÏÏÏÏÏÏÏÏÏÏÏÏÏÏÏÏÏÏÏÏÏÏÏÏÏÏÏÏÏÏÏÏÏÏÏ         $ 286.4     $ 176.4

                                          See Financial Notes.

                                                   4
McKESSON CORPORATION
                                             FINANCIAL NOTES
                                                (Unaudited)

1.   Interim Financial Statements

    In our opinion, these unaudited condensed consolidated Ñnancial statements include all adjustments
necessary for a fair presentation of the Company's Ñnancial position as of September 30, 2001, the results of
operations for the three and six months ended September 30, 2001 and 2000 and cash Öows for the six months
ended September 30, 2001 and 2000.

    The results of operations for the three and six months ended September 30, 2001 and 2000 are not
necessarily indicative of the results for the full years.

     These interim Ñnancial statements should be read in conjunction with the annual audited Ñnancial
statements, accounting policies and Ñnancial notes included in our Ñscal 2001 consolidated Ñnancial
statements previously Ñled with the Securities and Exchange Commission (the quot;quot;SEC''). Certain prior year
amounts have been reclassiÑed to conform to the current year presentation.

2.   New Accounting Pronouncements

     On April 1, 2001, we adopted Statement of Financial Accounting Standards (quot;quot;SFAS'') No. 133,
quot;quot;Accounting for Derivative Instruments and Hedging Activities,'' as amended in June 2000 by SFAS
No. 138, quot;quot;Accounting for Certain Derivative Instruments and Certain Hedging Activities,'' which established
accounting and reporting standards for derivative instruments and for hedging activities. These statements
require that we recognize all derivatives as either assets or liabilities in the statement of Ñnancial position and
measure these instruments at fair value.

     We have identiÑed a cross-currency interest rate swap related to U.S. dollar-denominated debt securities
issued by a Canadian subsidiary as a derivative instrument. The swap, which has been designated as a cash
Öow hedge in accordance with criteria established by SFAS No. 133, has a notional amount of $125.0 million
and a fair value of $17.4 million at September 30, 2001. SFAS No. 133 further provides that for a derivative
designated as a cash Öow hedge, the eÅective portion of the derivative's gain or loss is initially reported as a
component of other comprehensive income and subsequently reclassiÑed into earnings when the hedged
exposure aÅects earnings. No ineÅectiveness was recognized in the the quarter and six months ended
September 30, 2001 related to the cross-currency interest rate swap. The fair value of this instrument has been
classiÑed as quot;quot;Other Assets'' in the accompanying balance sheet. We do not have any other signiÑcant
derivatives as of September 30, 2001.

      In June 2001, the Financial Accounting Standards Board (quot;quot;FASB'') issued SFAS No. 141, quot;quot;Business
Combinations,'' which eliminates the pooling method of accounting for all business combinations initiated
after June 30, 2001 and addresses the initial recognition and measurement of goodwill and other intangible
assets acquired in a business combination. We adopted this accounting standard for business combinations
initiated after June 30, 2001.

     As of April 1, 2001, we adopted SFAS No. 142, quot;quot;Goodwill and Other Intangible Assets,'' which
addresses the Ñnancial accounting and reporting standards for the acquisition of intangible assets outside of a
business combination and for goodwill and other intangible assets subsequent to their acquisition. This
accounting standard requires that goodwill be separately disclosed from other intangible assets in the
statement of Ñnancial position, and no longer be amortized but tested for impairment on a periodic basis.


                                                        5
McKESSON CORPORATION
                                    FINANCIAL NOTES Ì (Continued)
                                             (Unaudited)

     In accordance with SFAS No. 142, we discontinued the amortization of goodwill eÅective April 1, 2001.
A reconciliation of previously reported net income and earnings per share to the amounts adjusted for the
exclusion of goodwill amortization net of the related income tax eÅect follows:
                                                                               Three Months
                                                                                   Ended            Six Months Ended
                                                                               September 30,          September 30,
                                                                              2001       2000        2001       2000
                                                                              (In millions, except per share amounts)
Reported net income ÏÏÏÏÏÏÏÏÏÏÏÏÏÏÏÏÏÏÏÏÏÏÏÏÏÏÏÏÏÏÏÏÏÏÏÏÏÏÏÏÏÏ               $79.0     $61.9      $184.4     $125.5
Goodwill amortization, net of taxÏÏÏÏÏÏÏÏÏÏÏÏÏÏÏÏÏÏÏÏÏÏÏÏÏÏÏÏÏÏÏÏ              Ì        11.6         Ì         22.0
Adjusted net income ÏÏÏÏÏÏÏÏÏÏÏÏÏÏÏÏÏÏÏÏÏÏÏÏÏÏÏÏÏÏÏÏÏÏÏÏÏÏÏÏÏÏ               $79.0     $73.5      $184.4     $147.5
Diluted earnings per common share
    Reported net income ÏÏÏÏÏÏÏÏÏÏÏÏÏÏÏÏÏÏÏÏÏÏÏÏÏÏÏÏÏÏÏÏÏÏÏÏÏÏ               $0.27     $0.22      $ 0.63     $ 0.44
    Goodwill amortization, net of taxÏÏÏÏÏÏÏÏÏÏÏÏÏÏÏÏÏÏÏÏÏÏÏÏÏÏÏÏ               Ì       0.04          Ì        0.08
     Adjusted net income ÏÏÏÏÏÏÏÏÏÏÏÏÏÏÏÏÏÏÏÏÏÏÏÏÏÏÏÏÏÏÏÏÏÏÏÏÏÏ              $0.27     $0.26      $ 0.63     $ 0.52
Basic earnings per common share
    Reported net income ÏÏÏÏÏÏÏÏÏÏÏÏÏÏÏÏÏÏÏÏÏÏÏÏÏÏÏÏÏÏÏÏÏÏÏÏÏÏ               $0.28     $0.22      $ 0.65     $ 0.44
    Goodwill amortization, net of taxÏÏÏÏÏÏÏÏÏÏÏÏÏÏÏÏÏÏÏÏÏÏÏÏÏÏÏÏ               Ì       0.04          Ì        0.08
     Adjusted net income ÏÏÏÏÏÏÏÏÏÏÏÏÏÏÏÏÏÏÏÏÏÏÏÏÏÏÏÏÏÏÏÏÏÏÏÏÏÏ              $0.28     $0.26      $ 0.65     $ 0.52

     The provisions of SFAS No. 142 also require the completion of a transitional impairment test within six
months of adoption, with any impairments treated as a cumulative eÅect of a change in accounting principle.
During the quarter ended September 30, 2001, we completed the transitional impairment test and did not
record any impairments of goodwill.
     In August 2001, the FASB issued SFAS No. 144, quot;quot;Accounting for the Impairment or Disposal of Long-
Lived Assets,'' which addresses the Ñnancial accounting and reporting for the impairment or disposal of long-
lived assets. This statement supercedes SFAS No. 121, quot;quot;Accounting for the Impairment of Long-Lived
Assets and Long-Lived Assets to Be Disposed Of'' and will be eÅective on April 1, 2002. We are assessing the
impact, if any, SFAS No. 144 will have on our consolidated Ñnancial statements.

3.   Divestitures
     In June 2001, we sold the stock of an Information Solutions business which provided internet-based
clinical applications for use by physician practices, pharmacy beneÑt managers, beneÑt payors, laboratories
and pharmacies for a pre-tax gain of $0.2 million and a net tax beneÑt of $30.0 million, resulting in an after-tax
gain of $30.2 million. For accounting purposes, the net assets of this business were written down in Ñscal 2001
in connection with the restructuring of the former iMcKesson business segment. The tax beneÑt could not be
recognized until Ñscal 2002, when the sale of the stock was completed.
     In July 2001, we completed the sale of the net assets of another Information Solutions business that
provided managed care systems for the payor market. We recognized a pre-tax loss of $18.6 million, or an
after-tax loss of $11.8 million on this sale in the Ñrst quarter.


                                                        6
McKESSON CORPORATION
                                    FINANCIAL NOTES Ì (Continued)
                                             (Unaudited)

4.   Marketable Securities

    The September 30, 2001 marketable securities balance includes $4.0 million held in trust as exchange
property for our outstanding $6.5 million principal amount of 4.5% exchangeable subordinated debentures.

5.   Goodwill and Other Intangible Assets

    Changes in the carrying amount of goodwill for the six months ended September 30, 2001, by operating
segment, are as follows:
                                                                                  Supply       Information
                                                                                 Solutions      Solutions       Total
                                                                                              (In millions)
     Balance, March 31, 2001 ÏÏÏÏÏÏÏÏÏÏÏÏÏÏÏÏÏÏÏÏÏÏÏÏÏÏÏÏÏÏÏÏÏ                    $934.5          $28.8       $963.3
     Goodwill acquired during the period ÏÏÏÏÏÏÏÏÏÏÏÏÏÏÏÏÏÏÏÏÏÏÏÏ                    2.9            Ì            2.9
     Translation adjustments and other ÏÏÏÏÏÏÏÏÏÏÏÏÏÏÏÏÏÏÏÏÏÏÏÏÏÏ                    2.8           (0.2)         2.6
     Balance, September 30, 2001 ÏÏÏÏÏÏÏÏÏÏÏÏÏÏÏÏÏÏÏÏÏÏÏÏÏÏÏÏÏÏ                   $940.2          $28.6       $968.8

     Information regarding our other intangible assets follows:
                                                        September 30, 2001                        March 31, 2001
                                             Carrying       Accumulated                Carrying    Accumulated
                                             Amount         Amortization      Net      Amount      Amortization         Net
                                                                               (In millions)
Customer lists ÏÏÏÏÏÏÏÏÏÏÏÏÏÏÏÏÏÏÏÏÏÏ        $ 83.9            $(35.7)       $48.2     $ 80.8         $(31.1)       $ 49.7
Technology ÏÏÏÏÏÏÏÏÏÏÏÏÏÏÏÏÏÏÏÏÏÏÏÏ            43.0             (13.2)        29.8       48.0          (12.9)         35.1
Trademarks ÏÏÏÏÏÏÏÏÏÏÏÏÏÏÏÏÏÏÏÏÏÏÏÏ            13.3              (1.0)        12.3       13.3           (0.8)         12.5
Other ÏÏÏÏÏÏÏÏÏÏÏÏÏÏÏÏÏÏÏÏÏÏÏÏÏÏÏÏÏ             8.4              (4.0)         4.4        7.8           (4.0)          3.8
     Total ÏÏÏÏÏÏÏÏÏÏÏÏÏÏÏÏÏÏÏÏÏÏÏÏÏ         $148.6            $(53.9)       $94.7     $149.9         $(48.8)       $101.1

     Amortization expense of other intangible assets was $3.6 million and $4.2 million in the three months and
$7.1 million and $8.3 million in the six months ended September 30, 2001 and 2000.

6.   Current Liabilities

    Drafts and accounts payable includes drafts outstanding of $667.0 million as of September 30, 2001 and
$758.6 million as of March 31, 2001.

     Our other current liabilities are as follows:
                                                                                           September 30,     March 31,
                                                                                               2001             2001
                                                                                                  (In millions)
     Salaries and wages ÏÏÏÏÏÏÏÏÏÏÏÏÏÏÏÏÏÏÏÏÏÏÏÏÏÏÏÏÏÏÏÏÏÏÏÏÏÏÏÏÏÏÏÏÏ                        $115.0           $142.2
     Taxes ÏÏÏÏÏÏÏÏÏÏÏÏÏÏÏÏÏÏÏÏÏÏÏÏÏÏÏÏÏÏÏÏÏÏÏÏÏÏÏÏÏÏÏÏÏÏÏÏÏÏÏÏÏÏÏÏ                            51.0             79.8
     Interest and dividends ÏÏÏÏÏÏÏÏÏÏÏÏÏÏÏÏÏÏÏÏÏÏÏÏÏÏÏÏÏÏÏÏÏÏÏÏÏÏÏÏÏÏ                         30.7             31.0
     Other ÏÏÏÏÏÏÏÏÏÏÏÏÏÏÏÏÏÏÏÏÏÏÏÏÏÏÏÏÏÏÏÏÏÏÏÏÏÏÏÏÏÏÏÏÏÏÏÏÏÏÏÏÏÏÏÏ                           377.4            362.2
       Total ÏÏÏÏÏÏÏÏÏÏÏÏÏÏÏÏÏÏÏÏÏÏÏÏÏÏÏÏÏÏÏÏÏÏÏÏÏÏÏÏÏÏÏÏÏÏÏÏÏÏÏÏÏÏ                          $574.1           $615.2

                                                           7
McKESSON CORPORATION
                                   FINANCIAL NOTES Ì (Continued)
                                            (Unaudited)

7.   Convertible Preferred Securities

     In February 1997, a wholly-owned subsidiary trust of McKesson Corporation issued 4 million shares of
preferred securities to the public and 123,720 common securities to McKesson Corporation, which are
convertible at the holder's option into our common stock. The proceeds of such issuances were invested by the
trust in $206,186,000 aggregate principal amount of our 5% Convertible Junior Subordinated Debentures due
in 2027 (the quot;quot;Debentures''). The Debentures represent the sole assets of the trust. The Debentures mature on
June 1, 2027, bear interest at the rate of 5%, payable quarterly, and are redeemable beginning in March 2001
at 103.0% of the principal amount thereof.

     Holders of the securities are entitled to cumulative cash distributions at an annual rate of 5% of the
liquidation amount of $50 per security. Each preferred security is convertible at the rate of 1.3418 shares of
McKesson Corporation common stock, subject to adjustment in certain circumstances. If not converted, the
preferred securities will be redeemed upon repayment of the Debentures, and are callable at 103.0% of the
liquidation amount.

     We have guaranteed, on a subordinated basis, distributions and other payments due on the preferred
securities (the quot;quot;Guarantee''). The Guarantee, when taken together with our obligations under the Deben-
tures, and in the indenture pursuant to which the Debentures were issued, and our obligations under the
Amended and Restated Declaration of Trust governing the subsidiary trust, provides a full and unconditional
guarantee of amounts due on the preferred securities.

     The Debentures and related trust investment in the Debentures have been eliminated in consolidation
and the preferred securities are reÖected as outstanding in the accompanying consolidated Ñnancial
statements.

8.   Gains, Losses and Charges To Net Income

      During the quarter ended September 30, 2001, our Supply Solutions segment recorded asset impairment
charges of $4.8 million for product rationalizations in the medical-surgical business, partially oÅset by
proceeds of $2.8 million from the settlements of claims with third parties in the medical-surgical and medical
management businesses. Also, during the current quarter, our Information Solutions segment recorded
proceeds of $1.0 million from the settlement of a claim related to purchased software for which we had
recorded an impairment charge of $3.2 million in the quarter ended June 30, 2001. In the six months ended
September 30, 2001, we sold two Information Solutions businesses for a pre-tax loss of $18.4 million, or an
after-tax gain of $18.4 million. In the Corporate segment, we recorded a loss on equity investments of
$3.4 million in the quarter and $5.7 million in the six months and costs associated with the pending securities
litigation of $0.9 million in the quarter and $1.5 million in the six months ended September 30, 2001. These
charges were partially oÅset in the quarter by the receipt of $0.9 million in settlement proceeds from an
investment that was written oÅ in prior years.

     During the quarter and six months ended September 30, 2000, our Supply Solutions segment recorded a
$7.8 million gain on the liquidation of an investment. This was partially oÅset by a charge of $2.1 million for
the write-oÅ of purchased in-process technology related to the July 2000 acquisition of an Information
Solutions business. We also incurred $0.7 million in legal fees related to the Accounting Litigation (see
Financial Note 12) in the Corporate segment.


                                                      8
McKESSON CORPORATION
                                    FINANCIAL NOTES Ì (Continued)
                                             (Unaudited)

9.   Restructuring and Related Asset Impairments
    We recorded the following charges and adjustments for restructuring and related asset impairments in the
quarter and six months ended September 30, 2001 and 2000:
                                                                                 Three Months        Six Months
                                                                                    Ended               Ended
                                                                                 September 30,      September 30,
                                                                                 2001     2000      2001     2000
                                                                                          (In millions)
     Asset impairments ÏÏÏÏÏÏÏÏÏÏÏÏÏÏÏÏÏÏÏÏÏÏÏÏÏÏÏÏÏÏÏÏÏÏÏÏÏÏÏÏ                 $ 0.5      $Ì       $ 3.4        $Ì
     Severance ÏÏÏÏÏÏÏÏÏÏÏÏÏÏÏÏÏÏÏÏÏÏÏÏÏÏÏÏÏÏÏÏÏÏÏÏÏÏÏÏÏÏÏÏÏÏÏ                    6.7       2.6       5.2         2.6
     Exit-related ÏÏÏÏÏÏÏÏÏÏÏÏÏÏÏÏÏÏÏÏÏÏÏÏÏÏÏÏÏÏÏÏÏÏÏÏÏÏÏÏÏÏÏÏÏÏ                 14.0       0.2      11.7         0.2
                                                                                $21.2      $2.8     $20.3      $2.8

    A reconciliation of the reserves for the restructuring plans from March 31, 2001 to September 30, 2001,
by operating segment follows:
                                                                     Information
                                           Supply Solutions           Solutions                 Corporate
                                                       Exit-                   Exit-                    Exit-
                                         Severance    Related   Severance     Related     Severance    Related      Total
                                                                          (In millions)
Balance, March 31, 2001 ÏÏÏÏÏÏÏÏÏ          $10.0      $ 7.5      $ 3.5        $ 9.0        $24.7       $ 0.3        $55.0
Charges incurred during the period          10.0       14.0        Ì            Ì            Ì           Ì           24.0
Severance amounts paid during the
  period ÏÏÏÏÏÏÏÏÏÏÏÏÏÏÏÏÏÏÏÏÏÏÏ            (3.3)        Ì         (1.0)          Ì         (4.6)         Ì             (8.9)
Adjustments ÏÏÏÏÏÏÏÏÏÏÏÏÏÏÏÏÏÏÏÏ            (2.0)      (2.3)         Ì            Ì         (2.8)         Ì             (7.1)
Other costs paid during the period           Ì         (1.9)        Ì           (0.9)        Ì          (0.2)           (3.0)
Balance, September 30, 2001 ÏÏÏÏÏÏ         $14.7      $17.3      $ 2.5        $ 8.1        $17.3       $ 0.1        $60.0

     The remaining balances at September 30, 2001 relate primarily to charges recorded in Ñscal 2002 and
Ñscal 2001. The reserves for other exit-related items consist of costs for preparing facilities for disposal, lease
costs and property taxes required subsequent to termination of operations.
      During the quarter ended September 30, 2001, we reviewed the operations and cost structure of, and
developed and communicated a plan to close 23 distribution centers in, the medical-surgical business. In
connection with this plan, we recorded asset impairment charges of $0.3 million, severance charges of
$10.0 million relating to the termination of approximately 650 employees primarily in distribution center,
delivery and associated back-oÇce functions and exit-related charges of $14.0 million for costs to prepare
facilities for disposal, lease costs and property taxes required subsequent to termination of operations. We paid
$0.4 million in severance to 12 of these employees and $0.5 million in exit-related costs during the quarter.
     In conjunction with restructuring plans provided for in prior Ñscal years, during the six months ended
September 30, 2001, our Supply Solutions segment paid severance of $1.3 million to approximately
100 employees in the medical-surgical business, $0.7 million to 23 call center employees, and $0.4 million to
72 customer service and administrative employees in the medical management business, $0.4 million to
approximately 38 customer service and administrative employees in the pharmaceutical services business and
$0.1 million to terminated employees in the pharmacy management business. During the six months ended
September 30, 2001, we paid $0.5 million of exit costs in connection with the distribution center closures in
the medical-surgical business, $0.3 million of exit costs in connection with the call center and foreign oÇce

                                                         9
McKESSON CORPORATION
                                    FINANCIAL NOTES Ì (Continued)
                                             (Unaudited)

closures in the medical management business and $0.6 million of exit costs in connection with closure of an
oÇce in the pharmaceutical services business. In connection with a reassessment of prior year restructuring
plans, we reversed previously recorded severance reserves of $0.5 million in the quarter and $1.7 million in the
six months in the pharmaceutical distribution business and $0.3 million in the six months ended Septem-
ber 30, 2001 medical-surgical business. We also reversed $2.7 million in the medical-surgical business and
recorded $0.4 million in the pharmaceutical distribution business in exit-related reserves in the six months
ended September 30, 2001. Also, in connection with a reassessment of prior year restructuring plans of the
pharmaceutical and medical-surgical businesses, we recorded asset impairment charges of $0.2 million in the
quarter and $3.1 million in the six months. We plan to continue the previously announced back-oÇce
reductions in the pharmaceutical distribution business and workforce reductions in the medical-surgical
distribution business throughout Ñscal 2002.
     In the Information Solutions segment, $1.0 million of severance was paid in the six-month period ended
September 30, 2001, to approximately 100 employees who were terminated in Ñscal 2000 and 2001 under
extended payment arrangements. In addition, $0.9 million of exit costs were paid during the six months ended
September 30, 2001 in this segment.
     In the Corporate segment, $2.8 million of previously recorded severance reserves for executives of the
former iMcKesson business segment were reversed in the quarter ended September 30, 2001. Also, severance
of $4.6 million was paid to 8 employees and exit-related costs of $0.2 million were paid during the six months
ended September 30, 2001 in connection with restructuring plans provided for in Ñscal 2001.
     In the quarter ended September 30, 2000, our Supply Solutions segment recorded a severance charge of
$0.5 million related to a workforce reduction in the pharmacy management business and charges of
$2.1 million for severance and $0.2 million for facility closing costs related to a planned call center closure and
workforce reduction in the medical management business.

10.   Comprehensive Income
     Comprehensive income is deÑned as all changes in stockholders' equity from non-owner sources. It
includes net income and amounts arising from unrecognized pension costs, unrealized gains or losses on
marketable securities and investments classiÑed as available for sale which are recorded directly to
stockholders' equity, net gains or losses on eÅectively hedged derivative instruments and foreign currency
translation adjustments. Total comprehensive income for the three and six months ended September 30, 2001
and 2000 is as follows:
                                                                                Three Months
                                                                                    Ended           Six Months Ended
                                                                                September 30,         September 30,
                                                                               2001      2000        2001       2000
                                                                                           (In millions)
Net income ÏÏÏÏÏÏÏÏÏÏÏÏÏÏÏÏÏÏÏÏÏÏÏÏÏÏÏÏÏÏÏÏÏÏÏÏÏÏÏÏÏÏÏÏÏÏÏÏÏÏ                 $79.0     $61.9     $184.4     $125.5
Unrealized gain (loss) on marketable securities and investments ÏÏÏÏÏ          (2.6)      4.4       (5.2)      (9.1)
Net gain (loss) on derivative instrumentsÏÏÏÏÏÏÏÏÏÏÏÏÏÏÏÏÏÏÏÏÏÏÏÏÏ             (0.9)       Ì         1.3         Ì
Foreign currency translation adjustments ÏÏÏÏÏÏÏÏÏÏÏÏÏÏÏÏÏÏÏÏÏÏÏÏÏ             (5.9)     (2.9)      (3.9)      (8.2)
                                                                              $69.6     $63.4     $176.6     $108.2


                                                        10
McKESSON CORPORATION
                                    FINANCIAL NOTES Ì (Continued)
                                             (Unaudited)

11.   Earnings Per Share
   The following is a reconciliation of the numerators and denominators of the basic and diluted earnings per
common share computations for net income:
                                                                           Three Months Ended
                                                          September 30, 2001                  September 30, 2000
                                                     Income    Shares    Per Share     Income      Shares    Per Share
                                                                 (In millions, except per share amounts)
Basic EPS
  Net IncomeÏÏÏÏÏÏÏÏÏÏÏÏÏÏÏÏÏÏÏÏÏÏÏÏÏÏÏÏÏ             $79.0    285.0       $0.28       $61.9      283.0       $0.22
EÅect of Dilutive Securities
  Options to purchase common stock ÏÏÏÏÏÏÏÏÏ            Ì         8.2                     Ì          3.3
  Trust convertible preferred securities ÏÏÏÏÏÏÏÏ       1.6       5.4                     1.6        5.4
  Restricted stock ÏÏÏÏÏÏÏÏÏÏÏÏÏÏÏÏÏÏÏÏÏÏÏÏÏ             Ì        0.4                      Ì         0.3
Diluted EPS
  Net income available to common stockholders
    plus assumed conversions ÏÏÏÏÏÏÏÏÏÏÏÏÏÏÏ          $80.6    299.0       $0.27       $63.5      292.0       $0.22
                                                                           Six Months Ended
                                                         September 30, 2001                  September 30, 2000
                                                    Income    Shares    Per Share      Income     Shares    Per Share
                                                                (In millions, except per share amounts)
Basic EPS
  Net IncomeÏÏÏÏÏÏÏÏÏÏÏÏÏÏÏÏÏÏÏÏÏÏÏÏÏÏÏÏ            $184.4     284.5      $0.65       $125.5      282.8       $0.44
EÅect of Dilutive Securities
  Options to purchase common stock ÏÏÏÏÏÏÏÏ             Ì        7.3                      Ì          2.3
  Trust convertible preferred securities ÏÏÏÏÏÏÏ        3.1      5.4                      3.1        5.4
  Restricted stock ÏÏÏÏÏÏÏÏÏÏÏÏÏÏÏÏÏÏÏÏÏÏÏÏ              Ì       0.3                       Ì         0.2
Diluted EPS
  Net income available to common
    stockholders plus assumed conversions ÏÏÏ       $187.5     297.5      $0.63       $128.6      290.7       $0.44

12.   Litigation
  Accounting Litigation
    In our annual report on Form 10-K for the Ñscal year ended March 31, 2001, and our quarterly report on
Form 10-Q for the quarter ending June 30, 2001, we reported on numerous legal proceedings arising out of our
announcement on April 28, 1999 regarding accounting improprieties at our subsidiary, HBO & Company
(quot;quot;HBOC'').
     On July 25, 2001, the Georgia state court stayed all claims relating to the accounting litigation in the
previously reported action, Powell v. McKesson HBOC, Inc. et al. (Case No. 1999CV-15443), pending
completion of trial in the consolidated federal class actions pending in the United States District Court for the
Northern District of California entitled In Re McKesson HBOC, Inc. Securities Litigation (Case
No. C-99-20743-RMW) (the quot;quot;Consolidated Action''), and the only claims proceeding in Powell are
plaintiÅ's claims for unpaid sales commissions. On August 22, 2001, the Georgia state court also stayed the

                                                       11
McKESSON CORPORATION
                                   FINANCIAL NOTES Ì (Continued)
                                            (Unaudited)

previously reported action Curran Partners, L.P. v. McKesson HBOC, Inc., et al., (Case No. 00 VS-010801) in
favor of the Consolidated Action.

     On July 27, 2001, an action was Ñled in the United States District Court for the Northern District of
California captioned Pacha et al., v. McKesson HBOC, Inc. et al., (No. C01-20713 PVT) (quot;quot;Pacha''). The
Pacha plaintiÅs allege that they were individual shareholders of our stock on November 27, 1998, and assert
that we violated Section 14(a) of the Exchange Act and SEC Rule 14a-9, and that we, aided by HBOC,
breached our Ñduciary duties to plaintiÅs by issuing a joint proxy statement in connection with the McKesson-
HBOC merger which allegedly contained false and misleading statements or omissions. PlaintiÅs name as
defendants us, HBOC, certain current or former oÇcers or directors of our company or HBOC, Arthur
Andersen and Bear Stearns. The complaint seeks unspeciÑed compensatory and punitive damages, attorneys
fees and costs. The action has been assigned to the Honorable Ronald M. Whyte, the judge overseeing the
Consolidated Action. On September 25, 2001, the Pacha plaintiÅs Ñled an application with the Court
requesting that their action not be consolidated with the Consolidated Action. We Ñled an opposition to that
application on October 3, 2001, and the matter has not yet been decided.

      On July 31, 2001, our demurrer to the Second Amended Complaint was overruled and our alternative
motion to strike denied in the previously reported California state court action, Yurick v. McKesson HBOC,
Inc., et al.,(Case No. 303857).

     On October 12, 2001, we Ñled a motion to dismiss the First Amended Complaint in the previously
reported action, Chang v. McKesson HBOC, Inc., et al., (N.D. Cal No. C00-20030-RMW), and that motion is
presently set for hearing on February 15, 2002.

     Our demurrers, alternative motions to strike and motions to stay or modify an existing stay, in the
previously reported California Superior Court actions, The State of Oregon by and Through the Oregon Public
Employees Retirement Board v. McKesson HBOC, Inc., et al., (Case No. 307619), Minnesota State Board of
Investment v. McKesson HBOC, Inc., et al., (Case No. 311747) and Utah State Retirement
Board v. McKesson HBOC, Inc., et al., (Case No. 311269), are all currently set for hearing on November 15,
2001.

     The previously reported American Healthcare Fund II L.P., et al., v. McKesson HBOC, Inc., et al., (Case
No. 00-CV-1762) pending in Colorado state court and involving contract and interference with contract
claims brought against us and HBOC by certain former shareholders of Access Health Inc., a company
acquired by HBOC in December of 1998, has been settled and was dismissed with prejudice on October 24,
2001, and that resolution had no material impact on the Company.

     The previously reported investigations by the United States Attorney's OÇce and the Securities and
Exchange Commission are continuing. On September 27, 2001, the Securities and Exchange Commission
Ñled securities fraud charges against six former HBOC oÇcers and employees. Simultaneous with the Ñling of
the Commission's civil complaints, four of the six defendants settled the claims brought against them by,
among other things, consenting, without admitting or denying the allegations of the complaints, to entry of
permanent injunctions against all of the alleged violations, and agreeing to pay civil penalties in various
amounts.

     We do not believe it is feasible to predict or determine the outcome or resolution of, or to estimate the
amounts of, or potential range of, loss with respect to the above mentioned proceedings. In addition, the timing
of the Ñnal resolution of these proceedings is uncertain. The range of possible resolutions could include
judgments against us or settlements that could require substantial payments by us, which could have a
material adverse impact on our Ñnancial position, results of operations and cash Öows.

                                                      12
McKESSON CORPORATION
                                   FINANCIAL NOTES Ì (Concluded)
                                            (Unaudited)

  Other Litigation

     On August 29, 2001, we Ñled motions for summary judgment in the previously reported matter FoxMeyer
Health Corporation v. McKesson, et al., (Case No. 97 00311), pending in Texas state court. The FoxMeyer
court has heard one of those motions and will hear the remaining motions on November 2, 2001. Trial is
presently set in FoxMeyer for January 14, 2002.

13.   Segment Information

     Our operating segments include Supply Solutions and Information Solutions. In evaluating Ñnancial
performance, we focus on operating proÑt as a segment's measure of proÑt or loss. Operating proÑt is income
before interest expense, taxes on income and allocation of certain corporate revenues and expenses. Corporate
interest income has been reclassiÑed from Interest-net to the Corporate segment for all periods presented.
Financial information relating to our reportable segments for the three and six months ended September 30,
2001 and 2000, and as of September 30, 2001 and March 31, 2001, is presented below:
                                                                   Three Months Ended           Six Months Ended
                                                                      September 30,               September 30,
                                                                    2001         2000          2001          2000
                                                                                    (In millions)
Revenues
    Supply Solutions ÏÏÏÏÏÏÏÏÏÏÏÏÏÏÏÏÏÏÏÏÏÏÏÏÏÏÏÏÏÏ            $11,922.8      $9,644.6       $23,332.9     $19,136.5
    Information Solutions ÏÏÏÏÏÏÏÏÏÏÏÏÏÏÏÏÏÏÏÏÏÏÏÏÏÏ               235.9         220.2           479.1         445.2
    Corporate ÏÏÏÏÏÏÏÏÏÏÏÏÏÏÏÏÏÏÏÏÏÏÏÏÏÏÏÏÏÏÏÏÏÏÏÏ                   0.6           0.7             1.2           1.4
          Total ÏÏÏÏÏÏÏÏÏÏÏÏÏÏÏÏÏÏÏÏÏÏÏÏÏÏÏÏÏÏÏÏÏÏÏÏ           $12,159.3      $9,865.5       $23,813.2     $19,583.1
Operating proÑt (loss)
    Supply Solutions ÏÏÏÏÏÏÏÏÏÏÏÏÏÏÏÏÏÏÏÏÏÏÏÏÏÏÏÏÏÏ            $     176.0    $ 159.2        $   372.8     $    309.6
    Information Solutions ÏÏÏÏÏÏÏÏÏÏÏÏÏÏÏÏÏÏÏÏÏÏÏÏÏÏ                  14.5       (0.6)             3.5            2.6
           Total ÏÏÏÏÏÏÏÏÏÏÏÏÏÏÏÏÏÏÏÏÏÏÏÏÏÏÏÏÏÏÏÏÏÏÏÏ                190.5        158.6          376.3          312.2
      Interest ExpenseÏÏÏÏÏÏÏÏÏÏÏÏÏÏÏÏÏÏÏÏÏÏÏÏÏÏÏÏÏÏÏ                (27.0)       (28.7)         (54.0)         (56.1)
      Corporate ÏÏÏÏÏÏÏÏÏÏÏÏÏÏÏÏÏÏÏÏÏÏÏÏÏÏÏÏÏÏÏÏÏÏÏÏ                 (36.6)       (24.5)         (74.3)         (43.9)
          Income before income taxes and dividends on
            preferred securities of subsidiary trust ÏÏÏÏÏÏÏ   $     126.9    $ 105.4        $   248.0     $    212.2
                                                                                           September 30,     March 31,
                                                                                               2001             2001
                                                                                                  (In millions)
Segment assets
    Supply SolutionsÏÏÏÏÏÏÏÏÏÏÏÏÏÏÏÏÏÏÏÏÏÏÏÏÏÏÏÏÏÏÏÏÏÏÏÏÏÏÏÏÏÏÏÏÏÏÏÏÏÏ                      $10,977.0      $10,067.4
    Information SolutionsÏÏÏÏÏÏÏÏÏÏÏÏÏÏÏÏÏÏÏÏÏÏÏÏÏÏÏÏÏÏÏÏÏÏÏÏÏÏÏÏÏÏÏÏÏÏ                         519.1          558.9
    CorporateÏÏÏÏÏÏÏÏÏÏÏÏÏÏÏÏÏÏÏÏÏÏÏÏÏÏÏÏÏÏÏÏÏÏÏÏÏÏÏÏÏÏÏÏÏÏÏÏÏÏÏÏÏÏÏÏ                           702.0          903.6
          TotalÏÏÏÏÏÏÏÏÏÏÏÏÏÏÏÏÏÏÏÏÏÏÏÏÏÏÏÏÏÏÏÏÏÏÏÏÏÏÏÏÏÏÏÏÏÏÏÏÏÏÏÏÏÏÏÏ                     $12,198.1      $11,529.9


                                                      13
McKESSON CORPORATION
                                         FINANCIAL REVIEW
                                             (Unaudited)

Segment Results

    The revenues and operating proÑts by business segment are as follows:
                                              Three Months Ended                           Six Months Ended
                                                 September 30,                               September 30,
                                         2001           2000         Chg.           2001            2000        Chg.
                                                                   (Dollars in millions)
REVENUES
Supply Solutions
  Pharmaceutical Distribution &
    Services
    U.S. Health Care(1) ÏÏÏÏÏÏÏÏÏ $10,456.6           $8,301.7         26%     $20,421.5         $16,426.7      24%
    International ÏÏÏÏÏÏÏÏÏÏÏÏÏÏÏÏ    714.5              648.2         10        1,427.0           1,275.8      12
     Total Pharmaceutical
        Distribution & Services ÏÏÏ    11,171.1        8,949.9         25        21,848.5         17,702.5      23
  Medical-Surgical Distribution &
   Services ÏÏÏÏÏÏÏÏÏÏÏÏÏÏÏÏÏÏÏÏ          751.7            694.7        8           1,484.4           1,434.0    4
       Total Supply SolutionsÏÏÏÏÏÏ    11,922.8        9,644.6         24          23,332.9          19,136.5   22
Information Solutions
  SoftwareÏÏÏÏÏÏÏÏÏÏÏÏÏÏÏÏÏÏÏÏÏÏ           42.2             28.1      50              87.6              59.8    46
  Services ÏÏÏÏÏÏÏÏÏÏÏÏÏÏÏÏÏÏÏÏÏÏ         178.6            174.4       2             358.6             350.6     2
  HardwareÏÏÏÏÏÏÏÏÏÏÏÏÏÏÏÏÏÏÏÏÏ            15.1             17.7     (15)             32.9              34.8    (5)
       Total Information Solutions        235.9            220.2        7            479.1             445.2     8
CorporateÏÏÏÏÏÏÏÏÏÏÏÏÏÏÏÏÏÏÏÏÏÏÏ            0.6              0.7                        1.2               1.4
TotalÏÏÏÏÏÏÏÏÏÏÏÏÏÏÏÏÏÏÏÏÏÏÏÏÏÏÏ $12,159.3            $9,865.5         23      $23,813.2         $19,583.1      22
OPERATING PROFIT (LOSS)
Supply SolutionsÏÏÏÏÏÏÏÏÏÏÏÏÏÏÏÏÏ $       176.0 (3) $ 159.2 (6) 11             $     372.8 (3) $       309.6 (6) 20
Information Solutions ÏÏÏÏÏÏÏÏÏÏÏÏ         14.5 (4)    (0.6)(7)                        3.5 (4)           2.6 (7) 35
TotalÏÏÏÏÏÏÏÏÏÏÏÏÏÏÏÏÏÏÏÏÏÏÏÏÏÏÏ          190.5            158.6     20              376.3             312.2     21
Interest Expense(2) ÏÏÏÏÏÏÏÏÏÏÏÏÏÏ        (27.0)           (28.7)    (6)             (54.0)            (56.1)    (4)
Corporate(2)ÏÏÏÏÏÏÏÏÏÏÏÏÏÏÏÏÏÏÏÏ          (36.6)(5)        (24.5)(8) 49              (74.3)(5)         (43.9)(8) 69
Income before income taxes and
  dividends on preferred securities
  of subsidiary trust ÏÏÏÏÏÏÏÏÏÏÏÏÏÏ $    126.9       $ 105.4          20      $     248.0       $     212.2    17


(1) Includes warehouse sales of $3,241.5 million and $2,375.3 million in the three months ended Septem-
    ber 30, 2001 and 2000, and $6,348.0 million and $4,700.6 million in the six months ended September 30,
    2001 and 2000.
(2) Corporate interest income has been reclassiÑed from Interest Ì net to the Corporate segment for all
    periods presented.
(3) Includes pre-tax charges of $5.1 million for asset impairments and $24.0 million for severance and exit-
    related activities related to product rationalizations and distribution center closures in the medical-

                                                      14
McKESSON CORPORATION
                                        FINANCIAL REVIEW Ì (Continued)
                                                 (Unaudited)

     surgical business, partially oÅset by proceeds of $2.8 million in settlements from third parties in the
     medical-surgical and medical management businesses. Also includes charges for asset impairments of
     $0.2 million in the quarter and $3.1 million in the six months, and net reductions in severance and exit-
     related reserves of $0.5 million in the quarter and $4.3 million in the six months associated with prior year
     restructuring plans of the pharmaceutical and medical-surgical businesses.
(4) Includes settlement proceeds of $1.0 million related to purchased software. A charge of $3.2 million was
    recorded to write oÅ this asset in the quarter ended June 30, 2001. The six months ended September 30,
    2001 also include pre-tax losses of $18.4 million on the sales of two businesses.
(5) Includes a pre-tax loss on equity investments of $3.4 million and $5.7 million and costs associated with
    the Accounting Litigation of $0.9 million and $1.5 million in the quarter and six months ended
    September 30, 2001. The six months also includes a $2.8 million reduction in prior year severance
    reserves and the receipt of $0.9 million in settlement proceeds from an investment that was previously
    written oÅ.
(6) Includes a $7.8 million pre-tax gain on the liquidation of an investment partially oÅset by charges of
    $0.5 million for severance in the pharmacy management business and $2.3 million for severance and exit-
    related activities in the medication management business.
(7) Includes a $2.1 million charge for the write-oÅ of purchased in-process technology related to an
    acquisition.
(8) Includes costs associated with the Accounting Litigation of $0.7 million.

Factors AÅecting Forward-Looking Statements
     In addition to historical information, our Ñnancial review includes certain forward-looking statements
within the meaning of Section 27A of the Securities Act of 1933, as amended (the quot;quot;Securities Act'') and
section 21E of the Securities Exchange Act of 1934, as amended (the quot;quot;Exchange Act''). Some of the
forward-looking statements can be identiÑed by the use of forward-looking words such as quot;quot;believes'',
quot;quot;expects'', quot;quot;anticipates'', quot;quot;may'', quot;quot;will'', quot;quot;should'', quot;quot;seeks'', quot;quot;approximately'', quot;quot;intends'', quot;quot;plans'', quot;quot;estimates'',
or the negative of these words or other comparable terminology. The discussion of Ñnancial trends, strategy,
plans or intentions may also include forward-looking statements. Forward-looking statements involve risks and
uncertainties that could cause actual results to diÅer materially from those projected.
     These and other risks and uncertainties are described herein or in our Forms 10-K, 10-Q, 8-K and other
public documents Ñled with the SEC. Readers are cautioned not to place undue reliance on these forward-
looking statements, which speak only as of the date hereof. We undertake no obligation to publicly release the
result of any revisions to these forward-looking statements to reÖect events or circumstances after this date or
to reÖect the occurrence of unanticipated events.

Overview of Results
     Net income for the quarter ended September 30, 2001 increased to $79.0 million, $0.27 per diluted share,
from $61.9 million, $0.22 per diluted share, in the prior year. For the six-month period, net income increased
to $184.4 million, $0.63 per diluted share, from $125.5 million, $0.44 per diluted share. We elected to adopt
SFAS No. 142, and accordingly discontinued the amortization of goodwill eÅective April 1, 2001. On a
comparable basis, excluding goodwill amortization of $12.4 million and a tax beneÑt on goodwill amortization
of $0.8 million, net income as adjusted would have been $73.5 million and earnings per diluted share would
have been $0.26 in the prior year second quarter. Excluding goodwill amortization of $23.5 million and a tax
beneÑt on goodwill amortization of $1.5 million, net income as adjusted would have been $147.5 million and
earnings per diluted share would have been $0.52 in the six months ended September 30, 2000.

                                                               15
McKESSON CORPORATION
                                  FINANCIAL REVIEW Ì (Continued)
                                           (Unaudited)

    The results include the following:
                                                                             Three Months Ended September 30,
                                                                                2001                     2000
                                                                        Pre-tax    After-tax     Pre-tax    After-tax
                                                                                       (In millions)
Net Income
 Before unusual items and dividends on convertible preferred
    securities of subsidiary trustÏÏÏÏÏÏÏÏÏÏÏÏÏÏÏÏÏÏÏÏÏÏÏÏÏÏÏÏÏ         $152.5      $ 96.9      $103.2       $63.0
 Dividends on convertible preferred securities of subsidiary trust         Ì          (1.6)        Ì          (1.6)
  Before unusual items ÏÏÏÏÏÏÏÏÏÏÏÏÏÏÏÏÏÏÏÏÏÏÏÏÏÏÏÏÏÏÏÏÏÏÏÏ              152.5        95.3       103.2        61.4
  Unusual items
    Supply Solutions ÏÏÏÏÏÏÏÏÏÏÏÏÏÏÏÏÏÏÏÏÏÏÏÏÏÏÏÏÏÏÏÏÏÏÏÏÏÏ              (26.0)      (16.6)         5.0        3.0
    Information Solutions ÏÏÏÏÏÏÏÏÏÏÏÏÏÏÏÏÏÏÏÏÏÏÏÏÏÏÏÏÏÏÏÏÏÏ               1.0         0.7         (2.1)      (2.1)
    Corporate ÏÏÏÏÏÏÏÏÏÏÏÏÏÏÏÏÏÏÏÏÏÏÏÏÏÏÏÏÏÏÏÏÏÏÏÏÏÏÏÏÏÏÏÏ                (0.6)       (0.4)        (0.7)      (0.4)
  Net income ÏÏÏÏÏÏÏÏÏÏÏÏÏÏÏÏÏÏÏÏÏÏÏÏÏÏÏÏÏÏÏÏÏÏÏÏÏÏÏÏÏÏÏÏ               $126.9      $ 79.0      $105.4       $61.9
                                                                              Six Months Ended September 30,
                                                                                2001                     2000
                                                                        Pre-tax    After-tax     Pre-tax    After-tax
                                                                                        (In millions)
Net Income
 Before unusual items and dividends on convertible preferred
    securities of subsidiary trustÏÏÏÏÏÏÏÏÏÏÏÏÏÏÏÏÏÏÏÏÏÏÏÏÏÏÏÏÏ         $297.2      $188.7      $210.0      $128.1
 Dividends on convertible preferred securities of subsidiary trust         Ì          (3.1)         Ì         (3.1)
  Before unusual items ÏÏÏÏÏÏÏÏÏÏÏÏÏÏÏÏÏÏÏÏÏÏÏÏÏÏÏÏÏÏÏÏÏÏÏÏ              297.2       185.6       210.0        125.0
  Unusual items
    Supply Solutions ÏÏÏÏÏÏÏÏÏÏÏÏÏÏÏÏÏÏÏÏÏÏÏÏÏÏÏÏÏÏÏÏÏÏÏÏÏÏ              (25.1)      (16.0)         5.0         3.0
    Information Solutions ÏÏÏÏÏÏÏÏÏÏÏÏÏÏÏÏÏÏÏÏÏÏÏÏÏÏÏÏÏÏÏÏÏÏ             (20.6)       17.0         (2.1)       (2.1)
    Corporate ÏÏÏÏÏÏÏÏÏÏÏÏÏÏÏÏÏÏÏÏÏÏÏÏÏÏÏÏÏÏÏÏÏÏÏÏÏÏÏÏÏÏÏÏ                (3.5)       (2.2)        (0.7)       (0.4)
  Net income ÏÏÏÏÏÏÏÏÏÏÏÏÏÏÏÏÏÏÏÏÏÏÏÏÏÏÏÏÏÏÏÏÏÏÏÏÏÏÏÏÏÏÏÏ               $248.0      $184.4      $212.2      $125.5

     The results for the quarter and six months ended September 30, 2001 include unusual items that
decreased after-tax income by $16.3 million and $1.2 million. These unusual items included charges of
$3.3 million for asset impairments and $15.2 million for severance and exit-related costs related to product
rationalizations and distribution center closures in the medical-surgical business of the Supply Solutions
segment. These charges were partially oÅset by proceeds of $1.7 million from the settlement of claims with
third parties in the medical-surgical and medical management businesses. The results also include charges of
$0.1 million in the quarter and $2.0 million in the six months for asset impairments, and net reductions of
$0.3 million in the quarter and $2.8 million in the six months in costs associated with prior year restructuring
reserves in the pharmaceutical and medical-surgical businesses. During the quarter ended September 30,
2001, the Information Solutions segment recorded proceeds of $0.7 million from the settlement of a claim
related to purchased software. During the six months ended September 30, 2001, this segment also recorded a
charge of $2.1 million to write oÅ this asset and sold two businesses for an after-tax gain of $18.4 million. In
the Corporate segment, we recorded after-tax losses on equity investments of $2.2 million in the quarter and
$3.6 million in the six months and costs associated with the Accounting Litigation of $0.6 million in the

                                                      16
McKESSON CORPORATION
                                   FINANCIAL REVIEW Ì (Continued)
                                            (Unaudited)

quarter and $1.0 million in the six months. These charges were oÅset in the quarter and six months by a
reduction in prior year severance reserves of $1.8 million for executives of the former iMcKesson business
segment and the receipt of $0.6 million in settlement proceeds representing a partial recovery from an
investment that was written oÅ in prior years.

     The results for the quarter and six months ended September 30, 2000 include unusual items that
increased after-tax income by $0.5 million. These unusual items consisted of a $4.8 million gain on the
liquidation of an investment partially oÅset by severance and exit-related costs of $1.8 million in the Supply
Solutions segment, a $2.1 million write-oÅ of purchased in-process technology related to an acquisition in the
Information Solutions segment and $0.4 million in costs associated with the pending securities litigation.

     Net income before unusual items increased to $95.3 million from $61.4 million in the second quarter and
to $185.6 million from $125.0 million in the six months ended September 30, 2001 and 2000, reÖecting
revenue growth and operating margin expansion in both the Supply Solutions and Information Solutions
segments.

     The eÅective income tax rate before unusual items for the three and six months ended September 30,
2001 declined from the eÅective income tax rate for the comparable prior year periods due to the
discontinuance of goodwill amortization, which is primarily non-tax-deductible, and tax planning initiatives.
Unusual items included a $30.0 million tax beneÑt on the sale of the stock of an Information Solutions
business.

     The discussion of the Ñnancial results that follows focuses on the results excluding unusual items, as we
believe such discussion is the most informative representation of recurring, non-transactional related operating
results.

  Supply Solutions

      The Supply Solutions segment includes the operations of our U.S. pharmaceutical distribution and
services businesses, international pharmaceutical operations (Canada and Mexico), and medical-surgical
distribution and services business. This segment accounted for 98% of consolidated revenues for the three and
six months ended September 30, 2001 and 2000.

     Pharmaceutical Distribution & Services revenues increased by 25% to $11.2 billion in the quarter and
23% to $21.8 billion in the six-month period. This increase reÖects growth in the quarter and Ñrst half in the
U.S. direct delivery business of 22% and 20%, an increase in U.S. sales to customers' warehouses of 36% and
35% and an increase in international revenues of 10% and 12%. The revenue growth in the quarter and Ñrst
half of Ñscal 2002 primarily reÖects improved growth rates from a number of the Company's largest U.S. retail
drug chain customers and the impact of the implementation of certain distribution agreements which took full
eÅect in the second quarter.

      Medical-Surgical Distribution & Services revenues increased 8% to $751.7 million in the quarter and 4%
to $1,484.4 million in the six-month period. The six months ended September 30, 2000 contained Ñve more
selling days than the current year's six-month period as a result of that business' Ñscal calendar. Excluding the
additional selling days in the prior year, six-month period revenues increased by 6%.

     Supply Solutions operating proÑt increased $47.8 million or 31% to $202.0 million in the quarter and
$93.3 million or 31% to $397.9 million in the six months. Operating proÑt as a percent of revenues (calculated
excluding warehouse sales) increased 21 basis points to 2.33% in the second quarter and 23 basis points to
2.34% for the six months compared to prior year margins. Excluding goodwill amortization in the quarter and
six months ended September 30, 2000, operating proÑt increased 25% and the operating margin increased

                                                       17
McKESSON CORPORATION
                                   FINANCIAL REVIEW Ì (Continued)
                                            (Unaudited)

12 basis points and 14 basis points in the respective periods. The increase in the operating margin reÖects
productivity improvements in both back-oÇce and Ñeld operations and expanded product sourcing activities.

  Information Solutions
     The Information Solutions segment includes revenues from software sales, services and hardware sales.
This segment accounted for 2% of consolidated revenues for the three and six months ended September 30,
2001 and 2000. Information Solutions revenues increased 7% to $235.9 million compared to $220.2 million in
the prior year second quarter and 8% to $479.1 million from $445.2 million in the prior year six-month period.
Software revenues increased 50% to $42.2 million from $28.1 million in the prior year second quarter and
increased 46% to $87.6 million from $59.8 million in the prior year six-month period, reÖecting the recognition
of previously deferred revenue as a result of our adoption of a new contracting methodology in the prior year
that led to an increase in the deferral of software revenues as a result of the use of the percentage of
completion accounting method on such revenues. Services revenues of $178.6 million in the quarter and
$358.6 million in the six months increased 2% from the prior year's second quarter of $174.4 million and six
months of $350.6 million. Hardware revenues decreased 15% in the quarter to $15.1 million from $17.7 mil-
lion in the prior year second quarter and 5% in the Ñrst half to $32.9 million from $34.8 million in the prior
year Ñrst half.
     Operating proÑt increased to $13.5 million in the quarter ended September 30, 2001 from $1.5 million in
the prior year quarter and to $24.1 million in the current year six-month period from $4.7 million in the prior
year six-month period. The operating proÑt margin increased to 5.72% in the quarter ended September 30,
2001 compared to 0.68% for the prior year second quarter and increased to 5.03% in the Ñrst half compared to
1.06% in the prior year comparable period. Excluding goodwill amortization in the prior year periods,
operating proÑt increased 90% and the operating margin increased 250 basis points in the quarter and
operating proÑt increased 63% and the operating margin increased 171 basis points in the six months
compared to the respective prior year periods. The increase is primarily the result of the increase in higher
margin software revenue and operating expense management.

  Interest Expense
     Interest expense decreased to $27.0 million from $28.7 million in the prior year second quarter and to
$54.0 million from $56.1 million in the prior year Ñrst half. The decrease is due to lower interest rates partially
oÅset by an increase in average borrowings to support revenue growth in the current year.

  Corporate
     Corporate expenses increased to $36.0 million from $23.8 million in the prior year second quarter and to
$70.8 million from $43.2 million in the prior year Ñrst half. The increase in Corporate expenses reÖects
expenses for the sale of receivables associated with an increase in working capital, higher beneÑt costs and our
share in the losses of HealthNexis, an Internet-based company we formed with other health care companies in
Ñscal 2001. The Corporate segment also includes the reclassiÑcation of Corporate interest income of
$0.7 million and $1.7 million from Interest-net in the current and prior year second quarter and $1.3 million
and 4.3 million in the current and prior year six-month periods.

Liquidity and Capital Resources
     Cash and equivalents decreased by $147.3 million to $286.4 million at September 30, 2001 from
$433.7 million at March 31, 2001. During the six months ended September 30, 2001, operating activities
provided $3.6 million of cash. The improvement in cash Öows from operating activities during the quarter

                                                        18
McKESSON CORPORATION
                                  FINANCIAL REVIEW Ì (Concluded)
                                            (Unaudited)

ended September 30, 2001, reÖects a decline in net Ñnancial inventory (inventory less payables) from June 30,
2001 to September 30, 2001.
     Cash and marketable securities available for sale were $293.1 million at September 30, 2001 compared to
$445.6 million at March 31, 2001. The September 30, 2001 marketable securities balance includes
$4.0 million that is currently restricted and held in trust as exchange property in connection with our
outstanding exchangeable debentures.
      Inventories increased $538 million to $5.7 billion at September 30, 2001 from $5.1 billion at March 31,
2001. The increase in inventories reÖects the build up associated with the implementation of new pharmaceu-
tical distribution agreements.
     Stockholders' equity was $3.7 billion at September 30, 2001, and the net debt-to-capital ratio was 19%,
up slightly from 18% at March 31, 2001. The net debt-to-capital ratio for both periods was computed by
reducing the outstanding debt amount by the cash and marketable securities balances. We had no sales of
trade accounts receivable and no short-term borrowings outstanding at September 30, 2001.
     Return on average committed capital improved to 19.4% as of September 30, 2001 from 17.9% as of
September 30, 2000. This improvement reÖects a growth in the our operating proÑt in excess of the growth in
the working capital required to fund the increase in revenues resulting from new pharmaceutical distribution
agreements.
     Common shares outstanding increased to 286.0 million at September 30, 2001 from 284.0 million at
March 31, 2001 due primarily to shares issued under employee beneÑt plans, partially oÅset by the 0.4 million
shares repurchased as part of our previously announced $250 million share repurchase program. Average
diluted shares increased to 299.0 million in the second quarter of Ñscal 2002 from 292.0 million in the
comparable prior year period due to an increased eÅect of dilutive securities as a result of an increase in our
stock price and an increase in common shares outstanding.
     In October 2001, we renewed a 364-day revolving credit agreement that allows for borrowings of up to
$1.075 billion under terms substantially similar to those previously in place. This credit facility is primarily
intended to support our commercial paper borrowings.

Additional Factors That May AÅect Future Results
   Reference is made to the additional factors that may aÅect the future results described in our most recent
Annual Report on Form 10-K for the Ñscal year ended March 31, 2001.


                                                      19
Item 3. Quantitative and Qualitative Disclosures about Market Risk

     We believe there has been no material change in our exposure to risks associated with Öuctuations in
interest and foreign currency exchange rates discussed in our 2001 Annual Report on Form 10-K.


                                   PART II.    OTHER INFORMATION

Item 1. Legal Proceedings

     See Financial Note 12 to our unaudited condensed consolidated Ñnancial statements contained in Part I
of this Quarterly Report on Form 10-Q.

Item 4. Submission of Matters to a Vote of Security Holders

     Our Annual Meeting of Stockholders was held on July 25, 2001. The following matters were voted upon
at the meeting and the stockholder votes on each such matter are brieÖy described below:

     The Board of Directors' nominees for directors as listed in the proxy statement were each elected to serve
for a three-year term. The vote was as follows:
                                                                               Votes For    Votes Withheld

    John H. Hammergren ÏÏÏÏÏÏÏÏÏÏÏÏÏÏÏÏÏÏÏÏÏÏÏÏÏÏÏÏÏÏÏÏÏÏÏÏÏÏ                252,646,769      6,348,781
    M. Christine Jacobs ÏÏÏÏÏÏÏÏÏÏÏÏÏÏÏÏÏÏÏÏÏÏÏÏÏÏÏÏÏÏÏÏÏÏÏÏÏÏÏÏ             251,908,591      7,086,959
    Martin M. KoÅel ÏÏÏÏÏÏÏÏÏÏÏÏÏÏÏÏÏÏÏÏÏÏÏÏÏÏÏÏÏÏÏÏÏÏÏÏÏÏÏÏÏÏ               252,395,187      6,600,363

     The proposal to amend the 1997 Non-Employee Directors' Equity Compensation and Deferral Plan
received the following vote:
                                                               Votes For    Votes Against   Votes Abstained

                                                             192,692,929     63,888,328        2,414,293

    The proposal to approve the Amendment to the Company's Restated CertiÑcate of Incorporation to
change our name to McKesson Corporation received the following vote:
                                                               Votes For    Votes Against   Votes Abstained

                                                             255,666,985       2,253,621       1,074,944

     The proposal to ratify the appointment of Deloitte & Touche LLP as our independent auditors for the
Ñscal year ending March 31, 2002 received the following vote:
                                                               Votes For    Votes Against   Votes Abstained

                                                             254,293,104       3,164,131       1,538,315

    The stockholder proposal regarding performance-based options received the following vote:
                                                               Votes For    Votes Against   Votes Abstained

                                                             55,711,172     139,667,310      13,224,895

    The stockholder proposal regarding severance payments received the following vote:
                                                               Votes For    Votes Against   Votes Abstained

                                                             35,918,555     157,087,896      15,596,526

    The stockholder proposal regarding the sale of the Company received the following vote:
                                                               Votes For    Votes Against   Votes Abstained

                                                              6,583,730     198,713,051        3,306,596

                                                      20
Item 6. Exhibits and Reports on Form 8-K
    (a) Exhibits
    Exhibits identiÑed below are incorporated herein by reference as exhibits to this report.
    Exhibit
    Number                                          Description

      3.2 CertiÑcate of Amendment to the Restated CertiÑcate of Incorporation of Registrant as Ñled
          with the oÇce of the Delaware Secretary of State on July 30, 2001.
      3.3 Amended and Restated By-Laws of the Company dated as of July 25, 2001.
     10.1 Fourth Amendment to June 25, 1999 Receivables Purchase Agreement, dated as of June 15,
          2001.
    (b) Reports on Form 8-K
    There were no reports on Form 8-K Ñled during the three months ended September 30, 2001.


                                                    21
SIGNATURES
     Pursuant to the requirements of the Securities Exchange Act of 1934, the Registrant has duly caused this
report to be signed on its behalf by the undersigned, thereunto duly authorized.


                                                      MCKESSON CORPORATION

Dated: November 2, 2001                                          /s/   WILLIAM R. GRABER
                                                                         William R. Graber
                                                          Senior Vice President and Chief Financial OÇcer


                                                                    /s/  NIGEL A. REES
                                                                          Nigel A. Rees
                                                                   Vice President and Controller


                                                     22

More Related Content

What's hot

Mekesson Quarterly Reports 2002 3rd
Mekesson Quarterly Reports 2002 3rdMekesson Quarterly Reports 2002 3rd
Mekesson Quarterly Reports 2002 3rdfinance2
 
Mekesson Quarterly Reports 2007 1st
Mekesson Quarterly Reports 2007 1stMekesson Quarterly Reports 2007 1st
Mekesson Quarterly Reports 2007 1stfinance2
 
PCAR Sept 2002_10-Q
PCAR Sept 2002_10-QPCAR Sept 2002_10-Q
PCAR Sept 2002_10-Qfinance17
 
PCARSept2003_10-Q
PCARSept2003_10-QPCARSept2003_10-Q
PCARSept2003_10-Qfinance17
 
PCARJune2003_10-Q
PCARJune2003_10-QPCARJune2003_10-Q
PCARJune2003_10-Qfinance17
 
PCAR Sept 2004_10-Q
PCAR Sept 2004_10-QPCAR Sept 2004_10-Q
PCAR Sept 2004_10-Qfinance17
 
Mekesson Quarterly Reports 2006 3rd
Mekesson Quarterly Reports 2006 3rdMekesson Quarterly Reports 2006 3rd
Mekesson Quarterly Reports 2006 3rdfinance2
 
johnson controls FY2005 1st Quarter Form 10-QA
johnson controls  FY2005 1st Quarter Form 10-QA  johnson controls  FY2005 1st Quarter Form 10-QA
johnson controls FY2005 1st Quarter Form 10-QA finance8
 
johnson controls FY2008 1st Quarter Form 10-Q
johnson controls  FY2008 1st Quarter Form 10-Q  johnson controls  FY2008 1st Quarter Form 10-Q
johnson controls FY2008 1st Quarter Form 10-Q finance8
 
unisys 2001_3Q_10Q
unisys 2001_3Q_10Qunisys 2001_3Q_10Q
unisys 2001_3Q_10Qfinance36
 
unisys 2002_2Q_10Q
unisys 2002_2Q_10Qunisys 2002_2Q_10Q
unisys 2002_2Q_10Qfinance36
 
unisys 2001_2Q_10Q
unisys 2001_2Q_10Qunisys 2001_2Q_10Q
unisys 2001_2Q_10Qfinance36
 
Mekesson Quarterly Reports 2005 1st
Mekesson Quarterly Reports 2005 1stMekesson Quarterly Reports 2005 1st
Mekesson Quarterly Reports 2005 1stfinance2
 
tenet healthcare CY0510QA1SEPFinal
tenet healthcare CY0510QA1SEPFinaltenet healthcare CY0510QA1SEPFinal
tenet healthcare CY0510QA1SEPFinalfinance42
 
unisys 2001_1Q_10Q
unisys 2001_1Q_10Qunisys 2001_1Q_10Q
unisys 2001_1Q_10Qfinance36
 
unisys 2002_1Q_10Q
unisys 2002_1Q_10Qunisys 2002_1Q_10Q
unisys 2002_1Q_10Qfinance36
 
Mekesson Quarterly Reports 2003 3rd
Mekesson Quarterly Reports 2003 3rdMekesson Quarterly Reports 2003 3rd
Mekesson Quarterly Reports 2003 3rdfinance2
 
PCAR Sept 2005_10-Q
PCAR Sept 2005_10-QPCAR Sept 2005_10-Q
PCAR Sept 2005_10-Qfinance17
 
Mekesson Quarterly Reports 2003 1st
Mekesson Quarterly Reports 2003 1stMekesson Quarterly Reports 2003 1st
Mekesson Quarterly Reports 2003 1stfinance2
 

What's hot (20)

Mekesson Quarterly Reports 2002 3rd
Mekesson Quarterly Reports 2002 3rdMekesson Quarterly Reports 2002 3rd
Mekesson Quarterly Reports 2002 3rd
 
Mekesson Quarterly Reports 2007 1st
Mekesson Quarterly Reports 2007 1stMekesson Quarterly Reports 2007 1st
Mekesson Quarterly Reports 2007 1st
 
ustr_ar01
ustr_ar01ustr_ar01
ustr_ar01
 
PCAR Sept 2002_10-Q
PCAR Sept 2002_10-QPCAR Sept 2002_10-Q
PCAR Sept 2002_10-Q
 
PCARSept2003_10-Q
PCARSept2003_10-QPCARSept2003_10-Q
PCARSept2003_10-Q
 
PCARJune2003_10-Q
PCARJune2003_10-QPCARJune2003_10-Q
PCARJune2003_10-Q
 
PCAR Sept 2004_10-Q
PCAR Sept 2004_10-QPCAR Sept 2004_10-Q
PCAR Sept 2004_10-Q
 
Mekesson Quarterly Reports 2006 3rd
Mekesson Quarterly Reports 2006 3rdMekesson Quarterly Reports 2006 3rd
Mekesson Quarterly Reports 2006 3rd
 
johnson controls FY2005 1st Quarter Form 10-QA
johnson controls  FY2005 1st Quarter Form 10-QA  johnson controls  FY2005 1st Quarter Form 10-QA
johnson controls FY2005 1st Quarter Form 10-QA
 
johnson controls FY2008 1st Quarter Form 10-Q
johnson controls  FY2008 1st Quarter Form 10-Q  johnson controls  FY2008 1st Quarter Form 10-Q
johnson controls FY2008 1st Quarter Form 10-Q
 
unisys 2001_3Q_10Q
unisys 2001_3Q_10Qunisys 2001_3Q_10Q
unisys 2001_3Q_10Q
 
unisys 2002_2Q_10Q
unisys 2002_2Q_10Qunisys 2002_2Q_10Q
unisys 2002_2Q_10Q
 
unisys 2001_2Q_10Q
unisys 2001_2Q_10Qunisys 2001_2Q_10Q
unisys 2001_2Q_10Q
 
Mekesson Quarterly Reports 2005 1st
Mekesson Quarterly Reports 2005 1stMekesson Quarterly Reports 2005 1st
Mekesson Quarterly Reports 2005 1st
 
tenet healthcare CY0510QA1SEPFinal
tenet healthcare CY0510QA1SEPFinaltenet healthcare CY0510QA1SEPFinal
tenet healthcare CY0510QA1SEPFinal
 
unisys 2001_1Q_10Q
unisys 2001_1Q_10Qunisys 2001_1Q_10Q
unisys 2001_1Q_10Q
 
unisys 2002_1Q_10Q
unisys 2002_1Q_10Qunisys 2002_1Q_10Q
unisys 2002_1Q_10Q
 
Mekesson Quarterly Reports 2003 3rd
Mekesson Quarterly Reports 2003 3rdMekesson Quarterly Reports 2003 3rd
Mekesson Quarterly Reports 2003 3rd
 
PCAR Sept 2005_10-Q
PCAR Sept 2005_10-QPCAR Sept 2005_10-Q
PCAR Sept 2005_10-Q
 
Mekesson Quarterly Reports 2003 1st
Mekesson Quarterly Reports 2003 1stMekesson Quarterly Reports 2003 1st
Mekesson Quarterly Reports 2003 1st
 

Viewers also liked

AIG First Quarter 2008March 31, 2008 Form 10-Q
AIG First Quarter 2008March 31, 2008 Form 10-QAIG First Quarter 2008March 31, 2008 Form 10-Q
AIG First Quarter 2008March 31, 2008 Form 10-Qfinance2
 
Goldman Sachs Healthcare Conference Presentation
	 Goldman Sachs Healthcare Conference Presentation	 Goldman Sachs Healthcare Conference Presentation
Goldman Sachs Healthcare Conference Presentationfinance2
 
home depot Annual Report 2002
home depot Annual Report 2002home depot Annual Report 2002
home depot Annual Report 2002finance2
 
A Thiem Internship Evaluation 2014 - signed-1
A Thiem Internship Evaluation 2014 - signed-1A Thiem Internship Evaluation 2014 - signed-1
A Thiem Internship Evaluation 2014 - signed-1Andrew Thiem
 
Brochure_-_Bulk_Material_Handling_and_Mining
Brochure_-_Bulk_Material_Handling_and_MiningBrochure_-_Bulk_Material_Handling_and_Mining
Brochure_-_Bulk_Material_Handling_and_MiningMarvin Smith
 
Az érintőképernyők evolúciója - Kollin Zoltán
Az érintőképernyők evolúciója - Kollin ZoltánAz érintőképernyők evolúciója - Kollin Zoltán
Az érintőképernyők evolúciója - Kollin ZoltánZoltan Kollin
 
Презентація опису досвіду роботи Мандзій О.Р.
Презентація опису досвіду роботи Мандзій О.Р.Презентація опису досвіду роботи Мандзій О.Р.
Презентація опису досвіду роботи Мандзій О.Р.mandziyolexandra
 
UX Design: A Concept and Evolution
UX Design: A Concept and EvolutionUX Design: A Concept and Evolution
UX Design: A Concept and EvolutionAppsbee
 
Exposición diseño mecánico
Exposición diseño mecánicoExposición diseño mecánico
Exposición diseño mecánicoBenito Gomez Hdez
 
Social Media Policy Workshop - Introduction
Social Media Policy Workshop - IntroductionSocial Media Policy Workshop - Introduction
Social Media Policy Workshop - IntroductionTanya Bennett
 
Shopify - Start Your Business Now
Shopify - Start Your Business NowShopify - Start Your Business Now
Shopify - Start Your Business Nowkabukithemes
 
mckesson Annual Report as Filed on Form 10-K - 740k 2003
mckesson Annual Report as Filed on Form 10-K - 740k 2003mckesson Annual Report as Filed on Form 10-K - 740k 2003
mckesson Annual Report as Filed on Form 10-K - 740k 2003finance2
 
valero energy Annual Reports 2004
valero energy Annual Reports 2004valero energy Annual Reports 2004
valero energy Annual Reports 2004finance2
 
AIG Second Quarter 2008 Conference Call Credit Presentation
AIG Second Quarter 2008 Conference Call Credit PresentationAIG Second Quarter 2008 Conference Call Credit Presentation
AIG Second Quarter 2008 Conference Call Credit Presentationfinance2
 
JPMorgan Chase Share Exchange Agreement 3-24-08
JPMorgan Chase Share Exchange Agreement 3-24-08  JPMorgan Chase Share Exchange Agreement 3-24-08
JPMorgan Chase Share Exchange Agreement 3-24-08 finance2
 

Viewers also liked (20)

AIG First Quarter 2008March 31, 2008 Form 10-Q
AIG First Quarter 2008March 31, 2008 Form 10-QAIG First Quarter 2008March 31, 2008 Form 10-Q
AIG First Quarter 2008March 31, 2008 Form 10-Q
 
Goldman Sachs Healthcare Conference Presentation
	 Goldman Sachs Healthcare Conference Presentation	 Goldman Sachs Healthcare Conference Presentation
Goldman Sachs Healthcare Conference Presentation
 
home depot Annual Report 2002
home depot Annual Report 2002home depot Annual Report 2002
home depot Annual Report 2002
 
A Thiem Internship Evaluation 2014 - signed-1
A Thiem Internship Evaluation 2014 - signed-1A Thiem Internship Evaluation 2014 - signed-1
A Thiem Internship Evaluation 2014 - signed-1
 
Brochure_-_Bulk_Material_Handling_and_Mining
Brochure_-_Bulk_Material_Handling_and_MiningBrochure_-_Bulk_Material_Handling_and_Mining
Brochure_-_Bulk_Material_Handling_and_Mining
 
Deck
Deck Deck
Deck
 
Az érintőképernyők evolúciója - Kollin Zoltán
Az érintőképernyők evolúciója - Kollin ZoltánAz érintőképernyők evolúciója - Kollin Zoltán
Az érintőképernyők evolúciója - Kollin Zoltán
 
cv M Syihabul Fikri
cv M Syihabul Fikricv M Syihabul Fikri
cv M Syihabul Fikri
 
Estructura Organizativa
Estructura OrganizativaEstructura Organizativa
Estructura Organizativa
 
Sam’s biscuit
Sam’s  biscuitSam’s  biscuit
Sam’s biscuit
 
Презентація опису досвіду роботи Мандзій О.Р.
Презентація опису досвіду роботи Мандзій О.Р.Презентація опису досвіду роботи Мандзій О.Р.
Презентація опису досвіду роботи Мандзій О.Р.
 
UX Design: A Concept and Evolution
UX Design: A Concept and EvolutionUX Design: A Concept and Evolution
UX Design: A Concept and Evolution
 
Exposición diseño mecánico
Exposición diseño mecánicoExposición diseño mecánico
Exposición diseño mecánico
 
Social Media Policy Workshop - Introduction
Social Media Policy Workshop - IntroductionSocial Media Policy Workshop - Introduction
Social Media Policy Workshop - Introduction
 
Personal Code of Ethics
Personal Code of EthicsPersonal Code of Ethics
Personal Code of Ethics
 
Shopify - Start Your Business Now
Shopify - Start Your Business NowShopify - Start Your Business Now
Shopify - Start Your Business Now
 
mckesson Annual Report as Filed on Form 10-K - 740k 2003
mckesson Annual Report as Filed on Form 10-K - 740k 2003mckesson Annual Report as Filed on Form 10-K - 740k 2003
mckesson Annual Report as Filed on Form 10-K - 740k 2003
 
valero energy Annual Reports 2004
valero energy Annual Reports 2004valero energy Annual Reports 2004
valero energy Annual Reports 2004
 
AIG Second Quarter 2008 Conference Call Credit Presentation
AIG Second Quarter 2008 Conference Call Credit PresentationAIG Second Quarter 2008 Conference Call Credit Presentation
AIG Second Quarter 2008 Conference Call Credit Presentation
 
JPMorgan Chase Share Exchange Agreement 3-24-08
JPMorgan Chase Share Exchange Agreement 3-24-08  JPMorgan Chase Share Exchange Agreement 3-24-08
JPMorgan Chase Share Exchange Agreement 3-24-08
 

Similar to Mekesson Quarterly Reports 2002 2nd

Mekesson Quarterly Reports 2004 2nd
Mekesson Quarterly Reports 2004 2nd  Mekesson Quarterly Reports 2004 2nd
Mekesson Quarterly Reports 2004 2nd finance2
 
Mekesson Quarterly Reports 2005 3rd
Mekesson Quarterly Reports 2005 3rdMekesson Quarterly Reports 2005 3rd
Mekesson Quarterly Reports 2005 3rdfinance2
 
United Health Group [PDF Document] Form 10-Q
United Health Group [PDF Document] Form 10-QUnited Health Group [PDF Document] Form 10-Q
United Health Group [PDF Document] Form 10-Qfinance3
 
Mekesson Quarterly Reports 2005 2nd
Mekesson Quarterly Reports 2005 2ndMekesson Quarterly Reports 2005 2nd
Mekesson Quarterly Reports 2005 2ndfinance2
 
xcel energy NSP-WI_10Q_Q32008
xcel energy NSP-WI_10Q_Q32008xcel energy NSP-WI_10Q_Q32008
xcel energy NSP-WI_10Q_Q32008finance26
 
xcel energy NSP-WI_10Q_Q32008
xcel energy NSP-WI_10Q_Q32008xcel energy NSP-WI_10Q_Q32008
xcel energy NSP-WI_10Q_Q32008finance26
 
tollbrothers 10-Q_apr_2003
 tollbrothers   10-Q_apr_2003 tollbrothers   10-Q_apr_2003
tollbrothers 10-Q_apr_2003finance50
 
visteon 1Q 2003 Form 10-Q
visteon 1Q 2003 Form 10-Qvisteon 1Q 2003 Form 10-Q
visteon 1Q 2003 Form 10-Qfinance24
 
tollbrothers 10-Q_jul_2003
 tollbrothers   10-Q_jul_2003 tollbrothers   10-Q_jul_2003
tollbrothers 10-Q_jul_2003finance50
 
tollbrothers 10-Q_jul_2003
 tollbrothers   10-Q_jul_2003 tollbrothers   10-Q_jul_2003
tollbrothers 10-Q_jul_2003finance50
 
Xel_4Company_1Q 2002 10Q
Xel_4Company_1Q 2002 10QXel_4Company_1Q 2002 10Q
Xel_4Company_1Q 2002 10Qfinance26
 
Xel_4Company_1Q 2002 10Q
Xel_4Company_1Q 2002 10QXel_4Company_1Q 2002 10Q
Xel_4Company_1Q 2002 10Qfinance26
 
tollbrothers 10-Q_apr_2002
 tollbrothers   10-Q_apr_2002 tollbrothers   10-Q_apr_2002
tollbrothers 10-Q_apr_2002finance50
 
tollbrothers 10-Q_apr_2002
 tollbrothers   10-Q_apr_2002 tollbrothers   10-Q_apr_2002
tollbrothers 10-Q_apr_2002finance50
 
Mekesson Quarterly Reports 2004 3rd
Mekesson Quarterly Reports 2004 3rdMekesson Quarterly Reports 2004 3rd
Mekesson Quarterly Reports 2004 3rdfinance2
 
Mekesson Quarterly Reports 2004 1st
Mekesson Quarterly Reports 2004 1st Mekesson Quarterly Reports 2004 1st
Mekesson Quarterly Reports 2004 1st finance2
 
xcel energy 10qxcel1q04
xcel energy 10qxcel1q04xcel energy 10qxcel1q04
xcel energy 10qxcel1q04finance26
 
10q xcel1q04
10q xcel1q0410q xcel1q04
10q xcel1q04finance26
 
tollbrothers 10-Q_jan_2003
 tollbrothers   10-Q_jan_2003 tollbrothers   10-Q_jan_2003
tollbrothers 10-Q_jan_2003finance50
 
tollbrothers 10-Q_jan_2003
 tollbrothers   10-Q_jan_2003 tollbrothers   10-Q_jan_2003
tollbrothers 10-Q_jan_2003finance50
 

Similar to Mekesson Quarterly Reports 2002 2nd (20)

Mekesson Quarterly Reports 2004 2nd
Mekesson Quarterly Reports 2004 2nd  Mekesson Quarterly Reports 2004 2nd
Mekesson Quarterly Reports 2004 2nd
 
Mekesson Quarterly Reports 2005 3rd
Mekesson Quarterly Reports 2005 3rdMekesson Quarterly Reports 2005 3rd
Mekesson Quarterly Reports 2005 3rd
 
United Health Group [PDF Document] Form 10-Q
United Health Group [PDF Document] Form 10-QUnited Health Group [PDF Document] Form 10-Q
United Health Group [PDF Document] Form 10-Q
 
Mekesson Quarterly Reports 2005 2nd
Mekesson Quarterly Reports 2005 2ndMekesson Quarterly Reports 2005 2nd
Mekesson Quarterly Reports 2005 2nd
 
xcel energy NSP-WI_10Q_Q32008
xcel energy NSP-WI_10Q_Q32008xcel energy NSP-WI_10Q_Q32008
xcel energy NSP-WI_10Q_Q32008
 
xcel energy NSP-WI_10Q_Q32008
xcel energy NSP-WI_10Q_Q32008xcel energy NSP-WI_10Q_Q32008
xcel energy NSP-WI_10Q_Q32008
 
tollbrothers 10-Q_apr_2003
 tollbrothers   10-Q_apr_2003 tollbrothers   10-Q_apr_2003
tollbrothers 10-Q_apr_2003
 
visteon 1Q 2003 Form 10-Q
visteon 1Q 2003 Form 10-Qvisteon 1Q 2003 Form 10-Q
visteon 1Q 2003 Form 10-Q
 
tollbrothers 10-Q_jul_2003
 tollbrothers   10-Q_jul_2003 tollbrothers   10-Q_jul_2003
tollbrothers 10-Q_jul_2003
 
tollbrothers 10-Q_jul_2003
 tollbrothers   10-Q_jul_2003 tollbrothers   10-Q_jul_2003
tollbrothers 10-Q_jul_2003
 
Xel_4Company_1Q 2002 10Q
Xel_4Company_1Q 2002 10QXel_4Company_1Q 2002 10Q
Xel_4Company_1Q 2002 10Q
 
Xel_4Company_1Q 2002 10Q
Xel_4Company_1Q 2002 10QXel_4Company_1Q 2002 10Q
Xel_4Company_1Q 2002 10Q
 
tollbrothers 10-Q_apr_2002
 tollbrothers   10-Q_apr_2002 tollbrothers   10-Q_apr_2002
tollbrothers 10-Q_apr_2002
 
tollbrothers 10-Q_apr_2002
 tollbrothers   10-Q_apr_2002 tollbrothers   10-Q_apr_2002
tollbrothers 10-Q_apr_2002
 
Mekesson Quarterly Reports 2004 3rd
Mekesson Quarterly Reports 2004 3rdMekesson Quarterly Reports 2004 3rd
Mekesson Quarterly Reports 2004 3rd
 
Mekesson Quarterly Reports 2004 1st
Mekesson Quarterly Reports 2004 1st Mekesson Quarterly Reports 2004 1st
Mekesson Quarterly Reports 2004 1st
 
xcel energy 10qxcel1q04
xcel energy 10qxcel1q04xcel energy 10qxcel1q04
xcel energy 10qxcel1q04
 
10q xcel1q04
10q xcel1q0410q xcel1q04
10q xcel1q04
 
tollbrothers 10-Q_jan_2003
 tollbrothers   10-Q_jan_2003 tollbrothers   10-Q_jan_2003
tollbrothers 10-Q_jan_2003
 
tollbrothers 10-Q_jan_2003
 tollbrothers   10-Q_jan_2003 tollbrothers   10-Q_jan_2003
tollbrothers 10-Q_jan_2003
 

More from finance2

The Home Depot Celebrates Hispanic Culture Through Color and Paint With Color...
The Home Depot Celebrates Hispanic Culture Through Color and Paint With Color...The Home Depot Celebrates Hispanic Culture Through Color and Paint With Color...
The Home Depot Celebrates Hispanic Culture Through Color and Paint With Color...finance2
 
The Home Depot and AARP Launch Nationwide Workshops
The Home Depot and AARP Launch Nationwide WorkshopsThe Home Depot and AARP Launch Nationwide Workshops
The Home Depot and AARP Launch Nationwide Workshopsfinance2
 
Nearly Half of Americans Fail to Check Home Safety Devices at Daylight-Saving...
Nearly Half of Americans Fail to Check Home Safety Devices at Daylight-Saving...Nearly Half of Americans Fail to Check Home Safety Devices at Daylight-Saving...
Nearly Half of Americans Fail to Check Home Safety Devices at Daylight-Saving...finance2
 
View Summary The Home Depot Celebrates the Olympic Spirit With Special Kids...
View Summary  	The Home Depot Celebrates the Olympic Spirit With Special Kids...View Summary  	The Home Depot Celebrates the Olympic Spirit With Special Kids...
View Summary The Home Depot Celebrates the Olympic Spirit With Special Kids...finance2
 
The Home Depot Announces First Quarter Results
The Home Depot Announces First Quarter ResultsThe Home Depot Announces First Quarter Results
The Home Depot Announces First Quarter Resultsfinance2
 
home depot Craig Menear Presentation
home depot Craig Menear Presentationhome depot Craig Menear Presentation
home depot Craig Menear Presentationfinance2
 
home depot 2008 Annual Meeting of Stockholders
home depot 2008 Annual Meeting of Stockholdershome depot 2008 Annual Meeting of Stockholders
home depot 2008 Annual Meeting of Stockholdersfinance2
 
home depot Transcript
home depot 	Transcript home depot 	Transcript
home depot Transcript finance2
 
home depot PDF Carol Tomé Presentation
home depot  PDF  	Carol Tomé Presentation home depot  PDF  	Carol Tomé Presentation
home depot PDF Carol Tomé Presentation finance2
 
home depot Paul Raines Presentation
home depot Paul Raines Presentation home depot Paul Raines Presentation
home depot Paul Raines Presentation finance2
 
home depot http://ir.homedepot.com/common/download/download.cfm?companyid=HD&...
home depot http://ir.homedepot.com/common/download/download.cfm?companyid=HD&...home depot http://ir.homedepot.com/common/download/download.cfm?companyid=HD&...
home depot http://ir.homedepot.com/common/download/download.cfm?companyid=HD&...finance2
 
home depot Annual Report 1982
home depot Annual Report 1982home depot Annual Report 1982
home depot Annual Report 1982finance2
 
home depot PDF Frank Blake Presentation
home depot  PDF  	Frank Blake Presentation home depot  PDF  	Frank Blake Presentation
home depot PDF Frank Blake Presentation finance2
 
home depotForward Looking & Non-GAAP Disclosures
home depotForward Looking & Non-GAAP Disclosures home depotForward Looking & Non-GAAP Disclosures
home depotForward Looking & Non-GAAP Disclosures finance2
 
home depot Bank of America 38th Annual Investment Conference
home depot Bank of America 38th Annual Investment Conferencehome depot Bank of America 38th Annual Investment Conference
home depot Bank of America 38th Annual Investment Conferencefinance2
 
2008 Home Depot Inc. Earnings Conference
2008 Home Depot Inc. Earnings Conference  2008 Home Depot Inc. Earnings Conference
2008 Home Depot Inc. Earnings Conference finance2
 
home depot Quarterly Earnings 2008 3rd
home depot  Quarterly Earnings 2008 3rdhome depot  Quarterly Earnings 2008 3rd
home depot Quarterly Earnings 2008 3rdfinance2
 
home depot Annual Report 1983
home depot Annual Report 1983home depot Annual Report 1983
home depot Annual Report 1983finance2
 
home depot Annual Report 1984
home depot Annual Report 1984home depot Annual Report 1984
home depot Annual Report 1984finance2
 
home depot Annual Report 1985
home depot Annual Report 1985home depot Annual Report 1985
home depot Annual Report 1985finance2
 

More from finance2 (20)

The Home Depot Celebrates Hispanic Culture Through Color and Paint With Color...
The Home Depot Celebrates Hispanic Culture Through Color and Paint With Color...The Home Depot Celebrates Hispanic Culture Through Color and Paint With Color...
The Home Depot Celebrates Hispanic Culture Through Color and Paint With Color...
 
The Home Depot and AARP Launch Nationwide Workshops
The Home Depot and AARP Launch Nationwide WorkshopsThe Home Depot and AARP Launch Nationwide Workshops
The Home Depot and AARP Launch Nationwide Workshops
 
Nearly Half of Americans Fail to Check Home Safety Devices at Daylight-Saving...
Nearly Half of Americans Fail to Check Home Safety Devices at Daylight-Saving...Nearly Half of Americans Fail to Check Home Safety Devices at Daylight-Saving...
Nearly Half of Americans Fail to Check Home Safety Devices at Daylight-Saving...
 
View Summary The Home Depot Celebrates the Olympic Spirit With Special Kids...
View Summary  	The Home Depot Celebrates the Olympic Spirit With Special Kids...View Summary  	The Home Depot Celebrates the Olympic Spirit With Special Kids...
View Summary The Home Depot Celebrates the Olympic Spirit With Special Kids...
 
The Home Depot Announces First Quarter Results
The Home Depot Announces First Quarter ResultsThe Home Depot Announces First Quarter Results
The Home Depot Announces First Quarter Results
 
home depot Craig Menear Presentation
home depot Craig Menear Presentationhome depot Craig Menear Presentation
home depot Craig Menear Presentation
 
home depot 2008 Annual Meeting of Stockholders
home depot 2008 Annual Meeting of Stockholdershome depot 2008 Annual Meeting of Stockholders
home depot 2008 Annual Meeting of Stockholders
 
home depot Transcript
home depot 	Transcript home depot 	Transcript
home depot Transcript
 
home depot PDF Carol Tomé Presentation
home depot  PDF  	Carol Tomé Presentation home depot  PDF  	Carol Tomé Presentation
home depot PDF Carol Tomé Presentation
 
home depot Paul Raines Presentation
home depot Paul Raines Presentation home depot Paul Raines Presentation
home depot Paul Raines Presentation
 
home depot http://ir.homedepot.com/common/download/download.cfm?companyid=HD&...
home depot http://ir.homedepot.com/common/download/download.cfm?companyid=HD&...home depot http://ir.homedepot.com/common/download/download.cfm?companyid=HD&...
home depot http://ir.homedepot.com/common/download/download.cfm?companyid=HD&...
 
home depot Annual Report 1982
home depot Annual Report 1982home depot Annual Report 1982
home depot Annual Report 1982
 
home depot PDF Frank Blake Presentation
home depot  PDF  	Frank Blake Presentation home depot  PDF  	Frank Blake Presentation
home depot PDF Frank Blake Presentation
 
home depotForward Looking & Non-GAAP Disclosures
home depotForward Looking & Non-GAAP Disclosures home depotForward Looking & Non-GAAP Disclosures
home depotForward Looking & Non-GAAP Disclosures
 
home depot Bank of America 38th Annual Investment Conference
home depot Bank of America 38th Annual Investment Conferencehome depot Bank of America 38th Annual Investment Conference
home depot Bank of America 38th Annual Investment Conference
 
2008 Home Depot Inc. Earnings Conference
2008 Home Depot Inc. Earnings Conference  2008 Home Depot Inc. Earnings Conference
2008 Home Depot Inc. Earnings Conference
 
home depot Quarterly Earnings 2008 3rd
home depot  Quarterly Earnings 2008 3rdhome depot  Quarterly Earnings 2008 3rd
home depot Quarterly Earnings 2008 3rd
 
home depot Annual Report 1983
home depot Annual Report 1983home depot Annual Report 1983
home depot Annual Report 1983
 
home depot Annual Report 1984
home depot Annual Report 1984home depot Annual Report 1984
home depot Annual Report 1984
 
home depot Annual Report 1985
home depot Annual Report 1985home depot Annual Report 1985
home depot Annual Report 1985
 

Recently uploaded

Solution Manual for Financial Accounting, 11th Edition by Robert Libby, Patri...
Solution Manual for Financial Accounting, 11th Edition by Robert Libby, Patri...Solution Manual for Financial Accounting, 11th Edition by Robert Libby, Patri...
Solution Manual for Financial Accounting, 11th Edition by Robert Libby, Patri...ssifa0344
 
Best VIP Call Girls Noida Sector 18 Call Me: 8448380779
Best VIP Call Girls Noida Sector 18 Call Me: 8448380779Best VIP Call Girls Noida Sector 18 Call Me: 8448380779
Best VIP Call Girls Noida Sector 18 Call Me: 8448380779Delhi Call girls
 
Russian Call Girls In Gtb Nagar (Delhi) 9711199012 💋✔💕😘 Naughty Call Girls Se...
Russian Call Girls In Gtb Nagar (Delhi) 9711199012 💋✔💕😘 Naughty Call Girls Se...Russian Call Girls In Gtb Nagar (Delhi) 9711199012 💋✔💕😘 Naughty Call Girls Se...
Russian Call Girls In Gtb Nagar (Delhi) 9711199012 💋✔💕😘 Naughty Call Girls Se...shivangimorya083
 
OAT_RI_Ep19 WeighingTheRisks_Apr24_TheYellowMetal.pptx
OAT_RI_Ep19 WeighingTheRisks_Apr24_TheYellowMetal.pptxOAT_RI_Ep19 WeighingTheRisks_Apr24_TheYellowMetal.pptx
OAT_RI_Ep19 WeighingTheRisks_Apr24_TheYellowMetal.pptxhiddenlevers
 
The Economic History of the U.S. Lecture 19.pdf
The Economic History of the U.S. Lecture 19.pdfThe Economic History of the U.S. Lecture 19.pdf
The Economic History of the U.S. Lecture 19.pdfGale Pooley
 
Dharavi Russian callg Girls, { 09892124323 } || Call Girl In Mumbai ...
Dharavi Russian callg Girls, { 09892124323 } || Call Girl In Mumbai ...Dharavi Russian callg Girls, { 09892124323 } || Call Girl In Mumbai ...
Dharavi Russian callg Girls, { 09892124323 } || Call Girl In Mumbai ...Pooja Nehwal
 
20240429 Calibre April 2024 Investor Presentation.pdf
20240429 Calibre April 2024 Investor Presentation.pdf20240429 Calibre April 2024 Investor Presentation.pdf
20240429 Calibre April 2024 Investor Presentation.pdfAdnet Communications
 
Call US 📞 9892124323 ✅ Kurla Call Girls In Kurla ( Mumbai ) secure service
Call US 📞 9892124323 ✅ Kurla Call Girls In Kurla ( Mumbai ) secure serviceCall US 📞 9892124323 ✅ Kurla Call Girls In Kurla ( Mumbai ) secure service
Call US 📞 9892124323 ✅ Kurla Call Girls In Kurla ( Mumbai ) secure servicePooja Nehwal
 
Vip B Aizawl Call Girls #9907093804 Contact Number Escorts Service Aizawl
Vip B Aizawl Call Girls #9907093804 Contact Number Escorts Service AizawlVip B Aizawl Call Girls #9907093804 Contact Number Escorts Service Aizawl
Vip B Aizawl Call Girls #9907093804 Contact Number Escorts Service Aizawlmakika9823
 
The Economic History of the U.S. Lecture 21.pdf
The Economic History of the U.S. Lecture 21.pdfThe Economic History of the U.S. Lecture 21.pdf
The Economic History of the U.S. Lecture 21.pdfGale Pooley
 
Interimreport1 January–31 March2024 Elo Mutual Pension Insurance Company
Interimreport1 January–31 March2024 Elo Mutual Pension Insurance CompanyInterimreport1 January–31 March2024 Elo Mutual Pension Insurance Company
Interimreport1 January–31 March2024 Elo Mutual Pension Insurance CompanyTyöeläkeyhtiö Elo
 
Q3 2024 Earnings Conference Call and Webcast Slides
Q3 2024 Earnings Conference Call and Webcast SlidesQ3 2024 Earnings Conference Call and Webcast Slides
Q3 2024 Earnings Conference Call and Webcast SlidesMarketing847413
 
VVIP Pune Call Girls Katraj (7001035870) Pune Escorts Nearby with Complete Sa...
VVIP Pune Call Girls Katraj (7001035870) Pune Escorts Nearby with Complete Sa...VVIP Pune Call Girls Katraj (7001035870) Pune Escorts Nearby with Complete Sa...
VVIP Pune Call Girls Katraj (7001035870) Pune Escorts Nearby with Complete Sa...Call Girls in Nagpur High Profile
 
Log your LOA pain with Pension Lab's brilliant campaign
Log your LOA pain with Pension Lab's brilliant campaignLog your LOA pain with Pension Lab's brilliant campaign
Log your LOA pain with Pension Lab's brilliant campaignHenry Tapper
 
03_Emmanuel Ndiaye_Degroof Petercam.pptx
03_Emmanuel Ndiaye_Degroof Petercam.pptx03_Emmanuel Ndiaye_Degroof Petercam.pptx
03_Emmanuel Ndiaye_Degroof Petercam.pptxFinTech Belgium
 
Independent Lucknow Call Girls 8923113531WhatsApp Lucknow Call Girls make you...
Independent Lucknow Call Girls 8923113531WhatsApp Lucknow Call Girls make you...Independent Lucknow Call Girls 8923113531WhatsApp Lucknow Call Girls make you...
Independent Lucknow Call Girls 8923113531WhatsApp Lucknow Call Girls make you...makika9823
 
How Automation is Driving Efficiency Through the Last Mile of Reporting
How Automation is Driving Efficiency Through the Last Mile of ReportingHow Automation is Driving Efficiency Through the Last Mile of Reporting
How Automation is Driving Efficiency Through the Last Mile of ReportingAggregage
 
(ANIKA) Budhwar Peth Call Girls Just Call 7001035870 [ Cash on Delivery ] Pun...
(ANIKA) Budhwar Peth Call Girls Just Call 7001035870 [ Cash on Delivery ] Pun...(ANIKA) Budhwar Peth Call Girls Just Call 7001035870 [ Cash on Delivery ] Pun...
(ANIKA) Budhwar Peth Call Girls Just Call 7001035870 [ Cash on Delivery ] Pun...ranjana rawat
 
The Economic History of the U.S. Lecture 30.pdf
The Economic History of the U.S. Lecture 30.pdfThe Economic History of the U.S. Lecture 30.pdf
The Economic History of the U.S. Lecture 30.pdfGale Pooley
 
06_Joeri Van Speybroek_Dell_MeetupDora&Cybersecurity.pdf
06_Joeri Van Speybroek_Dell_MeetupDora&Cybersecurity.pdf06_Joeri Van Speybroek_Dell_MeetupDora&Cybersecurity.pdf
06_Joeri Van Speybroek_Dell_MeetupDora&Cybersecurity.pdfFinTech Belgium
 

Recently uploaded (20)

Solution Manual for Financial Accounting, 11th Edition by Robert Libby, Patri...
Solution Manual for Financial Accounting, 11th Edition by Robert Libby, Patri...Solution Manual for Financial Accounting, 11th Edition by Robert Libby, Patri...
Solution Manual for Financial Accounting, 11th Edition by Robert Libby, Patri...
 
Best VIP Call Girls Noida Sector 18 Call Me: 8448380779
Best VIP Call Girls Noida Sector 18 Call Me: 8448380779Best VIP Call Girls Noida Sector 18 Call Me: 8448380779
Best VIP Call Girls Noida Sector 18 Call Me: 8448380779
 
Russian Call Girls In Gtb Nagar (Delhi) 9711199012 💋✔💕😘 Naughty Call Girls Se...
Russian Call Girls In Gtb Nagar (Delhi) 9711199012 💋✔💕😘 Naughty Call Girls Se...Russian Call Girls In Gtb Nagar (Delhi) 9711199012 💋✔💕😘 Naughty Call Girls Se...
Russian Call Girls In Gtb Nagar (Delhi) 9711199012 💋✔💕😘 Naughty Call Girls Se...
 
OAT_RI_Ep19 WeighingTheRisks_Apr24_TheYellowMetal.pptx
OAT_RI_Ep19 WeighingTheRisks_Apr24_TheYellowMetal.pptxOAT_RI_Ep19 WeighingTheRisks_Apr24_TheYellowMetal.pptx
OAT_RI_Ep19 WeighingTheRisks_Apr24_TheYellowMetal.pptx
 
The Economic History of the U.S. Lecture 19.pdf
The Economic History of the U.S. Lecture 19.pdfThe Economic History of the U.S. Lecture 19.pdf
The Economic History of the U.S. Lecture 19.pdf
 
Dharavi Russian callg Girls, { 09892124323 } || Call Girl In Mumbai ...
Dharavi Russian callg Girls, { 09892124323 } || Call Girl In Mumbai ...Dharavi Russian callg Girls, { 09892124323 } || Call Girl In Mumbai ...
Dharavi Russian callg Girls, { 09892124323 } || Call Girl In Mumbai ...
 
20240429 Calibre April 2024 Investor Presentation.pdf
20240429 Calibre April 2024 Investor Presentation.pdf20240429 Calibre April 2024 Investor Presentation.pdf
20240429 Calibre April 2024 Investor Presentation.pdf
 
Call US 📞 9892124323 ✅ Kurla Call Girls In Kurla ( Mumbai ) secure service
Call US 📞 9892124323 ✅ Kurla Call Girls In Kurla ( Mumbai ) secure serviceCall US 📞 9892124323 ✅ Kurla Call Girls In Kurla ( Mumbai ) secure service
Call US 📞 9892124323 ✅ Kurla Call Girls In Kurla ( Mumbai ) secure service
 
Vip B Aizawl Call Girls #9907093804 Contact Number Escorts Service Aizawl
Vip B Aizawl Call Girls #9907093804 Contact Number Escorts Service AizawlVip B Aizawl Call Girls #9907093804 Contact Number Escorts Service Aizawl
Vip B Aizawl Call Girls #9907093804 Contact Number Escorts Service Aizawl
 
The Economic History of the U.S. Lecture 21.pdf
The Economic History of the U.S. Lecture 21.pdfThe Economic History of the U.S. Lecture 21.pdf
The Economic History of the U.S. Lecture 21.pdf
 
Interimreport1 January–31 March2024 Elo Mutual Pension Insurance Company
Interimreport1 January–31 March2024 Elo Mutual Pension Insurance CompanyInterimreport1 January–31 March2024 Elo Mutual Pension Insurance Company
Interimreport1 January–31 March2024 Elo Mutual Pension Insurance Company
 
Q3 2024 Earnings Conference Call and Webcast Slides
Q3 2024 Earnings Conference Call and Webcast SlidesQ3 2024 Earnings Conference Call and Webcast Slides
Q3 2024 Earnings Conference Call and Webcast Slides
 
VVIP Pune Call Girls Katraj (7001035870) Pune Escorts Nearby with Complete Sa...
VVIP Pune Call Girls Katraj (7001035870) Pune Escorts Nearby with Complete Sa...VVIP Pune Call Girls Katraj (7001035870) Pune Escorts Nearby with Complete Sa...
VVIP Pune Call Girls Katraj (7001035870) Pune Escorts Nearby with Complete Sa...
 
Log your LOA pain with Pension Lab's brilliant campaign
Log your LOA pain with Pension Lab's brilliant campaignLog your LOA pain with Pension Lab's brilliant campaign
Log your LOA pain with Pension Lab's brilliant campaign
 
03_Emmanuel Ndiaye_Degroof Petercam.pptx
03_Emmanuel Ndiaye_Degroof Petercam.pptx03_Emmanuel Ndiaye_Degroof Petercam.pptx
03_Emmanuel Ndiaye_Degroof Petercam.pptx
 
Independent Lucknow Call Girls 8923113531WhatsApp Lucknow Call Girls make you...
Independent Lucknow Call Girls 8923113531WhatsApp Lucknow Call Girls make you...Independent Lucknow Call Girls 8923113531WhatsApp Lucknow Call Girls make you...
Independent Lucknow Call Girls 8923113531WhatsApp Lucknow Call Girls make you...
 
How Automation is Driving Efficiency Through the Last Mile of Reporting
How Automation is Driving Efficiency Through the Last Mile of ReportingHow Automation is Driving Efficiency Through the Last Mile of Reporting
How Automation is Driving Efficiency Through the Last Mile of Reporting
 
(ANIKA) Budhwar Peth Call Girls Just Call 7001035870 [ Cash on Delivery ] Pun...
(ANIKA) Budhwar Peth Call Girls Just Call 7001035870 [ Cash on Delivery ] Pun...(ANIKA) Budhwar Peth Call Girls Just Call 7001035870 [ Cash on Delivery ] Pun...
(ANIKA) Budhwar Peth Call Girls Just Call 7001035870 [ Cash on Delivery ] Pun...
 
The Economic History of the U.S. Lecture 30.pdf
The Economic History of the U.S. Lecture 30.pdfThe Economic History of the U.S. Lecture 30.pdf
The Economic History of the U.S. Lecture 30.pdf
 
06_Joeri Van Speybroek_Dell_MeetupDora&Cybersecurity.pdf
06_Joeri Van Speybroek_Dell_MeetupDora&Cybersecurity.pdf06_Joeri Van Speybroek_Dell_MeetupDora&Cybersecurity.pdf
06_Joeri Van Speybroek_Dell_MeetupDora&Cybersecurity.pdf
 

Mekesson Quarterly Reports 2002 2nd

  • 1. SECURITIES AND EXCHANGE COMMISSION Washington, D.C. 20549 Form 10-Q (Mark One) ¥ QUARTERLY REPORT PURSUANT TO SECTION 13 OR 15(d) OF THE SECURITIES EXCHANGE ACT OF 1934 For quarter ended September 30, 2001 n TRANSITION REPORT PURSUANT TO SECTION 13 OR 15(d) OF THE SECURITIES EXCHANGE ACT OF 1934 For the transition period from to Commission Ñle number 1-13252 McKesson Corporation (Exact name of Registrant as speciÑed in its charter) Delaware 94-3207296 (State or other jurisdiction of (IRS Employer incorporation or organization) IdentiÑcation No.) One Post Street, San Francisco, California 94104 (Address of principal executive oÇces) (Zip Code) (415) 983-8300 (Registrant's telephone number, including area code) Indicate by check mark whether the Registrant (1) has Ñled all reports required to be Ñled by Section 13 or 15(d) of the Securities Exchange Act of 1934 during the preceding 12 months (or for such shorter period that the Registrant was required to Ñle such reports), and (2) has been subject to such Ñling requirements for the past 90 days. Yes ¥ No n Indicate the number of shares outstanding of each of the issuer's classes of common stock, as of the latest practicable date. Outstanding at Class September 30, 2001 Common stock, $.01 par value 285,978,281 shares
  • 2. McKESSON CORPORATION TABLE OF CONTENTS Item Page PART I. FINANCIAL INFORMATION 1. Condensed Financial Statements Consolidated Balance Sheets September 30, 2001 and March 31, 2001ÏÏÏÏÏÏÏÏÏÏÏÏÏÏÏÏÏÏÏÏÏÏÏÏÏÏÏÏÏÏÏÏÏÏÏÏÏÏÏÏÏÏÏ 2 Consolidated Statements of Operations Three and six-month periods ended September 30, 2001 and 2000 ÏÏÏÏÏÏÏÏÏÏÏÏÏÏÏÏÏÏÏÏÏ 3 Consolidated Statements of Cash Flows Six-month periods ended September 30, 2001 and 2000 ÏÏÏÏÏÏÏÏÏÏÏÏÏÏÏÏÏÏÏÏÏÏÏÏÏÏÏÏÏÏ 4 Financial Notes ÏÏÏÏÏÏÏÏÏÏÏÏÏÏÏÏÏÏÏÏÏÏÏÏÏÏÏÏÏÏÏÏÏÏÏÏÏÏÏÏÏÏÏÏÏÏÏÏÏÏÏÏÏÏÏÏÏÏÏÏÏÏÏÏÏÏ 5-13 2. Management's Discussion and Analysis of Financial Condition and Results of Operations Financial Review ÏÏÏÏÏÏÏÏÏÏÏÏÏÏÏÏÏÏÏÏÏÏÏÏÏÏÏÏÏÏÏÏÏÏÏÏÏÏÏÏÏÏÏÏÏÏÏÏÏÏÏÏÏÏÏÏÏÏÏÏÏÏÏ 14-19 3. Quantitative and Qualitative Disclosures about Market Risk ÏÏÏÏÏÏÏÏÏÏÏÏÏÏÏÏÏÏÏÏÏÏÏÏÏÏÏÏ 20 PART II. OTHER INFORMATION 1. Legal Proceedings ÏÏÏÏÏÏÏÏÏÏÏÏÏÏÏÏÏÏÏÏÏÏÏÏÏÏÏÏÏÏÏÏÏÏÏÏÏÏÏÏÏÏÏÏÏÏÏÏÏÏÏÏÏÏÏÏÏÏÏÏÏÏÏÏ 20 4. Submission of Matters to a Vote of Security Holders ÏÏÏÏÏÏÏÏÏÏÏÏÏÏÏÏÏÏÏÏÏÏÏÏÏÏÏÏÏÏÏÏÏÏ 20 6. Exhibits and Reports on Form 8-KÏÏÏÏÏÏÏÏÏÏÏÏÏÏÏÏÏÏÏÏÏÏÏÏÏÏÏÏÏÏÏÏÏÏÏÏÏÏÏÏÏÏÏÏÏÏÏÏÏÏ 21 1
  • 3. PART I. FINANCIAL INFORMATION McKESSON CORPORATION CONSOLIDATED BALANCE SHEETS (Unaudited) September 30, March 31, 2001 2001 (In millions) ASSETS Current Assets Cash and equivalents ÏÏÏÏÏÏÏÏÏÏÏÏÏÏÏÏÏÏÏÏÏÏÏÏÏÏÏÏÏÏÏÏÏÏÏÏÏÏÏÏÏÏÏÏÏÏ $ 286.4 $ 433.7 Marketable securities ÏÏÏÏÏÏÏÏÏÏÏÏÏÏÏÏÏÏÏÏÏÏÏÏÏÏÏÏÏÏÏÏÏÏÏÏÏÏÏÏÏÏÏÏÏÏ 6.7 11.9 Receivables ÏÏÏÏÏÏÏÏÏÏÏÏÏÏÏÏÏÏÏÏÏÏÏÏÏÏÏÏÏÏÏÏÏÏÏÏÏÏÏÏÏÏÏÏÏÏÏÏÏÏÏÏÏÏ 3,657.0 3,443.4 InventoriesÏÏÏÏÏÏÏÏÏÏÏÏÏÏÏÏÏÏÏÏÏÏÏÏÏÏÏÏÏÏÏÏÏÏÏÏÏÏÏÏÏÏÏÏÏÏÏÏÏÏÏÏÏÏÏ 5,654.8 5,116.4 Prepaid expensesÏÏÏÏÏÏÏÏÏÏÏÏÏÏÏÏÏÏÏÏÏÏÏÏÏÏÏÏÏÏÏÏÏÏÏÏÏÏÏÏÏÏÏÏÏÏÏÏÏÏ 146.4 158.6 TotalÏÏÏÏÏÏÏÏÏÏÏÏÏÏÏÏÏÏÏÏÏÏÏÏÏÏÏÏÏÏÏÏÏÏÏÏÏÏÏÏÏÏÏÏÏÏÏÏÏÏÏÏÏÏÏÏ 9,751.3 9,164.0 Property, Plant and Equipment, net ÏÏÏÏÏÏÏÏÏÏÏÏÏÏÏÏÏÏÏÏÏÏÏÏÏÏÏÏÏÏÏÏÏÏÏÏÏÏ 579.2 595.3 Capitalized Software ÏÏÏÏÏÏÏÏÏÏÏÏÏÏÏÏÏÏÏÏÏÏÏÏÏÏÏÏÏÏÏÏÏÏÏÏÏÏÏÏÏÏÏÏÏÏÏÏÏÏ 115.8 103.7 Notes Receivable ÏÏÏÏÏÏÏÏÏÏÏÏÏÏÏÏÏÏÏÏÏÏÏÏÏÏÏÏÏÏÏÏÏÏÏÏÏÏÏÏÏÏÏÏÏÏÏÏÏÏÏÏÏ 209.1 131.3 Goodwill ÏÏÏÏÏÏÏÏÏÏÏÏÏÏÏÏÏÏÏÏÏÏÏÏÏÏÏÏÏÏÏÏÏÏÏÏÏÏÏÏÏÏÏÏÏÏÏÏÏÏÏÏÏÏÏÏÏÏÏÏ 968.8 963.3 Other Intangible Assets ÏÏÏÏÏÏÏÏÏÏÏÏÏÏÏÏÏÏÏÏÏÏÏÏÏÏÏÏÏÏÏÏÏÏÏÏÏÏÏÏÏÏÏÏÏÏÏÏ 94.7 101.1 Other Assets ÏÏÏÏÏÏÏÏÏÏÏÏÏÏÏÏÏÏÏÏÏÏÏÏÏÏÏÏÏÏÏÏÏÏÏÏÏÏÏÏÏÏÏÏÏÏÏÏÏÏÏÏÏÏÏÏÏ 479.2 471.2 Total Assets ÏÏÏÏÏÏÏÏÏÏÏÏÏÏÏÏÏÏÏÏÏÏÏÏÏÏÏÏÏÏÏÏÏÏÏÏÏÏÏÏÏÏÏÏÏÏÏÏÏ $12,198.1 $11,529.9 LIABILITIES AND STOCKHOLDERS' EQUITY Current Liabilities Drafts and accounts payable ÏÏÏÏÏÏÏÏÏÏÏÏÏÏÏÏÏÏÏÏÏÏÏÏÏÏÏÏÏÏÏÏÏÏÏÏÏÏÏÏ $ 5,961.7 $ 5,361.9 Deferred revenue ÏÏÏÏÏÏÏÏÏÏÏÏÏÏÏÏÏÏÏÏÏÏÏÏÏÏÏÏÏÏÏÏÏÏÏÏÏÏÏÏÏÏÏÏÏÏÏÏÏ 297.0 378.5 Current portion of long-term debt ÏÏÏÏÏÏÏÏÏÏÏÏÏÏÏÏÏÏÏÏÏÏÏÏÏÏÏÏÏÏÏÏÏÏÏ 192.8 194.1 Other liabilities ÏÏÏÏÏÏÏÏÏÏÏÏÏÏÏÏÏÏÏÏÏÏÏÏÏÏÏÏÏÏÏÏÏÏÏÏÏÏÏÏÏÏÏÏÏÏÏÏÏÏÏ 574.1 615.2 TotalÏÏÏÏÏÏÏÏÏÏÏÏÏÏÏÏÏÏÏÏÏÏÏÏÏÏÏÏÏÏÏÏÏÏÏÏÏÏÏÏÏÏÏÏÏÏÏÏÏÏÏÏÏÏÏÏ 7,025.6 6,549.7 Postretirement Obligations and Other Noncurrent Liabilities ÏÏÏÏÏÏÏÏÏÏÏÏÏÏÏÏÏ 268.3 255.8 Long-Term Debt ÏÏÏÏÏÏÏÏÏÏÏÏÏÏÏÏÏÏÏÏÏÏÏÏÏÏÏÏÏÏÏÏÏÏÏÏÏÏÏÏÏÏÏÏÏÏÏÏÏÏÏÏÏ 1,024.0 1,035.6 McKesson Corporation-Obligated Mandatorily Redeemable Convertible Preferred Securities of Subsidiary Grantor Trust Whose Sole Assets are Junior Subordinated Debentures of McKesson Corporation ÏÏÏÏÏÏÏÏÏÏÏÏÏÏÏÏ 196.0 195.9 Other Commitments and Contingent Liabilities Stockholders' Equity Common stock (400.0 shares authorized, 287.1 issued as of September 30, 2001, and 286.3 issued as of March 31, 2001; par value $0.01) ÏÏÏÏÏÏÏÏÏ 2.9 2.9 Additional paid-in capital ÏÏÏÏÏÏÏÏÏÏÏÏÏÏÏÏÏÏÏÏÏÏÏÏÏÏÏÏÏÏÏÏÏÏÏÏÏÏÏÏÏÏ 1,825.4 1,828.7 Other capital ÏÏÏÏÏÏÏÏÏÏÏÏÏÏÏÏÏÏÏÏÏÏÏÏÏÏÏÏÏÏÏÏÏÏÏÏÏÏÏÏÏÏÏÏÏÏÏÏÏÏÏÏÏ (102.9) (108.4) Retained earnings ÏÏÏÏÏÏÏÏÏÏÏÏÏÏÏÏÏÏÏÏÏÏÏÏÏÏÏÏÏÏÏÏÏÏÏÏÏÏÏÏÏÏÏÏÏÏÏÏÏ 2,157.1 2,006.6 Accumulated other comprehensive losses ÏÏÏÏÏÏÏÏÏÏÏÏÏÏÏÏÏÏÏÏÏÏÏÏÏÏÏÏÏ (82.8) (75.0) ESOP notes and guarantees ÏÏÏÏÏÏÏÏÏÏÏÏÏÏÏÏÏÏÏÏÏÏÏÏÏÏÏÏÏÏÏÏÏÏÏÏÏÏÏÏ (80.1) (89.0) Treasury shares, at cost ÏÏÏÏÏÏÏÏÏÏÏÏÏÏÏÏÏÏÏÏÏÏÏÏÏÏÏÏÏÏÏÏÏÏÏÏÏÏÏÏÏÏÏÏ (35.4) (72.9) Total Stockholders' Equity ÏÏÏÏÏÏÏÏÏÏÏÏÏÏÏÏÏÏÏÏÏÏÏÏÏÏÏÏÏÏÏÏÏÏÏÏÏ 3,684.2 3,492.9 Total Liabilities and Stockholders' EquityÏÏÏÏÏÏÏÏÏÏÏÏÏÏÏÏÏÏÏÏÏÏÏÏÏ $12,198.1 $11,529.9 See Financial Notes. 2
  • 4. McKESSON CORPORATION CONSOLIDATED STATEMENTS OF OPERATIONS (Unaudited) Three Months Ended Six Months Ended September 30, September 30, 2001 2000 2001 2000 (In millions, except per share amounts) RevenuesÏÏÏÏÏÏÏÏÏÏÏÏÏÏÏÏÏÏÏÏÏÏÏÏÏÏÏÏÏÏÏÏÏÏÏÏÏÏÏÏÏ $12,159.3 $9,865.5 $23,813.2 $19,583.1 Cost of Sales ÏÏÏÏÏÏÏÏÏÏÏÏÏÏÏÏÏÏÏÏÏÏÏÏÏÏÏÏÏÏÏÏÏÏÏÏÏ 11,491.5 9,294.1 22,485.7 18,444.8 Gross ProÑtÏÏÏÏÏÏÏÏÏÏÏÏÏÏÏÏÏÏÏÏÏÏÏÏÏÏÏÏÏÏÏÏÏÏÏÏÏÏÏ 667.8 571.4 1,327.5 1,138.3 Selling, Distribution, Research and Development and Administration ExpensesÏÏÏÏÏÏÏÏÏÏÏÏÏÏÏÏÏÏÏÏÏÏÏÏÏÏ 520.1 454.4 1,020.6 898.0 Operating Income ÏÏÏÏÏÏÏÏÏÏÏÏÏÏÏÏÏÏÏÏÏÏÏÏÏÏÏÏÏÏÏÏÏ 147.7 117.0 306.9 240.3 Interest ExpenseÏÏÏÏÏÏÏÏÏÏÏÏÏÏÏÏÏÏÏÏÏÏÏÏÏÏÏÏÏÏÏÏÏÏÏ (27.0) (28.7) (54.0) (56.1) Loss on Sales of Businesses, Net ÏÏÏÏÏÏÏÏÏÏÏÏÏÏÏÏÏÏÏÏÏ Ì Ì (18.4) Ì Gain (Loss) on InvestmentsÏÏÏÏÏÏÏÏÏÏÏÏÏÏÏÏÏÏÏÏÏÏÏÏÏ (3.4) 7.8 (5.7) 7.8 Other Income, Net ÏÏÏÏÏÏÏÏÏÏÏÏÏÏÏÏÏÏÏÏÏÏÏÏÏÏÏÏÏÏÏÏ 9.6 9.3 19.2 20.2 Income Before Income Taxes and Dividends on Preferred Securities of Subsidiary TrustÏÏÏÏÏÏÏÏÏÏÏÏÏÏÏÏÏÏÏÏÏÏ 126.9 105.4 248.0 212.2 Income Taxes ÏÏÏÏÏÏÏÏÏÏÏÏÏÏÏÏÏÏÏÏÏÏÏÏÏÏÏÏÏÏÏÏÏÏÏÏÏ (46.3) (41.9) (60.5) (83.6) Dividends on Preferred Securities of Subsidiary Trust ÏÏÏ (1.6) (1.6) (3.1) (3.1) Net Income ÏÏÏÏÏÏÏÏÏÏÏÏÏÏÏÏÏÏÏÏÏÏÏÏÏÏÏÏÏÏÏÏÏÏÏÏÏÏ $ 79.0 $ 61.9 $ 184.4 $ 125.5 Earnings per Common Share Diluted ÏÏÏÏÏÏÏÏÏÏÏÏÏÏÏÏÏÏÏÏÏÏÏÏÏÏÏÏÏÏÏÏÏÏÏÏÏÏ $ 0.27 $ 0.22 $ 0.63 $ 0.44 Basic ÏÏÏÏÏÏÏÏÏÏÏÏÏÏÏÏÏÏÏÏÏÏÏÏÏÏÏÏÏÏÏÏÏÏÏÏÏÏÏÏ 0.28 0.22 0.65 0.44 Dividends per Common Share ÏÏÏÏÏÏÏÏÏÏÏÏÏÏÏÏÏÏÏÏÏÏÏ 0.06 0.06 0.12 0.12 Shares on which earnings per common share were based Diluted ÏÏÏÏÏÏÏÏÏÏÏÏÏÏÏÏÏÏÏÏÏÏÏÏÏÏÏÏÏÏÏÏÏÏÏÏÏÏ 299.0 292.0 297.5 290.7 Basic ÏÏÏÏÏÏÏÏÏÏÏÏÏÏÏÏÏÏÏÏÏÏÏÏÏÏÏÏÏÏÏÏÏÏÏÏÏÏÏÏ 285.0 283.0 284.5 282.8 See Financial Notes. 3
  • 5. McKESSON CORPORATION CONSOLIDATED STATEMENTS OF CASH FLOWS (Unaudited) Six Months Ended September 30, 2001 2000 (In millions) Operating Activities Net income ÏÏÏÏÏÏÏÏÏÏÏÏÏÏÏÏÏÏÏÏÏÏÏÏÏÏÏÏÏÏÏÏÏÏÏÏÏÏÏÏÏÏÏÏÏÏÏÏÏÏÏÏÏÏÏÏÏÏÏÏÏ $ 184.4 $ 125.5 Adjustments to reconcile to net cash provided (used) by operating activities Depreciation ÏÏÏÏÏÏÏÏÏÏÏÏÏÏÏÏÏÏÏÏÏÏÏÏÏÏÏÏÏÏÏÏÏÏÏÏÏÏÏÏÏÏÏÏÏÏÏÏÏÏÏÏÏÏÏÏÏÏ 58.8 56.1 AmortizationÏÏÏÏÏÏÏÏÏÏÏÏÏÏÏÏÏÏÏÏÏÏÏÏÏÏÏÏÏÏÏÏÏÏÏÏÏÏÏÏÏÏÏÏÏÏÏÏÏÏÏÏÏÏÏÏÏÏ 44.5 60.4 Provision for bad debts ÏÏÏÏÏÏÏÏÏÏÏÏÏÏÏÏÏÏÏÏÏÏÏÏÏÏÏÏÏÏÏÏÏÏÏÏÏÏÏÏÏÏÏÏÏÏÏÏÏ 28.3 22.7 Deferred taxes on income ÏÏÏÏÏÏÏÏÏÏÏÏÏÏÏÏÏÏÏÏÏÏÏÏÏÏÏÏÏÏÏÏÏÏÏÏÏÏÏÏÏÏÏÏÏÏÏ 24.7 9.3 Loss on sale of businesses ÏÏÏÏÏÏÏÏÏÏÏÏÏÏÏÏÏÏÏÏÏÏÏÏÏÏÏÏÏÏÏÏÏÏÏÏÏÏÏÏÏÏÏÏÏÏÏ 18.4 Ì Other non-cash items ÏÏÏÏÏÏÏÏÏÏÏÏÏÏÏÏÏÏÏÏÏÏÏÏÏÏÏÏÏÏÏÏÏÏÏÏÏÏÏÏÏÏÏÏÏÏÏÏÏÏ 37.6 (3.3) Total ÏÏÏÏÏÏÏÏÏÏÏÏÏÏÏÏÏÏÏÏÏÏÏÏÏÏÏÏÏÏÏÏÏÏÏÏÏÏÏÏÏÏÏÏÏÏÏÏÏÏÏÏÏÏÏÏÏÏÏÏÏÏ 396.7 270.7 EÅects of changes in: Receivables ÏÏÏÏÏÏÏÏÏÏÏÏÏÏÏÏÏÏÏÏÏÏÏÏÏÏÏÏÏÏÏÏÏÏÏÏÏÏÏÏÏÏÏÏÏÏÏÏÏÏÏÏÏÏÏÏÏÏÏ (376.9) (236.1) Inventories ÏÏÏÏÏÏÏÏÏÏÏÏÏÏÏÏÏÏÏÏÏÏÏÏÏÏÏÏÏÏÏÏÏÏÏÏÏÏÏÏÏÏÏÏÏÏÏÏÏÏÏÏÏÏÏÏÏÏÏ (543.0) (325.4) Drafts and accounts payable ÏÏÏÏÏÏÏÏÏÏÏÏÏÏÏÏÏÏÏÏÏÏÏÏÏÏÏÏÏÏÏÏÏÏÏÏÏÏÏÏÏÏÏÏÏ 599.9 470.0 Deferred revenue ÏÏÏÏÏÏÏÏÏÏÏÏÏÏÏÏÏÏÏÏÏÏÏÏÏÏÏÏÏÏÏÏÏÏÏÏÏÏÏÏÏÏÏÏÏÏÏÏÏÏÏÏÏÏ (77.5) (71.8) Taxes ÏÏÏÏÏÏÏÏÏÏÏÏÏÏÏÏÏÏÏÏÏÏÏÏÏÏÏÏÏÏÏÏÏÏÏÏÏÏÏÏÏÏÏÏÏÏÏÏÏÏÏÏÏÏÏÏÏÏÏÏÏÏÏÏ 29.1 (233.6) Other ÏÏÏÏÏÏÏÏÏÏÏÏÏÏÏÏÏÏÏÏÏÏÏÏÏÏÏÏÏÏÏÏÏÏÏÏÏÏÏÏÏÏÏÏÏÏÏÏÏÏÏÏÏÏÏÏÏÏÏÏÏÏÏÏ (24.4) (33.2) Total ÏÏÏÏÏÏÏÏÏÏÏÏÏÏÏÏÏÏÏÏÏÏÏÏÏÏÏÏÏÏÏÏÏÏÏÏÏÏÏÏÏÏÏÏÏÏÏÏÏÏÏÏÏÏÏÏÏÏÏÏÏÏ (392.8) (430.1) Net cash provided (used) by continuing operations ÏÏÏÏÏÏÏÏÏÏÏÏÏÏÏÏÏÏÏÏÏÏÏ 3.9 (159.4) Discontinued operations ÏÏÏÏÏÏÏÏÏÏÏÏÏÏÏÏÏÏÏÏÏÏÏÏÏÏÏÏÏÏÏÏÏÏÏÏÏÏÏÏÏÏÏÏÏÏÏÏÏÏ (0.3) (1.1) Net cash provided (used) by operating activitiesÏÏÏÏÏÏÏÏÏÏÏÏÏÏÏÏÏÏÏÏÏÏÏÏÏÏ 3.6 (160.5) Investing Activities Maturities of marketable securities, net ÏÏÏÏÏÏÏÏÏÏÏÏÏÏÏÏÏÏÏÏÏÏÏÏÏÏÏÏÏÏÏÏÏÏÏÏÏ 4.8 Ì Property acquisitions ÏÏÏÏÏÏÏÏÏÏÏÏÏÏÏÏÏÏÏÏÏÏÏÏÏÏÏÏÏÏÏÏÏÏÏÏÏÏÏÏÏÏÏÏÏÏÏÏÏÏÏÏÏ (43.1) (59.6) Acquisitions of businesses, less cash and short-term investments acquiredÏÏÏÏÏÏÏÏÏ (7.4) (39.8) Notes receivable issuances, net ÏÏÏÏÏÏÏÏÏÏÏÏÏÏÏÏÏÏÏÏÏÏÏÏÏÏÏÏÏÏÏÏÏÏÏÏÏÏÏÏÏÏÏÏ (30.0) (10.3) Other ÏÏÏÏÏÏÏÏÏÏÏÏÏÏÏÏÏÏÏÏÏÏÏÏÏÏÏÏÏÏÏÏÏÏÏÏÏÏÏÏÏÏÏÏÏÏÏÏÏÏÏÏÏÏÏÏÏÏÏÏÏÏÏÏÏÏ (58.3) (43.9) Net cash used by investing activities ÏÏÏÏÏÏÏÏÏÏÏÏÏÏÏÏÏÏÏÏÏÏÏÏÏÏÏÏÏÏÏÏÏÏÏÏ (134.0) (153.6) Financing Activities Proceeds from issuance of debt ÏÏÏÏÏÏÏÏÏÏÏÏÏÏÏÏÏÏÏÏÏÏÏÏÏÏÏÏÏÏÏÏÏÏÏÏÏÏÏÏÏÏÏÏ 4.2 2.0 Repayment of debt ÏÏÏÏÏÏÏÏÏÏÏÏÏÏÏÏÏÏÏÏÏÏÏÏÏÏÏÏÏÏÏÏÏÏÏÏÏÏÏÏÏÏÏÏÏÏÏÏÏÏÏÏÏÏ (17.0) (20.6) Dividends paid on preferred securities of subsidiary trust ÏÏÏÏÏÏÏÏÏÏÏÏÏÏÏÏÏÏÏÏÏÏÏ (5.0) (5.0) Capital stock transactions Issuances ÏÏÏÏÏÏÏÏÏÏÏÏÏÏÏÏÏÏÏÏÏÏÏÏÏÏÏÏÏÏÏÏÏÏÏÏÏÏÏÏÏÏÏÏÏÏÏÏÏÏÏÏÏÏÏÏÏÏÏÏÏ 41.4 20.0 Share repurchases ÏÏÏÏÏÏÏÏÏÏÏÏÏÏÏÏÏÏÏÏÏÏÏÏÏÏÏÏÏÏÏÏÏÏÏÏÏÏÏÏÏÏÏÏÏÏÏÏÏÏÏÏÏ (15.1) (25.5) Dividends paid ÏÏÏÏÏÏÏÏÏÏÏÏÏÏÏÏÏÏÏÏÏÏÏÏÏÏÏÏÏÏÏÏÏÏÏÏÏÏÏÏÏÏÏÏÏÏÏÏÏÏÏÏÏÏÏÏ (34.3) (34.2) ESOP notes and guarantees ÏÏÏÏÏÏÏÏÏÏÏÏÏÏÏÏÏÏÏÏÏÏÏÏÏÏÏÏÏÏÏÏÏÏÏÏÏÏÏÏÏÏÏÏÏ 8.9 3.2 Other ÏÏÏÏÏÏÏÏÏÏÏÏÏÏÏÏÏÏÏÏÏÏÏÏÏÏÏÏÏÏÏÏÏÏÏÏÏÏÏÏÏÏÏÏÏÏÏÏÏÏÏÏÏÏÏÏÏÏÏÏÏÏÏÏ Ì 1.7 Net cash used by Ñnancing activitiesÏÏÏÏÏÏÏÏÏÏÏÏÏÏÏÏÏÏÏÏÏÏÏÏÏÏÏÏÏÏÏÏÏÏÏÏ (16.9) (58.4) Net decrease in Cash and Equivalents ÏÏÏÏÏÏÏÏÏÏÏÏÏÏÏÏÏÏÏÏÏÏÏÏÏÏÏÏÏÏÏÏÏÏÏÏÏÏÏÏ (147.3) (372.5) Cash and Equivalents at beginning of period ÏÏÏÏÏÏÏÏÏÏÏÏÏÏÏÏÏÏÏÏÏÏÏÏÏÏÏÏÏÏÏÏÏÏÏ 433.7 548.9 Cash and Equivalents at end of period ÏÏÏÏÏÏÏÏÏÏÏÏÏÏÏÏÏÏÏÏÏÏÏÏÏÏÏÏÏÏÏÏÏÏÏÏÏÏÏÏ $ 286.4 $ 176.4 See Financial Notes. 4
  • 6. McKESSON CORPORATION FINANCIAL NOTES (Unaudited) 1. Interim Financial Statements In our opinion, these unaudited condensed consolidated Ñnancial statements include all adjustments necessary for a fair presentation of the Company's Ñnancial position as of September 30, 2001, the results of operations for the three and six months ended September 30, 2001 and 2000 and cash Öows for the six months ended September 30, 2001 and 2000. The results of operations for the three and six months ended September 30, 2001 and 2000 are not necessarily indicative of the results for the full years. These interim Ñnancial statements should be read in conjunction with the annual audited Ñnancial statements, accounting policies and Ñnancial notes included in our Ñscal 2001 consolidated Ñnancial statements previously Ñled with the Securities and Exchange Commission (the quot;quot;SEC''). Certain prior year amounts have been reclassiÑed to conform to the current year presentation. 2. New Accounting Pronouncements On April 1, 2001, we adopted Statement of Financial Accounting Standards (quot;quot;SFAS'') No. 133, quot;quot;Accounting for Derivative Instruments and Hedging Activities,'' as amended in June 2000 by SFAS No. 138, quot;quot;Accounting for Certain Derivative Instruments and Certain Hedging Activities,'' which established accounting and reporting standards for derivative instruments and for hedging activities. These statements require that we recognize all derivatives as either assets or liabilities in the statement of Ñnancial position and measure these instruments at fair value. We have identiÑed a cross-currency interest rate swap related to U.S. dollar-denominated debt securities issued by a Canadian subsidiary as a derivative instrument. The swap, which has been designated as a cash Öow hedge in accordance with criteria established by SFAS No. 133, has a notional amount of $125.0 million and a fair value of $17.4 million at September 30, 2001. SFAS No. 133 further provides that for a derivative designated as a cash Öow hedge, the eÅective portion of the derivative's gain or loss is initially reported as a component of other comprehensive income and subsequently reclassiÑed into earnings when the hedged exposure aÅects earnings. No ineÅectiveness was recognized in the the quarter and six months ended September 30, 2001 related to the cross-currency interest rate swap. The fair value of this instrument has been classiÑed as quot;quot;Other Assets'' in the accompanying balance sheet. We do not have any other signiÑcant derivatives as of September 30, 2001. In June 2001, the Financial Accounting Standards Board (quot;quot;FASB'') issued SFAS No. 141, quot;quot;Business Combinations,'' which eliminates the pooling method of accounting for all business combinations initiated after June 30, 2001 and addresses the initial recognition and measurement of goodwill and other intangible assets acquired in a business combination. We adopted this accounting standard for business combinations initiated after June 30, 2001. As of April 1, 2001, we adopted SFAS No. 142, quot;quot;Goodwill and Other Intangible Assets,'' which addresses the Ñnancial accounting and reporting standards for the acquisition of intangible assets outside of a business combination and for goodwill and other intangible assets subsequent to their acquisition. This accounting standard requires that goodwill be separately disclosed from other intangible assets in the statement of Ñnancial position, and no longer be amortized but tested for impairment on a periodic basis. 5
  • 7. McKESSON CORPORATION FINANCIAL NOTES Ì (Continued) (Unaudited) In accordance with SFAS No. 142, we discontinued the amortization of goodwill eÅective April 1, 2001. A reconciliation of previously reported net income and earnings per share to the amounts adjusted for the exclusion of goodwill amortization net of the related income tax eÅect follows: Three Months Ended Six Months Ended September 30, September 30, 2001 2000 2001 2000 (In millions, except per share amounts) Reported net income ÏÏÏÏÏÏÏÏÏÏÏÏÏÏÏÏÏÏÏÏÏÏÏÏÏÏÏÏÏÏÏÏÏÏÏÏÏÏÏÏÏÏ $79.0 $61.9 $184.4 $125.5 Goodwill amortization, net of taxÏÏÏÏÏÏÏÏÏÏÏÏÏÏÏÏÏÏÏÏÏÏÏÏÏÏÏÏÏÏÏÏ Ì 11.6 Ì 22.0 Adjusted net income ÏÏÏÏÏÏÏÏÏÏÏÏÏÏÏÏÏÏÏÏÏÏÏÏÏÏÏÏÏÏÏÏÏÏÏÏÏÏÏÏÏÏ $79.0 $73.5 $184.4 $147.5 Diluted earnings per common share Reported net income ÏÏÏÏÏÏÏÏÏÏÏÏÏÏÏÏÏÏÏÏÏÏÏÏÏÏÏÏÏÏÏÏÏÏÏÏÏÏ $0.27 $0.22 $ 0.63 $ 0.44 Goodwill amortization, net of taxÏÏÏÏÏÏÏÏÏÏÏÏÏÏÏÏÏÏÏÏÏÏÏÏÏÏÏÏ Ì 0.04 Ì 0.08 Adjusted net income ÏÏÏÏÏÏÏÏÏÏÏÏÏÏÏÏÏÏÏÏÏÏÏÏÏÏÏÏÏÏÏÏÏÏÏÏÏÏ $0.27 $0.26 $ 0.63 $ 0.52 Basic earnings per common share Reported net income ÏÏÏÏÏÏÏÏÏÏÏÏÏÏÏÏÏÏÏÏÏÏÏÏÏÏÏÏÏÏÏÏÏÏÏÏÏÏ $0.28 $0.22 $ 0.65 $ 0.44 Goodwill amortization, net of taxÏÏÏÏÏÏÏÏÏÏÏÏÏÏÏÏÏÏÏÏÏÏÏÏÏÏÏÏ Ì 0.04 Ì 0.08 Adjusted net income ÏÏÏÏÏÏÏÏÏÏÏÏÏÏÏÏÏÏÏÏÏÏÏÏÏÏÏÏÏÏÏÏÏÏÏÏÏÏ $0.28 $0.26 $ 0.65 $ 0.52 The provisions of SFAS No. 142 also require the completion of a transitional impairment test within six months of adoption, with any impairments treated as a cumulative eÅect of a change in accounting principle. During the quarter ended September 30, 2001, we completed the transitional impairment test and did not record any impairments of goodwill. In August 2001, the FASB issued SFAS No. 144, quot;quot;Accounting for the Impairment or Disposal of Long- Lived Assets,'' which addresses the Ñnancial accounting and reporting for the impairment or disposal of long- lived assets. This statement supercedes SFAS No. 121, quot;quot;Accounting for the Impairment of Long-Lived Assets and Long-Lived Assets to Be Disposed Of'' and will be eÅective on April 1, 2002. We are assessing the impact, if any, SFAS No. 144 will have on our consolidated Ñnancial statements. 3. Divestitures In June 2001, we sold the stock of an Information Solutions business which provided internet-based clinical applications for use by physician practices, pharmacy beneÑt managers, beneÑt payors, laboratories and pharmacies for a pre-tax gain of $0.2 million and a net tax beneÑt of $30.0 million, resulting in an after-tax gain of $30.2 million. For accounting purposes, the net assets of this business were written down in Ñscal 2001 in connection with the restructuring of the former iMcKesson business segment. The tax beneÑt could not be recognized until Ñscal 2002, when the sale of the stock was completed. In July 2001, we completed the sale of the net assets of another Information Solutions business that provided managed care systems for the payor market. We recognized a pre-tax loss of $18.6 million, or an after-tax loss of $11.8 million on this sale in the Ñrst quarter. 6
  • 8. McKESSON CORPORATION FINANCIAL NOTES Ì (Continued) (Unaudited) 4. Marketable Securities The September 30, 2001 marketable securities balance includes $4.0 million held in trust as exchange property for our outstanding $6.5 million principal amount of 4.5% exchangeable subordinated debentures. 5. Goodwill and Other Intangible Assets Changes in the carrying amount of goodwill for the six months ended September 30, 2001, by operating segment, are as follows: Supply Information Solutions Solutions Total (In millions) Balance, March 31, 2001 ÏÏÏÏÏÏÏÏÏÏÏÏÏÏÏÏÏÏÏÏÏÏÏÏÏÏÏÏÏÏÏÏÏ $934.5 $28.8 $963.3 Goodwill acquired during the period ÏÏÏÏÏÏÏÏÏÏÏÏÏÏÏÏÏÏÏÏÏÏÏÏ 2.9 Ì 2.9 Translation adjustments and other ÏÏÏÏÏÏÏÏÏÏÏÏÏÏÏÏÏÏÏÏÏÏÏÏÏÏ 2.8 (0.2) 2.6 Balance, September 30, 2001 ÏÏÏÏÏÏÏÏÏÏÏÏÏÏÏÏÏÏÏÏÏÏÏÏÏÏÏÏÏÏ $940.2 $28.6 $968.8 Information regarding our other intangible assets follows: September 30, 2001 March 31, 2001 Carrying Accumulated Carrying Accumulated Amount Amortization Net Amount Amortization Net (In millions) Customer lists ÏÏÏÏÏÏÏÏÏÏÏÏÏÏÏÏÏÏÏÏÏÏ $ 83.9 $(35.7) $48.2 $ 80.8 $(31.1) $ 49.7 Technology ÏÏÏÏÏÏÏÏÏÏÏÏÏÏÏÏÏÏÏÏÏÏÏÏ 43.0 (13.2) 29.8 48.0 (12.9) 35.1 Trademarks ÏÏÏÏÏÏÏÏÏÏÏÏÏÏÏÏÏÏÏÏÏÏÏÏ 13.3 (1.0) 12.3 13.3 (0.8) 12.5 Other ÏÏÏÏÏÏÏÏÏÏÏÏÏÏÏÏÏÏÏÏÏÏÏÏÏÏÏÏÏ 8.4 (4.0) 4.4 7.8 (4.0) 3.8 Total ÏÏÏÏÏÏÏÏÏÏÏÏÏÏÏÏÏÏÏÏÏÏÏÏÏ $148.6 $(53.9) $94.7 $149.9 $(48.8) $101.1 Amortization expense of other intangible assets was $3.6 million and $4.2 million in the three months and $7.1 million and $8.3 million in the six months ended September 30, 2001 and 2000. 6. Current Liabilities Drafts and accounts payable includes drafts outstanding of $667.0 million as of September 30, 2001 and $758.6 million as of March 31, 2001. Our other current liabilities are as follows: September 30, March 31, 2001 2001 (In millions) Salaries and wages ÏÏÏÏÏÏÏÏÏÏÏÏÏÏÏÏÏÏÏÏÏÏÏÏÏÏÏÏÏÏÏÏÏÏÏÏÏÏÏÏÏÏÏÏÏ $115.0 $142.2 Taxes ÏÏÏÏÏÏÏÏÏÏÏÏÏÏÏÏÏÏÏÏÏÏÏÏÏÏÏÏÏÏÏÏÏÏÏÏÏÏÏÏÏÏÏÏÏÏÏÏÏÏÏÏÏÏÏÏ 51.0 79.8 Interest and dividends ÏÏÏÏÏÏÏÏÏÏÏÏÏÏÏÏÏÏÏÏÏÏÏÏÏÏÏÏÏÏÏÏÏÏÏÏÏÏÏÏÏÏ 30.7 31.0 Other ÏÏÏÏÏÏÏÏÏÏÏÏÏÏÏÏÏÏÏÏÏÏÏÏÏÏÏÏÏÏÏÏÏÏÏÏÏÏÏÏÏÏÏÏÏÏÏÏÏÏÏÏÏÏÏÏ 377.4 362.2 Total ÏÏÏÏÏÏÏÏÏÏÏÏÏÏÏÏÏÏÏÏÏÏÏÏÏÏÏÏÏÏÏÏÏÏÏÏÏÏÏÏÏÏÏÏÏÏÏÏÏÏÏÏÏÏ $574.1 $615.2 7
  • 9. McKESSON CORPORATION FINANCIAL NOTES Ì (Continued) (Unaudited) 7. Convertible Preferred Securities In February 1997, a wholly-owned subsidiary trust of McKesson Corporation issued 4 million shares of preferred securities to the public and 123,720 common securities to McKesson Corporation, which are convertible at the holder's option into our common stock. The proceeds of such issuances were invested by the trust in $206,186,000 aggregate principal amount of our 5% Convertible Junior Subordinated Debentures due in 2027 (the quot;quot;Debentures''). The Debentures represent the sole assets of the trust. The Debentures mature on June 1, 2027, bear interest at the rate of 5%, payable quarterly, and are redeemable beginning in March 2001 at 103.0% of the principal amount thereof. Holders of the securities are entitled to cumulative cash distributions at an annual rate of 5% of the liquidation amount of $50 per security. Each preferred security is convertible at the rate of 1.3418 shares of McKesson Corporation common stock, subject to adjustment in certain circumstances. If not converted, the preferred securities will be redeemed upon repayment of the Debentures, and are callable at 103.0% of the liquidation amount. We have guaranteed, on a subordinated basis, distributions and other payments due on the preferred securities (the quot;quot;Guarantee''). The Guarantee, when taken together with our obligations under the Deben- tures, and in the indenture pursuant to which the Debentures were issued, and our obligations under the Amended and Restated Declaration of Trust governing the subsidiary trust, provides a full and unconditional guarantee of amounts due on the preferred securities. The Debentures and related trust investment in the Debentures have been eliminated in consolidation and the preferred securities are reÖected as outstanding in the accompanying consolidated Ñnancial statements. 8. Gains, Losses and Charges To Net Income During the quarter ended September 30, 2001, our Supply Solutions segment recorded asset impairment charges of $4.8 million for product rationalizations in the medical-surgical business, partially oÅset by proceeds of $2.8 million from the settlements of claims with third parties in the medical-surgical and medical management businesses. Also, during the current quarter, our Information Solutions segment recorded proceeds of $1.0 million from the settlement of a claim related to purchased software for which we had recorded an impairment charge of $3.2 million in the quarter ended June 30, 2001. In the six months ended September 30, 2001, we sold two Information Solutions businesses for a pre-tax loss of $18.4 million, or an after-tax gain of $18.4 million. In the Corporate segment, we recorded a loss on equity investments of $3.4 million in the quarter and $5.7 million in the six months and costs associated with the pending securities litigation of $0.9 million in the quarter and $1.5 million in the six months ended September 30, 2001. These charges were partially oÅset in the quarter by the receipt of $0.9 million in settlement proceeds from an investment that was written oÅ in prior years. During the quarter and six months ended September 30, 2000, our Supply Solutions segment recorded a $7.8 million gain on the liquidation of an investment. This was partially oÅset by a charge of $2.1 million for the write-oÅ of purchased in-process technology related to the July 2000 acquisition of an Information Solutions business. We also incurred $0.7 million in legal fees related to the Accounting Litigation (see Financial Note 12) in the Corporate segment. 8
  • 10. McKESSON CORPORATION FINANCIAL NOTES Ì (Continued) (Unaudited) 9. Restructuring and Related Asset Impairments We recorded the following charges and adjustments for restructuring and related asset impairments in the quarter and six months ended September 30, 2001 and 2000: Three Months Six Months Ended Ended September 30, September 30, 2001 2000 2001 2000 (In millions) Asset impairments ÏÏÏÏÏÏÏÏÏÏÏÏÏÏÏÏÏÏÏÏÏÏÏÏÏÏÏÏÏÏÏÏÏÏÏÏÏÏÏÏ $ 0.5 $Ì $ 3.4 $Ì Severance ÏÏÏÏÏÏÏÏÏÏÏÏÏÏÏÏÏÏÏÏÏÏÏÏÏÏÏÏÏÏÏÏÏÏÏÏÏÏÏÏÏÏÏÏÏÏÏ 6.7 2.6 5.2 2.6 Exit-related ÏÏÏÏÏÏÏÏÏÏÏÏÏÏÏÏÏÏÏÏÏÏÏÏÏÏÏÏÏÏÏÏÏÏÏÏÏÏÏÏÏÏÏÏÏÏ 14.0 0.2 11.7 0.2 $21.2 $2.8 $20.3 $2.8 A reconciliation of the reserves for the restructuring plans from March 31, 2001 to September 30, 2001, by operating segment follows: Information Supply Solutions Solutions Corporate Exit- Exit- Exit- Severance Related Severance Related Severance Related Total (In millions) Balance, March 31, 2001 ÏÏÏÏÏÏÏÏÏ $10.0 $ 7.5 $ 3.5 $ 9.0 $24.7 $ 0.3 $55.0 Charges incurred during the period 10.0 14.0 Ì Ì Ì Ì 24.0 Severance amounts paid during the period ÏÏÏÏÏÏÏÏÏÏÏÏÏÏÏÏÏÏÏÏÏÏÏ (3.3) Ì (1.0) Ì (4.6) Ì (8.9) Adjustments ÏÏÏÏÏÏÏÏÏÏÏÏÏÏÏÏÏÏÏÏ (2.0) (2.3) Ì Ì (2.8) Ì (7.1) Other costs paid during the period Ì (1.9) Ì (0.9) Ì (0.2) (3.0) Balance, September 30, 2001 ÏÏÏÏÏÏ $14.7 $17.3 $ 2.5 $ 8.1 $17.3 $ 0.1 $60.0 The remaining balances at September 30, 2001 relate primarily to charges recorded in Ñscal 2002 and Ñscal 2001. The reserves for other exit-related items consist of costs for preparing facilities for disposal, lease costs and property taxes required subsequent to termination of operations. During the quarter ended September 30, 2001, we reviewed the operations and cost structure of, and developed and communicated a plan to close 23 distribution centers in, the medical-surgical business. In connection with this plan, we recorded asset impairment charges of $0.3 million, severance charges of $10.0 million relating to the termination of approximately 650 employees primarily in distribution center, delivery and associated back-oÇce functions and exit-related charges of $14.0 million for costs to prepare facilities for disposal, lease costs and property taxes required subsequent to termination of operations. We paid $0.4 million in severance to 12 of these employees and $0.5 million in exit-related costs during the quarter. In conjunction with restructuring plans provided for in prior Ñscal years, during the six months ended September 30, 2001, our Supply Solutions segment paid severance of $1.3 million to approximately 100 employees in the medical-surgical business, $0.7 million to 23 call center employees, and $0.4 million to 72 customer service and administrative employees in the medical management business, $0.4 million to approximately 38 customer service and administrative employees in the pharmaceutical services business and $0.1 million to terminated employees in the pharmacy management business. During the six months ended September 30, 2001, we paid $0.5 million of exit costs in connection with the distribution center closures in the medical-surgical business, $0.3 million of exit costs in connection with the call center and foreign oÇce 9
  • 11. McKESSON CORPORATION FINANCIAL NOTES Ì (Continued) (Unaudited) closures in the medical management business and $0.6 million of exit costs in connection with closure of an oÇce in the pharmaceutical services business. In connection with a reassessment of prior year restructuring plans, we reversed previously recorded severance reserves of $0.5 million in the quarter and $1.7 million in the six months in the pharmaceutical distribution business and $0.3 million in the six months ended Septem- ber 30, 2001 medical-surgical business. We also reversed $2.7 million in the medical-surgical business and recorded $0.4 million in the pharmaceutical distribution business in exit-related reserves in the six months ended September 30, 2001. Also, in connection with a reassessment of prior year restructuring plans of the pharmaceutical and medical-surgical businesses, we recorded asset impairment charges of $0.2 million in the quarter and $3.1 million in the six months. We plan to continue the previously announced back-oÇce reductions in the pharmaceutical distribution business and workforce reductions in the medical-surgical distribution business throughout Ñscal 2002. In the Information Solutions segment, $1.0 million of severance was paid in the six-month period ended September 30, 2001, to approximately 100 employees who were terminated in Ñscal 2000 and 2001 under extended payment arrangements. In addition, $0.9 million of exit costs were paid during the six months ended September 30, 2001 in this segment. In the Corporate segment, $2.8 million of previously recorded severance reserves for executives of the former iMcKesson business segment were reversed in the quarter ended September 30, 2001. Also, severance of $4.6 million was paid to 8 employees and exit-related costs of $0.2 million were paid during the six months ended September 30, 2001 in connection with restructuring plans provided for in Ñscal 2001. In the quarter ended September 30, 2000, our Supply Solutions segment recorded a severance charge of $0.5 million related to a workforce reduction in the pharmacy management business and charges of $2.1 million for severance and $0.2 million for facility closing costs related to a planned call center closure and workforce reduction in the medical management business. 10. Comprehensive Income Comprehensive income is deÑned as all changes in stockholders' equity from non-owner sources. It includes net income and amounts arising from unrecognized pension costs, unrealized gains or losses on marketable securities and investments classiÑed as available for sale which are recorded directly to stockholders' equity, net gains or losses on eÅectively hedged derivative instruments and foreign currency translation adjustments. Total comprehensive income for the three and six months ended September 30, 2001 and 2000 is as follows: Three Months Ended Six Months Ended September 30, September 30, 2001 2000 2001 2000 (In millions) Net income ÏÏÏÏÏÏÏÏÏÏÏÏÏÏÏÏÏÏÏÏÏÏÏÏÏÏÏÏÏÏÏÏÏÏÏÏÏÏÏÏÏÏÏÏÏÏÏÏÏÏ $79.0 $61.9 $184.4 $125.5 Unrealized gain (loss) on marketable securities and investments ÏÏÏÏÏ (2.6) 4.4 (5.2) (9.1) Net gain (loss) on derivative instrumentsÏÏÏÏÏÏÏÏÏÏÏÏÏÏÏÏÏÏÏÏÏÏÏÏÏ (0.9) Ì 1.3 Ì Foreign currency translation adjustments ÏÏÏÏÏÏÏÏÏÏÏÏÏÏÏÏÏÏÏÏÏÏÏÏÏ (5.9) (2.9) (3.9) (8.2) $69.6 $63.4 $176.6 $108.2 10
  • 12. McKESSON CORPORATION FINANCIAL NOTES Ì (Continued) (Unaudited) 11. Earnings Per Share The following is a reconciliation of the numerators and denominators of the basic and diluted earnings per common share computations for net income: Three Months Ended September 30, 2001 September 30, 2000 Income Shares Per Share Income Shares Per Share (In millions, except per share amounts) Basic EPS Net IncomeÏÏÏÏÏÏÏÏÏÏÏÏÏÏÏÏÏÏÏÏÏÏÏÏÏÏÏÏÏ $79.0 285.0 $0.28 $61.9 283.0 $0.22 EÅect of Dilutive Securities Options to purchase common stock ÏÏÏÏÏÏÏÏÏ Ì 8.2 Ì 3.3 Trust convertible preferred securities ÏÏÏÏÏÏÏÏ 1.6 5.4 1.6 5.4 Restricted stock ÏÏÏÏÏÏÏÏÏÏÏÏÏÏÏÏÏÏÏÏÏÏÏÏÏ Ì 0.4 Ì 0.3 Diluted EPS Net income available to common stockholders plus assumed conversions ÏÏÏÏÏÏÏÏÏÏÏÏÏÏÏ $80.6 299.0 $0.27 $63.5 292.0 $0.22 Six Months Ended September 30, 2001 September 30, 2000 Income Shares Per Share Income Shares Per Share (In millions, except per share amounts) Basic EPS Net IncomeÏÏÏÏÏÏÏÏÏÏÏÏÏÏÏÏÏÏÏÏÏÏÏÏÏÏÏÏ $184.4 284.5 $0.65 $125.5 282.8 $0.44 EÅect of Dilutive Securities Options to purchase common stock ÏÏÏÏÏÏÏÏ Ì 7.3 Ì 2.3 Trust convertible preferred securities ÏÏÏÏÏÏÏ 3.1 5.4 3.1 5.4 Restricted stock ÏÏÏÏÏÏÏÏÏÏÏÏÏÏÏÏÏÏÏÏÏÏÏÏ Ì 0.3 Ì 0.2 Diluted EPS Net income available to common stockholders plus assumed conversions ÏÏÏ $187.5 297.5 $0.63 $128.6 290.7 $0.44 12. Litigation Accounting Litigation In our annual report on Form 10-K for the Ñscal year ended March 31, 2001, and our quarterly report on Form 10-Q for the quarter ending June 30, 2001, we reported on numerous legal proceedings arising out of our announcement on April 28, 1999 regarding accounting improprieties at our subsidiary, HBO & Company (quot;quot;HBOC''). On July 25, 2001, the Georgia state court stayed all claims relating to the accounting litigation in the previously reported action, Powell v. McKesson HBOC, Inc. et al. (Case No. 1999CV-15443), pending completion of trial in the consolidated federal class actions pending in the United States District Court for the Northern District of California entitled In Re McKesson HBOC, Inc. Securities Litigation (Case No. C-99-20743-RMW) (the quot;quot;Consolidated Action''), and the only claims proceeding in Powell are plaintiÅ's claims for unpaid sales commissions. On August 22, 2001, the Georgia state court also stayed the 11
  • 13. McKESSON CORPORATION FINANCIAL NOTES Ì (Continued) (Unaudited) previously reported action Curran Partners, L.P. v. McKesson HBOC, Inc., et al., (Case No. 00 VS-010801) in favor of the Consolidated Action. On July 27, 2001, an action was Ñled in the United States District Court for the Northern District of California captioned Pacha et al., v. McKesson HBOC, Inc. et al., (No. C01-20713 PVT) (quot;quot;Pacha''). The Pacha plaintiÅs allege that they were individual shareholders of our stock on November 27, 1998, and assert that we violated Section 14(a) of the Exchange Act and SEC Rule 14a-9, and that we, aided by HBOC, breached our Ñduciary duties to plaintiÅs by issuing a joint proxy statement in connection with the McKesson- HBOC merger which allegedly contained false and misleading statements or omissions. PlaintiÅs name as defendants us, HBOC, certain current or former oÇcers or directors of our company or HBOC, Arthur Andersen and Bear Stearns. The complaint seeks unspeciÑed compensatory and punitive damages, attorneys fees and costs. The action has been assigned to the Honorable Ronald M. Whyte, the judge overseeing the Consolidated Action. On September 25, 2001, the Pacha plaintiÅs Ñled an application with the Court requesting that their action not be consolidated with the Consolidated Action. We Ñled an opposition to that application on October 3, 2001, and the matter has not yet been decided. On July 31, 2001, our demurrer to the Second Amended Complaint was overruled and our alternative motion to strike denied in the previously reported California state court action, Yurick v. McKesson HBOC, Inc., et al.,(Case No. 303857). On October 12, 2001, we Ñled a motion to dismiss the First Amended Complaint in the previously reported action, Chang v. McKesson HBOC, Inc., et al., (N.D. Cal No. C00-20030-RMW), and that motion is presently set for hearing on February 15, 2002. Our demurrers, alternative motions to strike and motions to stay or modify an existing stay, in the previously reported California Superior Court actions, The State of Oregon by and Through the Oregon Public Employees Retirement Board v. McKesson HBOC, Inc., et al., (Case No. 307619), Minnesota State Board of Investment v. McKesson HBOC, Inc., et al., (Case No. 311747) and Utah State Retirement Board v. McKesson HBOC, Inc., et al., (Case No. 311269), are all currently set for hearing on November 15, 2001. The previously reported American Healthcare Fund II L.P., et al., v. McKesson HBOC, Inc., et al., (Case No. 00-CV-1762) pending in Colorado state court and involving contract and interference with contract claims brought against us and HBOC by certain former shareholders of Access Health Inc., a company acquired by HBOC in December of 1998, has been settled and was dismissed with prejudice on October 24, 2001, and that resolution had no material impact on the Company. The previously reported investigations by the United States Attorney's OÇce and the Securities and Exchange Commission are continuing. On September 27, 2001, the Securities and Exchange Commission Ñled securities fraud charges against six former HBOC oÇcers and employees. Simultaneous with the Ñling of the Commission's civil complaints, four of the six defendants settled the claims brought against them by, among other things, consenting, without admitting or denying the allegations of the complaints, to entry of permanent injunctions against all of the alleged violations, and agreeing to pay civil penalties in various amounts. We do not believe it is feasible to predict or determine the outcome or resolution of, or to estimate the amounts of, or potential range of, loss with respect to the above mentioned proceedings. In addition, the timing of the Ñnal resolution of these proceedings is uncertain. The range of possible resolutions could include judgments against us or settlements that could require substantial payments by us, which could have a material adverse impact on our Ñnancial position, results of operations and cash Öows. 12
  • 14. McKESSON CORPORATION FINANCIAL NOTES Ì (Concluded) (Unaudited) Other Litigation On August 29, 2001, we Ñled motions for summary judgment in the previously reported matter FoxMeyer Health Corporation v. McKesson, et al., (Case No. 97 00311), pending in Texas state court. The FoxMeyer court has heard one of those motions and will hear the remaining motions on November 2, 2001. Trial is presently set in FoxMeyer for January 14, 2002. 13. Segment Information Our operating segments include Supply Solutions and Information Solutions. In evaluating Ñnancial performance, we focus on operating proÑt as a segment's measure of proÑt or loss. Operating proÑt is income before interest expense, taxes on income and allocation of certain corporate revenues and expenses. Corporate interest income has been reclassiÑed from Interest-net to the Corporate segment for all periods presented. Financial information relating to our reportable segments for the three and six months ended September 30, 2001 and 2000, and as of September 30, 2001 and March 31, 2001, is presented below: Three Months Ended Six Months Ended September 30, September 30, 2001 2000 2001 2000 (In millions) Revenues Supply Solutions ÏÏÏÏÏÏÏÏÏÏÏÏÏÏÏÏÏÏÏÏÏÏÏÏÏÏÏÏÏÏ $11,922.8 $9,644.6 $23,332.9 $19,136.5 Information Solutions ÏÏÏÏÏÏÏÏÏÏÏÏÏÏÏÏÏÏÏÏÏÏÏÏÏÏ 235.9 220.2 479.1 445.2 Corporate ÏÏÏÏÏÏÏÏÏÏÏÏÏÏÏÏÏÏÏÏÏÏÏÏÏÏÏÏÏÏÏÏÏÏÏÏ 0.6 0.7 1.2 1.4 Total ÏÏÏÏÏÏÏÏÏÏÏÏÏÏÏÏÏÏÏÏÏÏÏÏÏÏÏÏÏÏÏÏÏÏÏÏ $12,159.3 $9,865.5 $23,813.2 $19,583.1 Operating proÑt (loss) Supply Solutions ÏÏÏÏÏÏÏÏÏÏÏÏÏÏÏÏÏÏÏÏÏÏÏÏÏÏÏÏÏÏ $ 176.0 $ 159.2 $ 372.8 $ 309.6 Information Solutions ÏÏÏÏÏÏÏÏÏÏÏÏÏÏÏÏÏÏÏÏÏÏÏÏÏÏ 14.5 (0.6) 3.5 2.6 Total ÏÏÏÏÏÏÏÏÏÏÏÏÏÏÏÏÏÏÏÏÏÏÏÏÏÏÏÏÏÏÏÏÏÏÏÏ 190.5 158.6 376.3 312.2 Interest ExpenseÏÏÏÏÏÏÏÏÏÏÏÏÏÏÏÏÏÏÏÏÏÏÏÏÏÏÏÏÏÏÏ (27.0) (28.7) (54.0) (56.1) Corporate ÏÏÏÏÏÏÏÏÏÏÏÏÏÏÏÏÏÏÏÏÏÏÏÏÏÏÏÏÏÏÏÏÏÏÏÏ (36.6) (24.5) (74.3) (43.9) Income before income taxes and dividends on preferred securities of subsidiary trust ÏÏÏÏÏÏÏ $ 126.9 $ 105.4 $ 248.0 $ 212.2 September 30, March 31, 2001 2001 (In millions) Segment assets Supply SolutionsÏÏÏÏÏÏÏÏÏÏÏÏÏÏÏÏÏÏÏÏÏÏÏÏÏÏÏÏÏÏÏÏÏÏÏÏÏÏÏÏÏÏÏÏÏÏÏÏÏÏ $10,977.0 $10,067.4 Information SolutionsÏÏÏÏÏÏÏÏÏÏÏÏÏÏÏÏÏÏÏÏÏÏÏÏÏÏÏÏÏÏÏÏÏÏÏÏÏÏÏÏÏÏÏÏÏÏ 519.1 558.9 CorporateÏÏÏÏÏÏÏÏÏÏÏÏÏÏÏÏÏÏÏÏÏÏÏÏÏÏÏÏÏÏÏÏÏÏÏÏÏÏÏÏÏÏÏÏÏÏÏÏÏÏÏÏÏÏÏÏ 702.0 903.6 TotalÏÏÏÏÏÏÏÏÏÏÏÏÏÏÏÏÏÏÏÏÏÏÏÏÏÏÏÏÏÏÏÏÏÏÏÏÏÏÏÏÏÏÏÏÏÏÏÏÏÏÏÏÏÏÏÏ $12,198.1 $11,529.9 13
  • 15. McKESSON CORPORATION FINANCIAL REVIEW (Unaudited) Segment Results The revenues and operating proÑts by business segment are as follows: Three Months Ended Six Months Ended September 30, September 30, 2001 2000 Chg. 2001 2000 Chg. (Dollars in millions) REVENUES Supply Solutions Pharmaceutical Distribution & Services U.S. Health Care(1) ÏÏÏÏÏÏÏÏÏ $10,456.6 $8,301.7 26% $20,421.5 $16,426.7 24% International ÏÏÏÏÏÏÏÏÏÏÏÏÏÏÏÏ 714.5 648.2 10 1,427.0 1,275.8 12 Total Pharmaceutical Distribution & Services ÏÏÏ 11,171.1 8,949.9 25 21,848.5 17,702.5 23 Medical-Surgical Distribution & Services ÏÏÏÏÏÏÏÏÏÏÏÏÏÏÏÏÏÏÏÏ 751.7 694.7 8 1,484.4 1,434.0 4 Total Supply SolutionsÏÏÏÏÏÏ 11,922.8 9,644.6 24 23,332.9 19,136.5 22 Information Solutions SoftwareÏÏÏÏÏÏÏÏÏÏÏÏÏÏÏÏÏÏÏÏÏÏ 42.2 28.1 50 87.6 59.8 46 Services ÏÏÏÏÏÏÏÏÏÏÏÏÏÏÏÏÏÏÏÏÏÏ 178.6 174.4 2 358.6 350.6 2 HardwareÏÏÏÏÏÏÏÏÏÏÏÏÏÏÏÏÏÏÏÏÏ 15.1 17.7 (15) 32.9 34.8 (5) Total Information Solutions 235.9 220.2 7 479.1 445.2 8 CorporateÏÏÏÏÏÏÏÏÏÏÏÏÏÏÏÏÏÏÏÏÏÏÏ 0.6 0.7 1.2 1.4 TotalÏÏÏÏÏÏÏÏÏÏÏÏÏÏÏÏÏÏÏÏÏÏÏÏÏÏÏ $12,159.3 $9,865.5 23 $23,813.2 $19,583.1 22 OPERATING PROFIT (LOSS) Supply SolutionsÏÏÏÏÏÏÏÏÏÏÏÏÏÏÏÏÏ $ 176.0 (3) $ 159.2 (6) 11 $ 372.8 (3) $ 309.6 (6) 20 Information Solutions ÏÏÏÏÏÏÏÏÏÏÏÏ 14.5 (4) (0.6)(7) 3.5 (4) 2.6 (7) 35 TotalÏÏÏÏÏÏÏÏÏÏÏÏÏÏÏÏÏÏÏÏÏÏÏÏÏÏÏ 190.5 158.6 20 376.3 312.2 21 Interest Expense(2) ÏÏÏÏÏÏÏÏÏÏÏÏÏÏ (27.0) (28.7) (6) (54.0) (56.1) (4) Corporate(2)ÏÏÏÏÏÏÏÏÏÏÏÏÏÏÏÏÏÏÏÏ (36.6)(5) (24.5)(8) 49 (74.3)(5) (43.9)(8) 69 Income before income taxes and dividends on preferred securities of subsidiary trust ÏÏÏÏÏÏÏÏÏÏÏÏÏÏ $ 126.9 $ 105.4 20 $ 248.0 $ 212.2 17 (1) Includes warehouse sales of $3,241.5 million and $2,375.3 million in the three months ended Septem- ber 30, 2001 and 2000, and $6,348.0 million and $4,700.6 million in the six months ended September 30, 2001 and 2000. (2) Corporate interest income has been reclassiÑed from Interest Ì net to the Corporate segment for all periods presented. (3) Includes pre-tax charges of $5.1 million for asset impairments and $24.0 million for severance and exit- related activities related to product rationalizations and distribution center closures in the medical- 14
  • 16. McKESSON CORPORATION FINANCIAL REVIEW Ì (Continued) (Unaudited) surgical business, partially oÅset by proceeds of $2.8 million in settlements from third parties in the medical-surgical and medical management businesses. Also includes charges for asset impairments of $0.2 million in the quarter and $3.1 million in the six months, and net reductions in severance and exit- related reserves of $0.5 million in the quarter and $4.3 million in the six months associated with prior year restructuring plans of the pharmaceutical and medical-surgical businesses. (4) Includes settlement proceeds of $1.0 million related to purchased software. A charge of $3.2 million was recorded to write oÅ this asset in the quarter ended June 30, 2001. The six months ended September 30, 2001 also include pre-tax losses of $18.4 million on the sales of two businesses. (5) Includes a pre-tax loss on equity investments of $3.4 million and $5.7 million and costs associated with the Accounting Litigation of $0.9 million and $1.5 million in the quarter and six months ended September 30, 2001. The six months also includes a $2.8 million reduction in prior year severance reserves and the receipt of $0.9 million in settlement proceeds from an investment that was previously written oÅ. (6) Includes a $7.8 million pre-tax gain on the liquidation of an investment partially oÅset by charges of $0.5 million for severance in the pharmacy management business and $2.3 million for severance and exit- related activities in the medication management business. (7) Includes a $2.1 million charge for the write-oÅ of purchased in-process technology related to an acquisition. (8) Includes costs associated with the Accounting Litigation of $0.7 million. Factors AÅecting Forward-Looking Statements In addition to historical information, our Ñnancial review includes certain forward-looking statements within the meaning of Section 27A of the Securities Act of 1933, as amended (the quot;quot;Securities Act'') and section 21E of the Securities Exchange Act of 1934, as amended (the quot;quot;Exchange Act''). Some of the forward-looking statements can be identiÑed by the use of forward-looking words such as quot;quot;believes'', quot;quot;expects'', quot;quot;anticipates'', quot;quot;may'', quot;quot;will'', quot;quot;should'', quot;quot;seeks'', quot;quot;approximately'', quot;quot;intends'', quot;quot;plans'', quot;quot;estimates'', or the negative of these words or other comparable terminology. The discussion of Ñnancial trends, strategy, plans or intentions may also include forward-looking statements. Forward-looking statements involve risks and uncertainties that could cause actual results to diÅer materially from those projected. These and other risks and uncertainties are described herein or in our Forms 10-K, 10-Q, 8-K and other public documents Ñled with the SEC. Readers are cautioned not to place undue reliance on these forward- looking statements, which speak only as of the date hereof. We undertake no obligation to publicly release the result of any revisions to these forward-looking statements to reÖect events or circumstances after this date or to reÖect the occurrence of unanticipated events. Overview of Results Net income for the quarter ended September 30, 2001 increased to $79.0 million, $0.27 per diluted share, from $61.9 million, $0.22 per diluted share, in the prior year. For the six-month period, net income increased to $184.4 million, $0.63 per diluted share, from $125.5 million, $0.44 per diluted share. We elected to adopt SFAS No. 142, and accordingly discontinued the amortization of goodwill eÅective April 1, 2001. On a comparable basis, excluding goodwill amortization of $12.4 million and a tax beneÑt on goodwill amortization of $0.8 million, net income as adjusted would have been $73.5 million and earnings per diluted share would have been $0.26 in the prior year second quarter. Excluding goodwill amortization of $23.5 million and a tax beneÑt on goodwill amortization of $1.5 million, net income as adjusted would have been $147.5 million and earnings per diluted share would have been $0.52 in the six months ended September 30, 2000. 15
  • 17. McKESSON CORPORATION FINANCIAL REVIEW Ì (Continued) (Unaudited) The results include the following: Three Months Ended September 30, 2001 2000 Pre-tax After-tax Pre-tax After-tax (In millions) Net Income Before unusual items and dividends on convertible preferred securities of subsidiary trustÏÏÏÏÏÏÏÏÏÏÏÏÏÏÏÏÏÏÏÏÏÏÏÏÏÏÏÏÏ $152.5 $ 96.9 $103.2 $63.0 Dividends on convertible preferred securities of subsidiary trust Ì (1.6) Ì (1.6) Before unusual items ÏÏÏÏÏÏÏÏÏÏÏÏÏÏÏÏÏÏÏÏÏÏÏÏÏÏÏÏÏÏÏÏÏÏÏÏ 152.5 95.3 103.2 61.4 Unusual items Supply Solutions ÏÏÏÏÏÏÏÏÏÏÏÏÏÏÏÏÏÏÏÏÏÏÏÏÏÏÏÏÏÏÏÏÏÏÏÏÏÏ (26.0) (16.6) 5.0 3.0 Information Solutions ÏÏÏÏÏÏÏÏÏÏÏÏÏÏÏÏÏÏÏÏÏÏÏÏÏÏÏÏÏÏÏÏÏÏ 1.0 0.7 (2.1) (2.1) Corporate ÏÏÏÏÏÏÏÏÏÏÏÏÏÏÏÏÏÏÏÏÏÏÏÏÏÏÏÏÏÏÏÏÏÏÏÏÏÏÏÏÏÏÏÏ (0.6) (0.4) (0.7) (0.4) Net income ÏÏÏÏÏÏÏÏÏÏÏÏÏÏÏÏÏÏÏÏÏÏÏÏÏÏÏÏÏÏÏÏÏÏÏÏÏÏÏÏÏÏÏÏ $126.9 $ 79.0 $105.4 $61.9 Six Months Ended September 30, 2001 2000 Pre-tax After-tax Pre-tax After-tax (In millions) Net Income Before unusual items and dividends on convertible preferred securities of subsidiary trustÏÏÏÏÏÏÏÏÏÏÏÏÏÏÏÏÏÏÏÏÏÏÏÏÏÏÏÏÏ $297.2 $188.7 $210.0 $128.1 Dividends on convertible preferred securities of subsidiary trust Ì (3.1) Ì (3.1) Before unusual items ÏÏÏÏÏÏÏÏÏÏÏÏÏÏÏÏÏÏÏÏÏÏÏÏÏÏÏÏÏÏÏÏÏÏÏÏ 297.2 185.6 210.0 125.0 Unusual items Supply Solutions ÏÏÏÏÏÏÏÏÏÏÏÏÏÏÏÏÏÏÏÏÏÏÏÏÏÏÏÏÏÏÏÏÏÏÏÏÏÏ (25.1) (16.0) 5.0 3.0 Information Solutions ÏÏÏÏÏÏÏÏÏÏÏÏÏÏÏÏÏÏÏÏÏÏÏÏÏÏÏÏÏÏÏÏÏÏ (20.6) 17.0 (2.1) (2.1) Corporate ÏÏÏÏÏÏÏÏÏÏÏÏÏÏÏÏÏÏÏÏÏÏÏÏÏÏÏÏÏÏÏÏÏÏÏÏÏÏÏÏÏÏÏÏ (3.5) (2.2) (0.7) (0.4) Net income ÏÏÏÏÏÏÏÏÏÏÏÏÏÏÏÏÏÏÏÏÏÏÏÏÏÏÏÏÏÏÏÏÏÏÏÏÏÏÏÏÏÏÏÏ $248.0 $184.4 $212.2 $125.5 The results for the quarter and six months ended September 30, 2001 include unusual items that decreased after-tax income by $16.3 million and $1.2 million. These unusual items included charges of $3.3 million for asset impairments and $15.2 million for severance and exit-related costs related to product rationalizations and distribution center closures in the medical-surgical business of the Supply Solutions segment. These charges were partially oÅset by proceeds of $1.7 million from the settlement of claims with third parties in the medical-surgical and medical management businesses. The results also include charges of $0.1 million in the quarter and $2.0 million in the six months for asset impairments, and net reductions of $0.3 million in the quarter and $2.8 million in the six months in costs associated with prior year restructuring reserves in the pharmaceutical and medical-surgical businesses. During the quarter ended September 30, 2001, the Information Solutions segment recorded proceeds of $0.7 million from the settlement of a claim related to purchased software. During the six months ended September 30, 2001, this segment also recorded a charge of $2.1 million to write oÅ this asset and sold two businesses for an after-tax gain of $18.4 million. In the Corporate segment, we recorded after-tax losses on equity investments of $2.2 million in the quarter and $3.6 million in the six months and costs associated with the Accounting Litigation of $0.6 million in the 16
  • 18. McKESSON CORPORATION FINANCIAL REVIEW Ì (Continued) (Unaudited) quarter and $1.0 million in the six months. These charges were oÅset in the quarter and six months by a reduction in prior year severance reserves of $1.8 million for executives of the former iMcKesson business segment and the receipt of $0.6 million in settlement proceeds representing a partial recovery from an investment that was written oÅ in prior years. The results for the quarter and six months ended September 30, 2000 include unusual items that increased after-tax income by $0.5 million. These unusual items consisted of a $4.8 million gain on the liquidation of an investment partially oÅset by severance and exit-related costs of $1.8 million in the Supply Solutions segment, a $2.1 million write-oÅ of purchased in-process technology related to an acquisition in the Information Solutions segment and $0.4 million in costs associated with the pending securities litigation. Net income before unusual items increased to $95.3 million from $61.4 million in the second quarter and to $185.6 million from $125.0 million in the six months ended September 30, 2001 and 2000, reÖecting revenue growth and operating margin expansion in both the Supply Solutions and Information Solutions segments. The eÅective income tax rate before unusual items for the three and six months ended September 30, 2001 declined from the eÅective income tax rate for the comparable prior year periods due to the discontinuance of goodwill amortization, which is primarily non-tax-deductible, and tax planning initiatives. Unusual items included a $30.0 million tax beneÑt on the sale of the stock of an Information Solutions business. The discussion of the Ñnancial results that follows focuses on the results excluding unusual items, as we believe such discussion is the most informative representation of recurring, non-transactional related operating results. Supply Solutions The Supply Solutions segment includes the operations of our U.S. pharmaceutical distribution and services businesses, international pharmaceutical operations (Canada and Mexico), and medical-surgical distribution and services business. This segment accounted for 98% of consolidated revenues for the three and six months ended September 30, 2001 and 2000. Pharmaceutical Distribution & Services revenues increased by 25% to $11.2 billion in the quarter and 23% to $21.8 billion in the six-month period. This increase reÖects growth in the quarter and Ñrst half in the U.S. direct delivery business of 22% and 20%, an increase in U.S. sales to customers' warehouses of 36% and 35% and an increase in international revenues of 10% and 12%. The revenue growth in the quarter and Ñrst half of Ñscal 2002 primarily reÖects improved growth rates from a number of the Company's largest U.S. retail drug chain customers and the impact of the implementation of certain distribution agreements which took full eÅect in the second quarter. Medical-Surgical Distribution & Services revenues increased 8% to $751.7 million in the quarter and 4% to $1,484.4 million in the six-month period. The six months ended September 30, 2000 contained Ñve more selling days than the current year's six-month period as a result of that business' Ñscal calendar. Excluding the additional selling days in the prior year, six-month period revenues increased by 6%. Supply Solutions operating proÑt increased $47.8 million or 31% to $202.0 million in the quarter and $93.3 million or 31% to $397.9 million in the six months. Operating proÑt as a percent of revenues (calculated excluding warehouse sales) increased 21 basis points to 2.33% in the second quarter and 23 basis points to 2.34% for the six months compared to prior year margins. Excluding goodwill amortization in the quarter and six months ended September 30, 2000, operating proÑt increased 25% and the operating margin increased 17
  • 19. McKESSON CORPORATION FINANCIAL REVIEW Ì (Continued) (Unaudited) 12 basis points and 14 basis points in the respective periods. The increase in the operating margin reÖects productivity improvements in both back-oÇce and Ñeld operations and expanded product sourcing activities. Information Solutions The Information Solutions segment includes revenues from software sales, services and hardware sales. This segment accounted for 2% of consolidated revenues for the three and six months ended September 30, 2001 and 2000. Information Solutions revenues increased 7% to $235.9 million compared to $220.2 million in the prior year second quarter and 8% to $479.1 million from $445.2 million in the prior year six-month period. Software revenues increased 50% to $42.2 million from $28.1 million in the prior year second quarter and increased 46% to $87.6 million from $59.8 million in the prior year six-month period, reÖecting the recognition of previously deferred revenue as a result of our adoption of a new contracting methodology in the prior year that led to an increase in the deferral of software revenues as a result of the use of the percentage of completion accounting method on such revenues. Services revenues of $178.6 million in the quarter and $358.6 million in the six months increased 2% from the prior year's second quarter of $174.4 million and six months of $350.6 million. Hardware revenues decreased 15% in the quarter to $15.1 million from $17.7 mil- lion in the prior year second quarter and 5% in the Ñrst half to $32.9 million from $34.8 million in the prior year Ñrst half. Operating proÑt increased to $13.5 million in the quarter ended September 30, 2001 from $1.5 million in the prior year quarter and to $24.1 million in the current year six-month period from $4.7 million in the prior year six-month period. The operating proÑt margin increased to 5.72% in the quarter ended September 30, 2001 compared to 0.68% for the prior year second quarter and increased to 5.03% in the Ñrst half compared to 1.06% in the prior year comparable period. Excluding goodwill amortization in the prior year periods, operating proÑt increased 90% and the operating margin increased 250 basis points in the quarter and operating proÑt increased 63% and the operating margin increased 171 basis points in the six months compared to the respective prior year periods. The increase is primarily the result of the increase in higher margin software revenue and operating expense management. Interest Expense Interest expense decreased to $27.0 million from $28.7 million in the prior year second quarter and to $54.0 million from $56.1 million in the prior year Ñrst half. The decrease is due to lower interest rates partially oÅset by an increase in average borrowings to support revenue growth in the current year. Corporate Corporate expenses increased to $36.0 million from $23.8 million in the prior year second quarter and to $70.8 million from $43.2 million in the prior year Ñrst half. The increase in Corporate expenses reÖects expenses for the sale of receivables associated with an increase in working capital, higher beneÑt costs and our share in the losses of HealthNexis, an Internet-based company we formed with other health care companies in Ñscal 2001. The Corporate segment also includes the reclassiÑcation of Corporate interest income of $0.7 million and $1.7 million from Interest-net in the current and prior year second quarter and $1.3 million and 4.3 million in the current and prior year six-month periods. Liquidity and Capital Resources Cash and equivalents decreased by $147.3 million to $286.4 million at September 30, 2001 from $433.7 million at March 31, 2001. During the six months ended September 30, 2001, operating activities provided $3.6 million of cash. The improvement in cash Öows from operating activities during the quarter 18
  • 20. McKESSON CORPORATION FINANCIAL REVIEW Ì (Concluded) (Unaudited) ended September 30, 2001, reÖects a decline in net Ñnancial inventory (inventory less payables) from June 30, 2001 to September 30, 2001. Cash and marketable securities available for sale were $293.1 million at September 30, 2001 compared to $445.6 million at March 31, 2001. The September 30, 2001 marketable securities balance includes $4.0 million that is currently restricted and held in trust as exchange property in connection with our outstanding exchangeable debentures. Inventories increased $538 million to $5.7 billion at September 30, 2001 from $5.1 billion at March 31, 2001. The increase in inventories reÖects the build up associated with the implementation of new pharmaceu- tical distribution agreements. Stockholders' equity was $3.7 billion at September 30, 2001, and the net debt-to-capital ratio was 19%, up slightly from 18% at March 31, 2001. The net debt-to-capital ratio for both periods was computed by reducing the outstanding debt amount by the cash and marketable securities balances. We had no sales of trade accounts receivable and no short-term borrowings outstanding at September 30, 2001. Return on average committed capital improved to 19.4% as of September 30, 2001 from 17.9% as of September 30, 2000. This improvement reÖects a growth in the our operating proÑt in excess of the growth in the working capital required to fund the increase in revenues resulting from new pharmaceutical distribution agreements. Common shares outstanding increased to 286.0 million at September 30, 2001 from 284.0 million at March 31, 2001 due primarily to shares issued under employee beneÑt plans, partially oÅset by the 0.4 million shares repurchased as part of our previously announced $250 million share repurchase program. Average diluted shares increased to 299.0 million in the second quarter of Ñscal 2002 from 292.0 million in the comparable prior year period due to an increased eÅect of dilutive securities as a result of an increase in our stock price and an increase in common shares outstanding. In October 2001, we renewed a 364-day revolving credit agreement that allows for borrowings of up to $1.075 billion under terms substantially similar to those previously in place. This credit facility is primarily intended to support our commercial paper borrowings. Additional Factors That May AÅect Future Results Reference is made to the additional factors that may aÅect the future results described in our most recent Annual Report on Form 10-K for the Ñscal year ended March 31, 2001. 19
  • 21. Item 3. Quantitative and Qualitative Disclosures about Market Risk We believe there has been no material change in our exposure to risks associated with Öuctuations in interest and foreign currency exchange rates discussed in our 2001 Annual Report on Form 10-K. PART II. OTHER INFORMATION Item 1. Legal Proceedings See Financial Note 12 to our unaudited condensed consolidated Ñnancial statements contained in Part I of this Quarterly Report on Form 10-Q. Item 4. Submission of Matters to a Vote of Security Holders Our Annual Meeting of Stockholders was held on July 25, 2001. The following matters were voted upon at the meeting and the stockholder votes on each such matter are brieÖy described below: The Board of Directors' nominees for directors as listed in the proxy statement were each elected to serve for a three-year term. The vote was as follows: Votes For Votes Withheld John H. Hammergren ÏÏÏÏÏÏÏÏÏÏÏÏÏÏÏÏÏÏÏÏÏÏÏÏÏÏÏÏÏÏÏÏÏÏÏÏÏÏ 252,646,769 6,348,781 M. Christine Jacobs ÏÏÏÏÏÏÏÏÏÏÏÏÏÏÏÏÏÏÏÏÏÏÏÏÏÏÏÏÏÏÏÏÏÏÏÏÏÏÏÏ 251,908,591 7,086,959 Martin M. KoÅel ÏÏÏÏÏÏÏÏÏÏÏÏÏÏÏÏÏÏÏÏÏÏÏÏÏÏÏÏÏÏÏÏÏÏÏÏÏÏÏÏÏÏ 252,395,187 6,600,363 The proposal to amend the 1997 Non-Employee Directors' Equity Compensation and Deferral Plan received the following vote: Votes For Votes Against Votes Abstained 192,692,929 63,888,328 2,414,293 The proposal to approve the Amendment to the Company's Restated CertiÑcate of Incorporation to change our name to McKesson Corporation received the following vote: Votes For Votes Against Votes Abstained 255,666,985 2,253,621 1,074,944 The proposal to ratify the appointment of Deloitte & Touche LLP as our independent auditors for the Ñscal year ending March 31, 2002 received the following vote: Votes For Votes Against Votes Abstained 254,293,104 3,164,131 1,538,315 The stockholder proposal regarding performance-based options received the following vote: Votes For Votes Against Votes Abstained 55,711,172 139,667,310 13,224,895 The stockholder proposal regarding severance payments received the following vote: Votes For Votes Against Votes Abstained 35,918,555 157,087,896 15,596,526 The stockholder proposal regarding the sale of the Company received the following vote: Votes For Votes Against Votes Abstained 6,583,730 198,713,051 3,306,596 20
  • 22. Item 6. Exhibits and Reports on Form 8-K (a) Exhibits Exhibits identiÑed below are incorporated herein by reference as exhibits to this report. Exhibit Number Description 3.2 CertiÑcate of Amendment to the Restated CertiÑcate of Incorporation of Registrant as Ñled with the oÇce of the Delaware Secretary of State on July 30, 2001. 3.3 Amended and Restated By-Laws of the Company dated as of July 25, 2001. 10.1 Fourth Amendment to June 25, 1999 Receivables Purchase Agreement, dated as of June 15, 2001. (b) Reports on Form 8-K There were no reports on Form 8-K Ñled during the three months ended September 30, 2001. 21
  • 23. SIGNATURES Pursuant to the requirements of the Securities Exchange Act of 1934, the Registrant has duly caused this report to be signed on its behalf by the undersigned, thereunto duly authorized. MCKESSON CORPORATION Dated: November 2, 2001 /s/ WILLIAM R. GRABER William R. Graber Senior Vice President and Chief Financial OÇcer /s/ NIGEL A. REES Nigel A. Rees Vice President and Controller 22