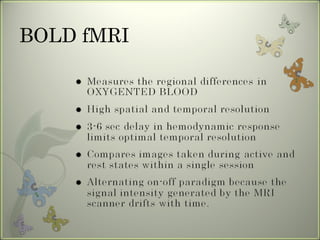
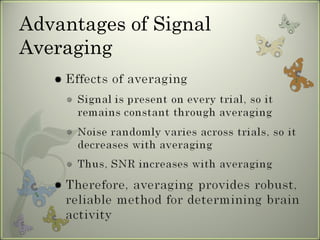
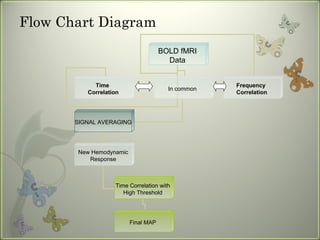
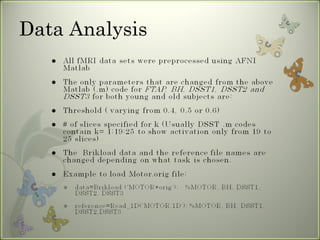
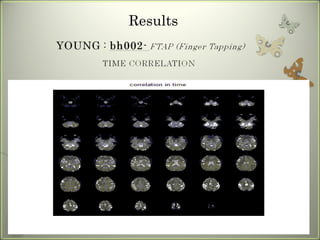
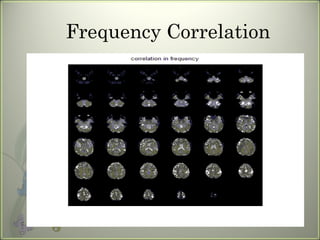
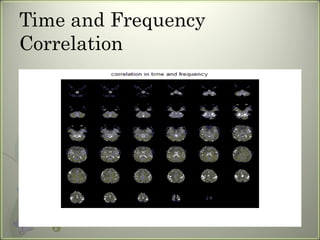
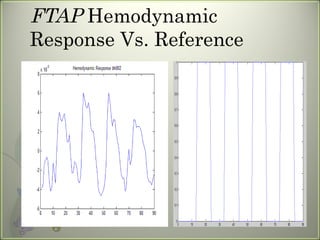
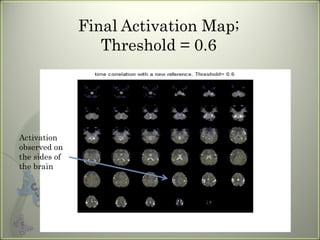
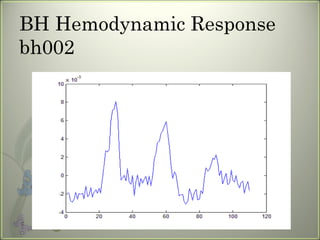
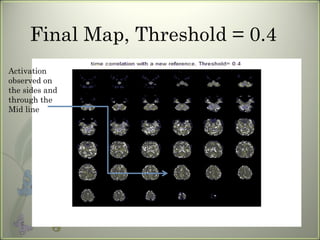
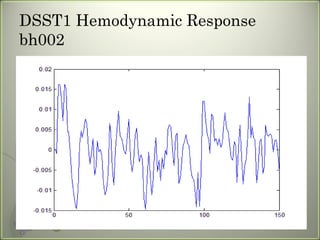
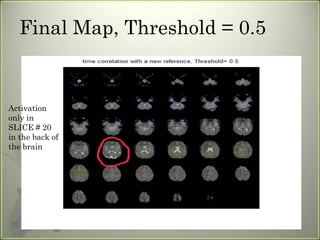
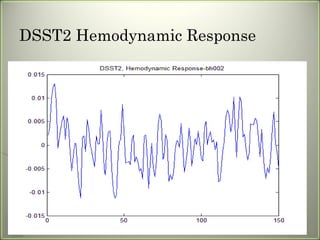
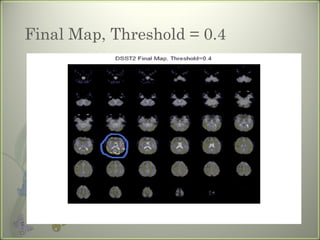
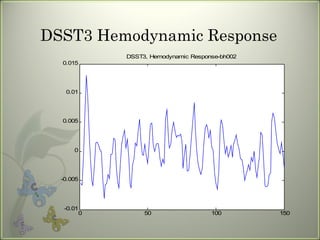
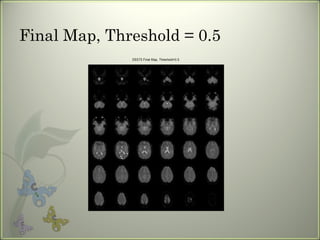
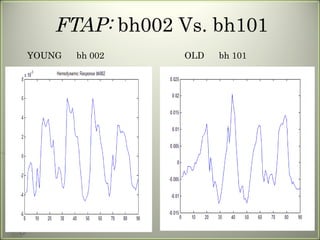
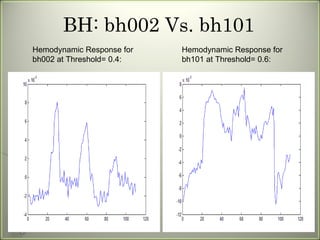
Signal Averaging Method (BOLD- fMRI Signal Data)
Outline
Introduction- fMRI
BOLD fMRI
Signal Averaging
Advantages of Signal Averaging
Objective
Method
Method (cont’d)
Flow Chart Diagram BOLD fMRI Data Time  Correlation In common Frequency  Correlation SIGNAL AVERAGING New Hemodynamic Response Time Correlation with High Threshold Final MAP
Imaging Parameters
Data Analysis
Results
Frequency Correlation
Time and Frequency Correlation
FTAP  Hemodynamic Response Vs. Reference
Final Activation Map; Threshold = 0.6 Activation observed on the sides of the brain
BH Hemodynamic Response bh002
Final Map, Threshold = 0.4 Activation observed on the sides and through the Mid line
DSST1 Hemodynamic Response bh002
Final Map, Threshold = 0.5 Activation only in SLICE # 20 in the back of the brain
DSST2 Hemodynamic Response
Final Map, Threshold = 0.4
DSST3 Hemodynamic Response
Final Map, Threshold = 0.5
FTAP:  bh002 Vs. bh101 OLD  bh 101 YOUNG  bh 002
BH: bh002 Vs. bh101 Hemodynamic Response for bh101 at Threshold= 0.6: Hemodynamic Response for bh002 at Threshold= 0.4:
DSST3: bh002 Vs. bh118 Hemodynamic Response for bh118 at Threshold= 0.6: Hemodynamic Response for bh002 at Threshold= 0.5:
Conclusion
References

Medical Imaging