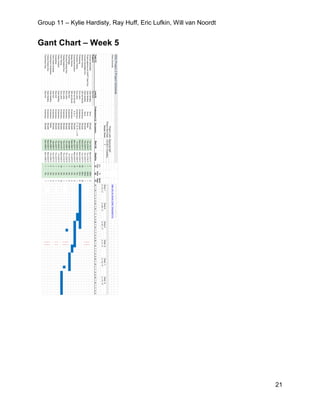
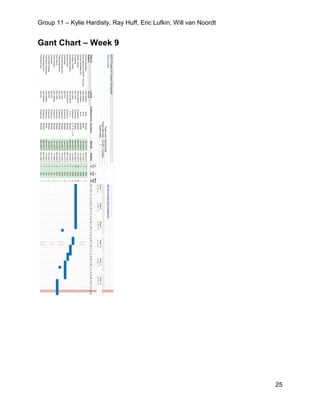
The document outlines a project plan for a mechanical design course, detailing task assignments, objectives, deliverables, and team members for each step of the design process related to the device named 'salient rhino'. The tasks cover concept generation, testing, prototyping, engineering analysis, design reviews, and final report compilation among others. Each section includes specific objectives, personnel responsibilities, time estimates, and dependencies critical for project completion.
![Group 11 – Kylie Hardisty, Ray Huff, Eric Lufkin, Will van Noordt
1
PROJECT 2
CSU MECH 202
Group 11
Kylie Hardisty - kchar@rams.colostate.edu
Ray Huff - huffray@gmail.com
Eric Lufkin - eblufkin@rams.colostate.edu
Will van Noordt - willvanzero@gmail.com
CONTENTS
Title Page with Device Image……….….… ..[2]
Project Plan……………………………….… ..[3]
Specification Development…………….... ..[28]
Engineering Analysis……………………… .[37]
Concept Generation and Evaluation….….[45]
Device Description…………………………..[63]
Bill of Materials……………………………....[78]
Testing………………………………………...[81]
Reliability Analysis………………………....[89]
Safety Analysis……………………………...[97]
Service and Support Plan………………....[99]
Teamwork Analysis………………………..[103]
Failure Analysis……………………………[159]
Appendices…………………………………[163]](https://image.slidesharecdn.com/mech202engineeringdesignprojectreport-171218065618/85/MECH202-Engineering-Design-Project-Report-1-320.jpg)

![Group 11 – Kylie Hardisty, Ray Huff, Eric Lufkin, Will van Noordt
3
Project Plan
CSU MECH 202
Group 11
Task List………………….....[4]
Task Dependencies………..[5]
Project Planning……...…….[6]
Gantt Charts…………….....[17]
Project Dates………......…..[27]](https://image.slidesharecdn.com/mech202engineeringdesignprojectreport-171218065618/85/MECH202-Engineering-Design-Project-Report-3-320.jpg)


![Group 11 – Kylie Hardisty, Ray Huff, Eric Lufkin, Will van Noordt
28
Specification
Development
CSU MECH 202
Group 11
QFD………………….............[29]
Competitive Analysis………..[30]](https://image.slidesharecdn.com/mech202engineeringdesignprojectreport-171218065618/85/MECH202-Engineering-Design-Project-Report-28-320.jpg)


![Group 11 – Kylie Hardisty, Ray Huff, Eric Lufkin, Will van Noordt
37
Engineering
Analysis
CSU MECH 202
Group 11
Engineering Analysis…………….....[38]](https://image.slidesharecdn.com/mech202engineeringdesignprojectreport-171218065618/85/MECH202-Engineering-Design-Project-Report-37-320.jpg)


![Group 11 – Kylie Hardisty, Ray Huff, Eric Lufkin, Will van Noordt
45
Concept Generation
and Selection
CSU MECH 202
Group 11
Brain Storming……………...........[46]
Morphology Chart……………......[49]
Mind Map……………...................[52]
Function List…………..................[53]
Concept Drawings………….........[56]
Belief Map……………..................[62]](https://image.slidesharecdn.com/mech202engineeringdesignprojectreport-171218065618/85/MECH202-Engineering-Design-Project-Report-45-320.jpg)


![Group 11 – Kylie Hardisty, Ray Huff, Eric Lufkin, Will van Noordt
63
Device Description
CSU MECH 202
Group 11
Analogies……………..........................[64]
Concept Development……………......[65]
Prototype Iterations……………...........[69]](https://image.slidesharecdn.com/mech202engineeringdesignprojectreport-171218065618/85/MECH202-Engineering-Design-Project-Report-63-320.jpg)


![Group 11 – Kylie Hardisty, Ray Huff, Eric Lufkin, Will van Noordt
78
Bill of Materials
CSU MECH 202
Group 11
Bill of Materials……………...........[79]](https://image.slidesharecdn.com/mech202engineeringdesignprojectreport-171218065618/85/MECH202-Engineering-Design-Project-Report-78-320.jpg)


![Group 11 – Kylie Hardisty, Ray Huff, Eric Lufkin, Will van Noordt
81
Testing
CSU MECH 202
Group 11
Testing…………….......................[82]](https://image.slidesharecdn.com/mech202engineeringdesignprojectreport-171218065618/85/MECH202-Engineering-Design-Project-Report-81-320.jpg)


![Group 11 – Kylie Hardisty, Ray Huff, Eric Lufkin, Will van Noordt
89
Reliability Analysis
CSU MECH 202
Group 11
FMEA…………….........................[90]
FTA……………............................[95]
Reliability Analysis…………….....[96]](https://image.slidesharecdn.com/mech202engineeringdesignprojectreport-171218065618/85/MECH202-Engineering-Design-Project-Report-89-320.jpg)


![Group 11 – Kylie Hardisty, Ray Huff, Eric Lufkin, Will van Noordt
97
Safety Analysis
CSU MECH 202
Group 11
Safety Analysis……………...........[98]](https://image.slidesharecdn.com/mech202engineeringdesignprojectreport-171218065618/85/MECH202-Engineering-Design-Project-Report-97-320.jpg)

![Group 11 – Kylie Hardisty, Ray Huff, Eric Lufkin, Will van Noordt
99
Service and
Support Plan
CSU MECH 202
Group 11
Service and Support Plan……………...........[100]
Device Service and Support Kit……………..[101]](https://image.slidesharecdn.com/mech202engineeringdesignprojectreport-171218065618/85/MECH202-Engineering-Design-Project-Report-99-320.jpg)


![Group 11 – Kylie Hardisty, Ray Huff, Eric Lufkin, Will van Noordt
103
Teamwork Analysis
CSU MECH 202
Group 11
Team Contract…………….............................[104]
Lessons Learned…………….........................[105]
Reflection - Ray Huff……………...................[106]
CATME Results – Ray Huff…………............[107]
Reflection – Eric Lufkin……………...............[119]
CATME Results – Eric Lufkin………….........[120]
Reflection – Kylie Hardisty……………..........[132]
CATME Results – Kylie Hardisty ……….......[134]
Reflection – Will van Noordt……………........[146]
CATME Results – Will van Noordt………......[147]](https://image.slidesharecdn.com/mech202engineeringdesignprojectreport-171218065618/85/MECH202-Engineering-Design-Project-Report-103-320.jpg)


![Group 11 – Kylie Hardisty, Ray Huff, Eric Lufkin, Will van Noordt
159
Failure Analysis
CSU MECH 202
Group 11
Failure Analysis……………………...........[160]](https://image.slidesharecdn.com/mech202engineeringdesignprojectreport-171218065618/85/MECH202-Engineering-Design-Project-Report-159-320.jpg)
![Group 11 – Kylie Hardisty, Ray Huff, Eric Lufkin, Will van Noordt
161
References
CSU MECH 202
Group 11
References………………………...........[162]](https://image.slidesharecdn.com/mech202engineeringdesignprojectreport-171218065618/85/MECH202-Engineering-Design-Project-Report-161-320.jpg)

![Group 11 – Kylie Hardisty, Ray Huff, Eric Lufkin, Will van Noordt
163
Appendix
CSU MECH 202
Group 11
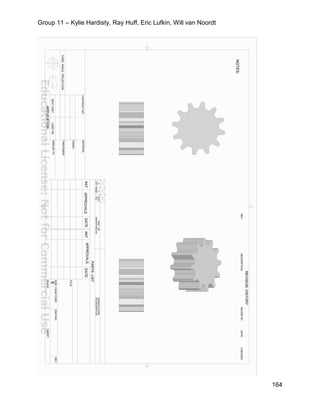
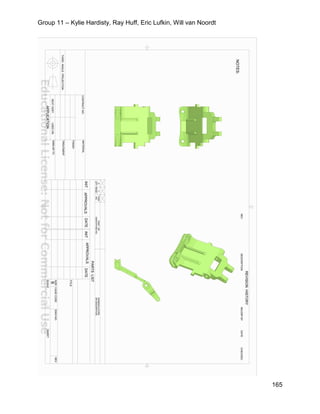
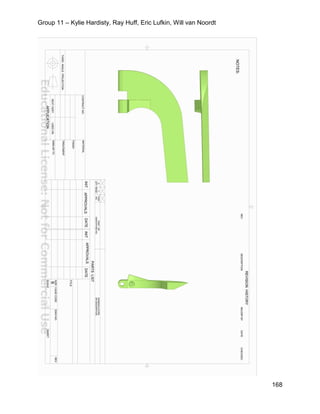
Technical Drawings……………...............[164]](https://image.slidesharecdn.com/mech202engineeringdesignprojectreport-171218065618/85/MECH202-Engineering-Design-Project-Report-163-320.jpg)