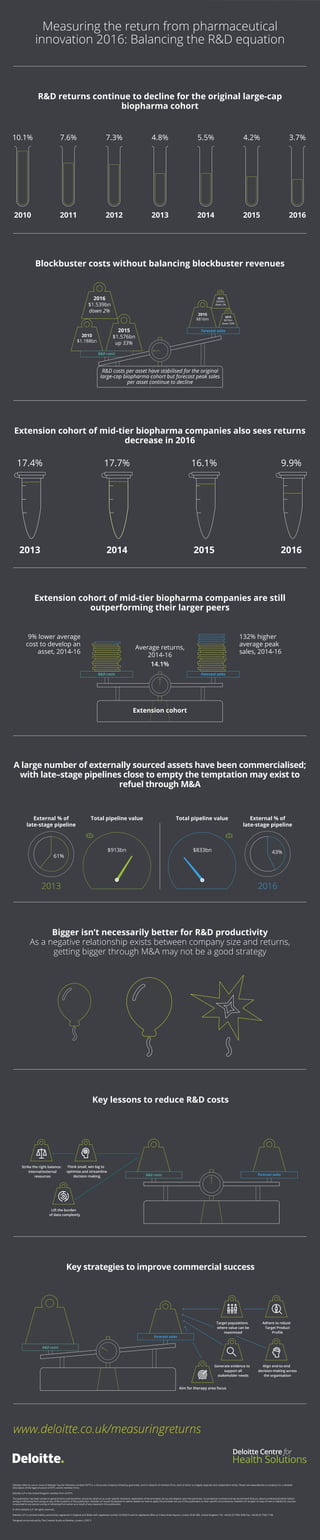
Deloitte refers to one or more of Deloitte Touche Tohmatsu Limited (“DTTL”), a UK private company limited by guarantee, and its network of member firms, each of which is a legally separate and independent entity. Please see www.deloitte.co.uk/about for a detailed
description of the legal structure of DTTL and its member firms.
Deloitte LLP is the United Kingdom member firm of DTTL.
This publication has been written in general terms and therefore cannot be relied on to cover specific situations; application of the principles set out will depend upon the particular circumstances involved and we recommend that you obtain professional advice before
acting or refraining from acting on any of the contents of this publication. Deloitte LLP would be pleased to advise readers on how to apply the principles set out in this publication to their specific circumstances. Deloitte LLP accepts no duty of care or liability for any loss
occasioned to any person acting or refraining from action as a result of any material in this publication.
© 2016 Deloitte LLP. All rights reserved.
Deloitte LLP is a limited liability partnership registered in England and Wales with registered number OC303675 and its registered office at 2 New Street Square, London EC4A 3BZ, United Kingdom. Tel: +44 (0) 20 7936 3000 Fax: +44 (0) 20 7583 1198.
Designed and produced by The Creative Studio at Deloitte, London. J10513
www.deloitte.co.uk/measuringreturns
Measuring the return from pharmaceutical
innovation 2016: Balancing the R&D equation
R&D returns continue to decline for the original large-cap
biopharma cohort
2010 2011 2012 2013 2014 2015 2016
10.1% 7.6% 7.3% 4.8% 5.5% 4.2% 3.7%
Blockbuster costs without balancing blockbuster revenues
2010
$1.188bn
2015
$1.576bn
up 33%
2016
$1.539bn
down 2%
2010
$816m
2015
$416m
down 50%
2016
$394m
down 5%
R&D costs
Forecast sales
A large number of externally sourced assets have been commercialised;
with late–stage pipelines close to empty the temptation may exist to
refuel through M&A
2013
61%
2016
43%
External % of
late-stage pipeline
External % of
late-stage pipeline
Total pipeline value Total pipeline value
$913bn $833bn
Bigger isn’t necessarily better for R&D productivity
As a negative relationship exists between company size and returns,
getting bigger through M&A may not be a good strategy
Lift the burden
of data complexity
Think small, win big to
optimise and streamline
decision making Forecast salesR&D costs
Strike the right balance:
internal/external
resources
Key lessons to reduce R&D costs
Key strategies to improve commercial success
Forecast sales
R&D costs
Aim for therapy area focus
Adhere to robust
Target Product
Profile
Generate evidence to
support all
stakeholder needs
Align end-to-end
decision-making across
the organisation
Target populations
where value can be
maximised
R&D costs per asset have stabilised for the original
large-cap biopharma cohort but forecast peak sales
per asset continue to decline
Extension cohort of mid-tier biopharma companies also sees returns
decrease in 2016
2013
17.4%
2014
17.7%
2015
16.1%
2016
9.9%
R&D costs Forecast sales
Extension cohort of mid-tier biopharma companies are still
outperforming their larger peers
9% lower average
cost to develop an
asset, 2014-16
132% higher
average peak
sales, 2014-16
Extension cohort
Average returns,
2014-16
14.1%

Measuring the return from pharmaceutical innovation 2016

  • 1.
    Deloitte refers toone or more of Deloitte Touche Tohmatsu Limited (“DTTL”), a UK private company limited by guarantee, and its network of member firms, each of which is a legally separate and independent entity. Please see www.deloitte.co.uk/about for a detailed description of the legal structure of DTTL and its member firms. Deloitte LLP is the United Kingdom member firm of DTTL. This publication has been written in general terms and therefore cannot be relied on to cover specific situations; application of the principles set out will depend upon the particular circumstances involved and we recommend that you obtain professional advice before acting or refraining from acting on any of the contents of this publication. Deloitte LLP would be pleased to advise readers on how to apply the principles set out in this publication to their specific circumstances. Deloitte LLP accepts no duty of care or liability for any loss occasioned to any person acting or refraining from action as a result of any material in this publication. © 2016 Deloitte LLP. All rights reserved. Deloitte LLP is a limited liability partnership registered in England and Wales with registered number OC303675 and its registered office at 2 New Street Square, London EC4A 3BZ, United Kingdom. Tel: +44 (0) 20 7936 3000 Fax: +44 (0) 20 7583 1198. Designed and produced by The Creative Studio at Deloitte, London. J10513 www.deloitte.co.uk/measuringreturns Measuring the return from pharmaceutical innovation 2016: Balancing the R&D equation R&D returns continue to decline for the original large-cap biopharma cohort 2010 2011 2012 2013 2014 2015 2016 10.1% 7.6% 7.3% 4.8% 5.5% 4.2% 3.7% Blockbuster costs without balancing blockbuster revenues 2010 $1.188bn 2015 $1.576bn up 33% 2016 $1.539bn down 2% 2010 $816m 2015 $416m down 50% 2016 $394m down 5% R&D costs Forecast sales A large number of externally sourced assets have been commercialised; with late–stage pipelines close to empty the temptation may exist to refuel through M&A 2013 61% 2016 43% External % of late-stage pipeline External % of late-stage pipeline Total pipeline value Total pipeline value $913bn $833bn Bigger isn’t necessarily better for R&D productivity As a negative relationship exists between company size and returns, getting bigger through M&A may not be a good strategy Lift the burden of data complexity Think small, win big to optimise and streamline decision making Forecast salesR&D costs Strike the right balance: internal/external resources Key lessons to reduce R&D costs Key strategies to improve commercial success Forecast sales R&D costs Aim for therapy area focus Adhere to robust Target Product Profile Generate evidence to support all stakeholder needs Align end-to-end decision-making across the organisation Target populations where value can be maximised R&D costs per asset have stabilised for the original large-cap biopharma cohort but forecast peak sales per asset continue to decline Extension cohort of mid-tier biopharma companies also sees returns decrease in 2016 2013 17.4% 2014 17.7% 2015 16.1% 2016 9.9% R&D costs Forecast sales Extension cohort of mid-tier biopharma companies are still outperforming their larger peers 9% lower average cost to develop an asset, 2014-16 132% higher average peak sales, 2014-16 Extension cohort Average returns, 2014-16 14.1%