SlideShare a Scribd company logo
How to assess qualitative results at
rights’ holders and institutional level
An introduction to scales for performance measurements
ABSTRACT
How ‘good’ is good when we strive to promote women’s
empowerment, to strengthen resilience to natural or man-made
disasters, or to promote food security? When is ‘good’ good
enough? This document introduces scales to measure the
qualitative results of your work.
Strategihuset, Malene Sønderskov
1. The challenge
How ‘good’ is good when we strive to promote women’s
empowerment, to strengthen resilience or to promote
food security among poor and marginalised population
groups? And when is ‘good’ good enough when we
promote sustainable changes in people’s lives or in an
organisation’s capacity to fight for the rights of the poor?
Despite all their good intentions, a majority of NGOs do
not have the benefit of the correct information and/or
tools to be able to determine the quality and scope of
their results. They find it hard to course-correct when
they are off track, and few have a reliable way of knowing
whether they’re doing meaningful, and measurable, good
for those they serve.
The reasons for this are manifold. One is that assessing
and documenting the qualitative impact that social
change interventions have, in people’s lives or the lives of
organisations can be a challenge, and what’s more they
can be difficult to account for. Challenges include issues
such as:
 How do we understand and verify our contribution
to poverty reduction in a complex environment with
multiple actors?
 How can we validate that the short and intermediate
outcomes, which we are able to achieve in a three-
five year program period, will eventually lead to
longer-term impacts in terms of resilience,
government accountability and access to rights?
 How do we aggregate data from a variety of
interventions, in various geographic and thematic
areas of work, without smothering ourselves, and
the people we work, with in endless, cumbersome
and bureaucratic data collection procedures?
 And last – but not least; can data collection be
organised in a spirit of curiosity, learning and
reflection, rather than in a culture of ‘command and
control’?
2. The most common responses and their
shortcomings
In an effort to account our results, many of us resort to
counting activities or the amount of people we have
reached.
Another commonly used approach is to map the planned
and unplanned outcomes of our work, or to collect
change stories and testimonies from beneficiaries of our
work.
Counting activities, output and rights’ holders can be very
helpful, in terms of documenting that we are following
our work plan and our contract as expected.
Mapping outcomes and collecting testimonies may help
us understand the outcomes we achieve, as well as the
“how and why”, but these methods give limited support
to a more detailed and exact account of the same
outcomes. These methods are also not particularly
suitable for assessing the quality of our outcomes, which
are often the preconditions to implementing long-term
goals for positive and sustainable change in people’s lives.
Outcomes such as ‘resilience’, ‘agency’ or
‘empowerment’, which are often at the heart of what we
do, are hard to measure by counting. And while
testimonies and change stories often capture the
qualitative progress in informants’ feelings, skills,
behaviours or relationships effectively, it can be hard to
argue that changes, traced in testimonies, are
representative of anyone other than the informant
him/herself.
For these reasons, the key challenge in measuring
outcomes and the results of our work remains; how can
we account, in a more systematic way, for the qualitative
changes that are at the heart of so much of what we do,
in order to create sustainable improvements in people’s
lives?
3. Between counting and testimonies-
what can we do?
Adopting a scale-based assessment methodology can
help us to overcome some of the aforementioned
challenges, as it allows us to monitor what are usually
considered qualitative outcomes, among a broader group
of people, systematically.
A scale is a tool that can help provide an evaluative
description of what ‘performance’ or ‘quality’ looks like,
in qualitative areas such as ‘empowerment’, ‘agency’ or
‘resilience‘. It can help us assess the value of an
intervention to the people or organisations that a
program, or project, is seeking to benefit.
It is important to note that using scales does not solve the
problem of verifying how our interventions contribute to
wider societal changes, such as poverty reduction or the
promotion of democratic societies at a wider level. In
order to do this we would need a more thorough
contribution analysis. However, scales can help us
validate that the short and intermediate outcomes, which
we are able to achieve in a three-five year program
period, will eventually lead to longer-term impacts in
terms of resilience, government accountability and access
to rights.
Scales can also provide a useful contribution to the
aggregation of data from a variety of interventions, in
various geographic and thematic areas of work, if the
same standard model to a scaleis applied.
Rating Explanation
Excellent Clear examples(s) of exemplary
performance exist(s). No weaknesses.
Independent of the intervention.
Very good Very good performance in all aspects.
Strong overall; a need remains for
occasional support.
Good Reasonably good performance overall.
Regular support still required.
Inadequate Fair performance. Some serious
weaknesses on key aspects. Active
only with support.
Poor Clear evidence of unsatisfactory
function, Serious weaknesses across
the board on crucial aspects.
Table1: Example of a standard scale that can be used to
categorise performance in specific areas of an intervention
4. Scales versus indicators – what is the
difference?
Finally, many of us struggle to identify indicators that
capture the complexity or our work in one single indicator
of ‘sign of proof’, which will confirm that our intervention
has contributed to the desired result. Scales have the
benefit of “adding flesh” to these indicators to make then
more visible and relevant to the reality of the world in
which we operate.
Although scales may be broader in their description of a
situation than indicators, they may help us to describe the
‘fuller picture’ of a situation, at a given performance level
that relates to qualitative outcomes of our work. They
also allow us to embrace some of the complexity that is
often associated with social change.
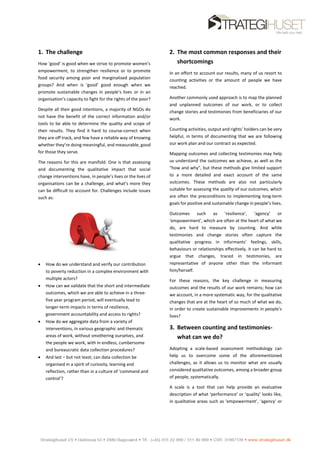
The difference between indicators and scales is
illustrated, graphically, below:
Empowerment,
resilience,
institutional
capacity etc.
Empowerment,
resilience,
institutional
capacity etc.
1. What we want to measure
3. What scales can add: A wider
coverage of the situation than single
indicators
2. What we usually do: Find a few
indicators (some might be
more ‘spot on’ than others)
5. How are scales developed and used for
monitoring and learning?
Step 1. Formulating a scale
Scales consist of ‘ladders’ or ‘phases’ with measurable
steps where participants, rights’ holders and/or targets
for an intervention can move upwards towards a desired
level. This helps to determine the degree to which
interventions have attained their results and can show if
the intervention has reached a desirable level, of
empowerment or ‘organisational capacity’, for example.
Ideally scales should be developed in a participatory
manner, in order to ensure that the voices and values of
all stakeholders were taken into account when the scale
was developed.
A participatory approach helps project planners and
implementers alike to create a deeper and cohesive
understanding of what is really important in their
intervention, and what ‘performance’ looks like in
practical terms in various situations; from the very poor
to the most excellent.
A participatory approach will strengthen ownership and
an understanding of the benefits of using scales. It can
also prevent staff members from perceiving scales as a
tool for ‘command and control’, but rather as part of a
reciprocal process of reflection and learning for the entire
organisation.
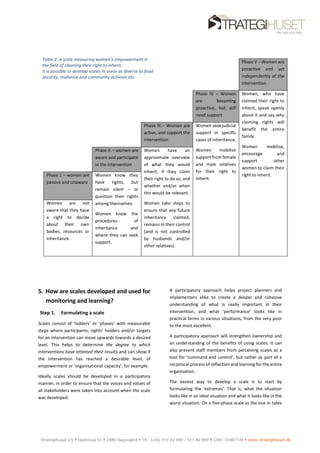
The easiest way to develop a scale is to start by
formulating the ‘extremes’. That is, what the situation
looks like in an ideal situation and what it looks like in the
worst situation. On a five-phase scale as the one in table
Phase V – Women are
proactive and act
independently of the
intervention
Phase IV – Women
are becoming
proactive, but still
need support
Women, who have
claimed their right to
inherit, speak openly
about it and say why
claiming rights will
benefit the entire
family.
Women mobilise,
encourage and
support other
women to claim their
right to inherit.
Phase III – Women are
active, and support the
intervention
Women seek judicial
support in specific
cases of inheritance.
Women mobilise
support from female
and male relatives
for their right to
inherit.
Phase II – women are
aware and participate
in the intervention
Women have an
approximate overview
of what they would
inherit, if they claim
their right to do so, and
whether and/or when
this would be relevant.
Women take steps to
ensure that any future
inheritance claimed,
remains in their control
(and is not controlled
by husbands and/or
other relatives).
Phase 1 – women are
passive and unaware
Women know they
have rights, but
remain silent – or
question their rights
among themselves.
Women know the
procedures of
inheritance and
where they can seek
support.
Women are not
aware that they have
a right to decide
about their own
bodies, resources or
inheritance.
Table 2: A scale measuring women’s empowerment in
the field of claiming their right to inherit.
It is possible to develop scales in areas as diverse as food
security, resilience and community activism etc.
two this would equate to Phases Five and One
respectively.
Once the situation in these two phases has been
described, it is easier to formulate how the situation could
look in-between in Phases two, three and four.
Step 2. Creating a baseline - Categorising
targets for the intervention
Using scales to measure outcomes and progress is not
difficult. In fact the hardest part is identifying the optimal
outcome sequence/identifying the content of the
outcome phases, for the people that we target in our
intervention, as illustrated in table II.
Once this conceptual work has been completed, the
means for measuring short-term and intermediate
outcomes will become clear.
In order to do this, program implementers should place
the targets or rights’ holders for the intervention, under
the phase or phases in the scale that best match their
characteristics.
To determine the best match, various data collection
methodologies can be used, including:
 Observing the behaviours and attitudes of targets
 Conducting semi-structured or focused group
interviews
 Asking targets to complete a questionnaire or test
 Asking targets to participate in a self-assessment and
to indicate which of the categories they think best
match their feelings, attitudes and practices.
It is important that more than one data collection
methodology – and ideally three – is used for the
categorisation. This will strengthen its accuracy, although
the assessment will always remain approximate as none
of the categories are likely to match any one person to a
hundred percent.
The location of target groups, under the relevant phase or
phases at the onset of the intervention, is useful both as
an input to creating a performance baseline as well as for
assessing the progress and performance of our
interventions during the implementation. This location is
decided by the project implementers and planners, as
they are the ones who will identify which of the categories
in their scale best reflect the description of their rights’
holders, or the institutions that they work with.
When the first measurements are made, it is likely that
rights’ holders/targets will be best characterised by the
descriptions under Phases one or two, especially if the
intervention concerns a group, that has not been targeted
before. The outcome of the categorisation may be more
diversified, if the group consists of ‘old’ as well as new
rights’ holders or targets.
Step 3. Measuring progress
As mentioned earlier, categorising rights’ holders or
targets in your scale, at the onset of your intervention,
will build the intervention’s performance baseline.
(However, this can also be constructed retrospectively, if
no baseline was made at the onset of the intervention.
For instance you can do this by interviewing targets about
their attitudes and feelings at the onset of the project.)
Depending on the nature of your intervention and how
quickly changes are likely to happen, you may repeat the
exercise described in Step two either on an annual or
semi-annual basis in order to trace its progress.
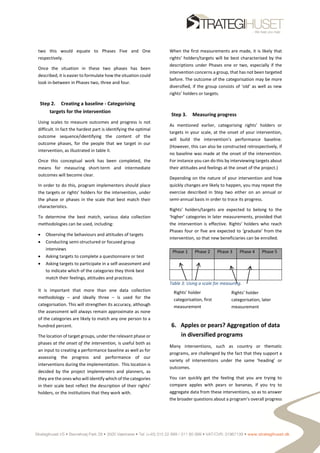
Rights’ holders/targets are expected to belong to the
‘higher’ categories in later measurements, provided that
the intervention is effective. Rights’ holders who reach
Phases four or five are expected to ‘graduate’ from the
intervention, so that new beneficiaries can be enrolled.
Table 3: Using a scale for measuring.
6. Apples or pears? Aggregation of data
in diversified programs
Many interventions, such as country or thematic
programs, are challenged by the fact that they support a
variety of interventions under the same ‘heading’ or
outcomes.
You can quickly get the feeling that you are trying to
compare apples with pears or bananas, if you try to
aggregate data from these interventions, so as to answer
the broader questions about a program’s overall progress
Phase 1 Phase 2 Phase 3 Phase 4 Phase 5
Rights’ holder
categorisation, later
measurement
Rights’ holder
categorisation, first
measurement
or contribution to outcomes, such as community
resilience, food security of accountability.
Scales can help alleviate this problem as they allow the
country or thematic program to answer broad questions
about the program’s overall progress towards outcomes.
At the same time they leave room for a reflection of the
individual characteristics of each intervention under the
program.
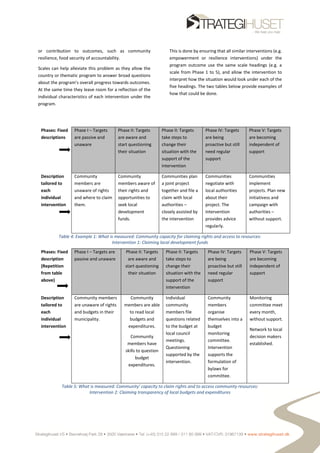
This is done by ensuring that all similar interventions (e.g.
empowerment or resilience interventions) under the
program outcome use the same scale headings (e.g. a
scale from Phase 1 to 5), and allow the intervention to
interpret how the situation would look under each of the
five headings. The two tables below provide examples of
how that could be done.
Phases: Fixed
descriptions
Phase I – Targets
are passive and
unaware
Phase II: Targets
are aware and
start questioning
their situation
Phase II: Targets
take steps to
change their
situation with the
support of the
intervention
Phase IV: Targets
are being
proactive but still
need regular
support
Phase V: Targets
are becoming
independent of
support
Description
tailored to
each
individual
intervention
Community
members are
unaware of rights
and where to claim
them.
Community
members aware of
their rights and
opportunities to
seek local
development
funds.
Communities plan
a joint project
together and file a
claim with local
authorities –
closely assisted by
the intervention
Communities
negotiate with
local authorities
about their
project. The
Intervention
provides advice
regularly.
Communities
implement
projects. Plan new
initiativess and
campaign with
authorities –
without support.
Table 4: Example 1: What is measured: Community capacity for claiming rights and access to resources:
Intervention 1: Claiming local development funds
Phases: Fixed
description
(Repetition
from table
above)
Phase I – Targets are
passive and unaware
Phase II: Targets
are aware and
start questioning
their situation
Phase II: Targets
take steps to
change their
situation with the
support of the
intervention
Phase IV: Targets
are being
proactive but still
need regular
support
Phase V: Targets
are becoming
independent of
support
Description
tailored to
each
individual
intervention
Community members
are unaware of rights
and budgets in their
municipality.
Community
members are able
to read local
budgets and
expenditures.
Community
members have
skills to question
budget
expenditures.
Individual
community
members file
questions related
to the budget at
local council
meetings.
Questioning
supported by the
intervention.
Community
members
organise
themselves into a
budget
monitoring
committee.
Intervention
supports the
formulation of
bylaws for
committee.
Monitoring
committee meet
every month,
without support.
Network to local
decision makers
established.
Table 5: What is measured: Community' capacity to claim rights and to access community resources:
Intervention 2: Claiming transparency of local budgets and expenditures
Literature for inspiration:
 E. Jane Davidson, Evaluation Basics
 David Hunter, Working Hard and Working Well
– A practical Guide to Performance
Management
 Mario Morino: Leap of reason. Managing to
outcomes in an era of scarcity
 John Mayne: Contribution analysis: An
approach to exploring cause and effect
 Joy MacKeith, The Development of the
Outcomes Star: A Participatory Approach to
Assessment and Outcome Measurement

More Related Content

Similar to Measuring qualitative changes - an introduction

Introduction to advocacy cycle by gboneme sandra
Introduction to advocacy cycle  by gboneme sandraIntroduction to advocacy cycle  by gboneme sandra
Introduction to advocacy cycle by gboneme sandra
Sandra Gboneme
 
Pesuading Policy Makers: Effective CIT Program Evaluation and Public Relations
Pesuading Policy Makers: Effective CIT Program Evaluation and Public Relations Pesuading Policy Makers: Effective CIT Program Evaluation and Public Relations
Pesuading Policy Makers: Effective CIT Program Evaluation and Public Relations
citinfo
 
Recruitment & selection ch# 15 & 16
Recruitment & selection ch# 15 & 16Recruitment & selection ch# 15 & 16
Recruitment & selection ch# 15 & 16
Dreams Design
 
How is Who. Empowering evidence for sustainability and public health interven...
How is Who. Empowering evidence for sustainability and public health interven...How is Who. Empowering evidence for sustainability and public health interven...
How is Who. Empowering evidence for sustainability and public health interven...
University of Amsterdam and University College London
 
HFG Health Governance Presentation at 2015 USAID Global Health Mini-University
HFG Health Governance Presentation at 2015 USAID Global Health Mini-UniversityHFG Health Governance Presentation at 2015 USAID Global Health Mini-University
HFG Health Governance Presentation at 2015 USAID Global Health Mini-University
HFG Project
 
People Change - Part 2
People Change - Part 2People Change - Part 2
People Change - Part 2
Robert Topley
 
Campaign Planning by WILPF
Campaign Planning by WILPFCampaign Planning by WILPF
Campaign Planning by WILPF
C.J. Minster
 
Realist Evaluation : some thoughts about the theoretical foundations
Realist Evaluation : some thoughts about the theoretical foundationsRealist Evaluation : some thoughts about the theoretical foundations
Realist Evaluation : some thoughts about the theoretical foundations
valéry ridde
 
Running head PSYCHOLOGY1PSYCHOLOGY7Programmatic pur.docx
Running head PSYCHOLOGY1PSYCHOLOGY7Programmatic pur.docxRunning head PSYCHOLOGY1PSYCHOLOGY7Programmatic pur.docx
Running head PSYCHOLOGY1PSYCHOLOGY7Programmatic pur.docx
toltonkendal
 
ConsumerVoice
ConsumerVoiceConsumerVoice
ConsumerVoice
Phil Basso
 
SOCW 6311 wk 8 peer responses Respond to at least two collea.docx
SOCW 6311 wk 8 peer responses Respond to at least two collea.docxSOCW 6311 wk 8 peer responses Respond to at least two collea.docx
SOCW 6311 wk 8 peer responses Respond to at least two collea.docx
samuel699872
 
20200507_010443.jpg20200507_010448.jpg20200507_010502.jp.docx
20200507_010443.jpg20200507_010448.jpg20200507_010502.jp.docx20200507_010443.jpg20200507_010448.jpg20200507_010502.jp.docx
20200507_010443.jpg20200507_010448.jpg20200507_010502.jp.docx
eugeniadean34240
 
20200507_010443.jpg20200507_010448.jpg20200507_010502.jp.docx
20200507_010443.jpg20200507_010448.jpg20200507_010502.jp.docx20200507_010443.jpg20200507_010448.jpg20200507_010502.jp.docx
20200507_010443.jpg20200507_010448.jpg20200507_010502.jp.docx
novabroom
 
Program Evaluation Studies TK Logan and David Royse .docx
Program Evaluation Studies TK Logan and David Royse .docxProgram Evaluation Studies TK Logan and David Royse .docx
Program Evaluation Studies TK Logan and David Royse .docx
stilliegeorgiana
 
TOCs for program planning
TOCs for program planningTOCs for program planning
TOCs for program planning
Malene Sønderskov
 
Organizational behaviour
Organizational behaviourOrganizational behaviour
Organizational behaviour
Lamech Franklin
 
Assessing a Healthcare.docx
Assessing a Healthcare.docxAssessing a Healthcare.docx
Assessing a Healthcare.docx
4934bk
 
Administrative Accountability
Administrative AccountabilityAdministrative Accountability
Administrative Accountability
Department of Education - Philippines
 
research proposal 2
research proposal 2research proposal 2
research proposal 2
Rebecca Rothstein
 
Program Logic
Program LogicProgram Logic
Program Logic
HealthSpace
 

Similar to Measuring qualitative changes - an introduction (20)

Introduction to advocacy cycle by gboneme sandra
Introduction to advocacy cycle  by gboneme sandraIntroduction to advocacy cycle  by gboneme sandra
Introduction to advocacy cycle by gboneme sandra
 
Pesuading Policy Makers: Effective CIT Program Evaluation and Public Relations
Pesuading Policy Makers: Effective CIT Program Evaluation and Public Relations Pesuading Policy Makers: Effective CIT Program Evaluation and Public Relations
Pesuading Policy Makers: Effective CIT Program Evaluation and Public Relations
 
Recruitment & selection ch# 15 & 16
Recruitment & selection ch# 15 & 16Recruitment & selection ch# 15 & 16
Recruitment & selection ch# 15 & 16
 
How is Who. Empowering evidence for sustainability and public health interven...
How is Who. Empowering evidence for sustainability and public health interven...How is Who. Empowering evidence for sustainability and public health interven...
How is Who. Empowering evidence for sustainability and public health interven...
 
HFG Health Governance Presentation at 2015 USAID Global Health Mini-University
HFG Health Governance Presentation at 2015 USAID Global Health Mini-UniversityHFG Health Governance Presentation at 2015 USAID Global Health Mini-University
HFG Health Governance Presentation at 2015 USAID Global Health Mini-University
 
People Change - Part 2
People Change - Part 2People Change - Part 2
People Change - Part 2
 
Campaign Planning by WILPF
Campaign Planning by WILPFCampaign Planning by WILPF
Campaign Planning by WILPF
 
Realist Evaluation : some thoughts about the theoretical foundations
Realist Evaluation : some thoughts about the theoretical foundationsRealist Evaluation : some thoughts about the theoretical foundations
Realist Evaluation : some thoughts about the theoretical foundations
 
Running head PSYCHOLOGY1PSYCHOLOGY7Programmatic pur.docx
Running head PSYCHOLOGY1PSYCHOLOGY7Programmatic pur.docxRunning head PSYCHOLOGY1PSYCHOLOGY7Programmatic pur.docx
Running head PSYCHOLOGY1PSYCHOLOGY7Programmatic pur.docx
 
ConsumerVoice
ConsumerVoiceConsumerVoice
ConsumerVoice
 
SOCW 6311 wk 8 peer responses Respond to at least two collea.docx
SOCW 6311 wk 8 peer responses Respond to at least two collea.docxSOCW 6311 wk 8 peer responses Respond to at least two collea.docx
SOCW 6311 wk 8 peer responses Respond to at least two collea.docx
 
20200507_010443.jpg20200507_010448.jpg20200507_010502.jp.docx
20200507_010443.jpg20200507_010448.jpg20200507_010502.jp.docx20200507_010443.jpg20200507_010448.jpg20200507_010502.jp.docx
20200507_010443.jpg20200507_010448.jpg20200507_010502.jp.docx
 
20200507_010443.jpg20200507_010448.jpg20200507_010502.jp.docx
20200507_010443.jpg20200507_010448.jpg20200507_010502.jp.docx20200507_010443.jpg20200507_010448.jpg20200507_010502.jp.docx
20200507_010443.jpg20200507_010448.jpg20200507_010502.jp.docx
 
Program Evaluation Studies TK Logan and David Royse .docx
Program Evaluation Studies TK Logan and David Royse .docxProgram Evaluation Studies TK Logan and David Royse .docx
Program Evaluation Studies TK Logan and David Royse .docx
 
TOCs for program planning
TOCs for program planningTOCs for program planning
TOCs for program planning
 
Organizational behaviour
Organizational behaviourOrganizational behaviour
Organizational behaviour
 
Assessing a Healthcare.docx
Assessing a Healthcare.docxAssessing a Healthcare.docx
Assessing a Healthcare.docx
 
Administrative Accountability
Administrative AccountabilityAdministrative Accountability
Administrative Accountability
 
research proposal 2
research proposal 2research proposal 2
research proposal 2
 
Program Logic
Program LogicProgram Logic
Program Logic
 

Measuring qualitative changes - an introduction

  • 1. How to assess qualitative results at rights’ holders and institutional level An introduction to scales for performance measurements ABSTRACT How ‘good’ is good when we strive to promote women’s empowerment, to strengthen resilience to natural or man-made disasters, or to promote food security? When is ‘good’ good enough? This document introduces scales to measure the qualitative results of your work. Strategihuset, Malene Sønderskov
  • 2. 1. The challenge How ‘good’ is good when we strive to promote women’s empowerment, to strengthen resilience or to promote food security among poor and marginalised population groups? And when is ‘good’ good enough when we promote sustainable changes in people’s lives or in an organisation’s capacity to fight for the rights of the poor? Despite all their good intentions, a majority of NGOs do not have the benefit of the correct information and/or tools to be able to determine the quality and scope of their results. They find it hard to course-correct when they are off track, and few have a reliable way of knowing whether they’re doing meaningful, and measurable, good for those they serve. The reasons for this are manifold. One is that assessing and documenting the qualitative impact that social change interventions have, in people’s lives or the lives of organisations can be a challenge, and what’s more they can be difficult to account for. Challenges include issues such as:  How do we understand and verify our contribution to poverty reduction in a complex environment with multiple actors?  How can we validate that the short and intermediate outcomes, which we are able to achieve in a three- five year program period, will eventually lead to longer-term impacts in terms of resilience, government accountability and access to rights?  How do we aggregate data from a variety of interventions, in various geographic and thematic areas of work, without smothering ourselves, and the people we work, with in endless, cumbersome and bureaucratic data collection procedures?  And last – but not least; can data collection be organised in a spirit of curiosity, learning and reflection, rather than in a culture of ‘command and control’? 2. The most common responses and their shortcomings In an effort to account our results, many of us resort to counting activities or the amount of people we have reached. Another commonly used approach is to map the planned and unplanned outcomes of our work, or to collect change stories and testimonies from beneficiaries of our work. Counting activities, output and rights’ holders can be very helpful, in terms of documenting that we are following our work plan and our contract as expected. Mapping outcomes and collecting testimonies may help us understand the outcomes we achieve, as well as the “how and why”, but these methods give limited support to a more detailed and exact account of the same outcomes. These methods are also not particularly suitable for assessing the quality of our outcomes, which are often the preconditions to implementing long-term goals for positive and sustainable change in people’s lives. Outcomes such as ‘resilience’, ‘agency’ or ‘empowerment’, which are often at the heart of what we do, are hard to measure by counting. And while testimonies and change stories often capture the qualitative progress in informants’ feelings, skills, behaviours or relationships effectively, it can be hard to argue that changes, traced in testimonies, are representative of anyone other than the informant him/herself. For these reasons, the key challenge in measuring outcomes and the results of our work remains; how can we account, in a more systematic way, for the qualitative changes that are at the heart of so much of what we do, in order to create sustainable improvements in people’s lives? 3. Between counting and testimonies- what can we do? Adopting a scale-based assessment methodology can help us to overcome some of the aforementioned challenges, as it allows us to monitor what are usually considered qualitative outcomes, among a broader group of people, systematically. A scale is a tool that can help provide an evaluative description of what ‘performance’ or ‘quality’ looks like, in qualitative areas such as ‘empowerment’, ‘agency’ or
  • 3. ‘resilience‘. It can help us assess the value of an intervention to the people or organisations that a program, or project, is seeking to benefit. It is important to note that using scales does not solve the problem of verifying how our interventions contribute to wider societal changes, such as poverty reduction or the promotion of democratic societies at a wider level. In order to do this we would need a more thorough contribution analysis. However, scales can help us validate that the short and intermediate outcomes, which we are able to achieve in a three-five year program period, will eventually lead to longer-term impacts in terms of resilience, government accountability and access to rights. Scales can also provide a useful contribution to the aggregation of data from a variety of interventions, in various geographic and thematic areas of work, if the same standard model to a scaleis applied. Rating Explanation Excellent Clear examples(s) of exemplary performance exist(s). No weaknesses. Independent of the intervention. Very good Very good performance in all aspects. Strong overall; a need remains for occasional support. Good Reasonably good performance overall. Regular support still required. Inadequate Fair performance. Some serious weaknesses on key aspects. Active only with support. Poor Clear evidence of unsatisfactory function, Serious weaknesses across the board on crucial aspects. Table1: Example of a standard scale that can be used to categorise performance in specific areas of an intervention 4. Scales versus indicators – what is the difference? Finally, many of us struggle to identify indicators that capture the complexity or our work in one single indicator of ‘sign of proof’, which will confirm that our intervention has contributed to the desired result. Scales have the benefit of “adding flesh” to these indicators to make then more visible and relevant to the reality of the world in which we operate. Although scales may be broader in their description of a situation than indicators, they may help us to describe the ‘fuller picture’ of a situation, at a given performance level that relates to qualitative outcomes of our work. They also allow us to embrace some of the complexity that is often associated with social change. The difference between indicators and scales is illustrated, graphically, below: Empowerment, resilience, institutional capacity etc. Empowerment, resilience, institutional capacity etc. 1. What we want to measure 3. What scales can add: A wider coverage of the situation than single indicators 2. What we usually do: Find a few indicators (some might be more ‘spot on’ than others)
  • 4. 5. How are scales developed and used for monitoring and learning? Step 1. Formulating a scale Scales consist of ‘ladders’ or ‘phases’ with measurable steps where participants, rights’ holders and/or targets for an intervention can move upwards towards a desired level. This helps to determine the degree to which interventions have attained their results and can show if the intervention has reached a desirable level, of empowerment or ‘organisational capacity’, for example. Ideally scales should be developed in a participatory manner, in order to ensure that the voices and values of all stakeholders were taken into account when the scale was developed. A participatory approach helps project planners and implementers alike to create a deeper and cohesive understanding of what is really important in their intervention, and what ‘performance’ looks like in practical terms in various situations; from the very poor to the most excellent. A participatory approach will strengthen ownership and an understanding of the benefits of using scales. It can also prevent staff members from perceiving scales as a tool for ‘command and control’, but rather as part of a reciprocal process of reflection and learning for the entire organisation. The easiest way to develop a scale is to start by formulating the ‘extremes’. That is, what the situation looks like in an ideal situation and what it looks like in the worst situation. On a five-phase scale as the one in table Phase V – Women are proactive and act independently of the intervention Phase IV – Women are becoming proactive, but still need support Women, who have claimed their right to inherit, speak openly about it and say why claiming rights will benefit the entire family. Women mobilise, encourage and support other women to claim their right to inherit. Phase III – Women are active, and support the intervention Women seek judicial support in specific cases of inheritance. Women mobilise support from female and male relatives for their right to inherit. Phase II – women are aware and participate in the intervention Women have an approximate overview of what they would inherit, if they claim their right to do so, and whether and/or when this would be relevant. Women take steps to ensure that any future inheritance claimed, remains in their control (and is not controlled by husbands and/or other relatives). Phase 1 – women are passive and unaware Women know they have rights, but remain silent – or question their rights among themselves. Women know the procedures of inheritance and where they can seek support. Women are not aware that they have a right to decide about their own bodies, resources or inheritance. Table 2: A scale measuring women’s empowerment in the field of claiming their right to inherit. It is possible to develop scales in areas as diverse as food security, resilience and community activism etc.
  • 5. two this would equate to Phases Five and One respectively. Once the situation in these two phases has been described, it is easier to formulate how the situation could look in-between in Phases two, three and four. Step 2. Creating a baseline - Categorising targets for the intervention Using scales to measure outcomes and progress is not difficult. In fact the hardest part is identifying the optimal outcome sequence/identifying the content of the outcome phases, for the people that we target in our intervention, as illustrated in table II. Once this conceptual work has been completed, the means for measuring short-term and intermediate outcomes will become clear. In order to do this, program implementers should place the targets or rights’ holders for the intervention, under the phase or phases in the scale that best match their characteristics. To determine the best match, various data collection methodologies can be used, including:  Observing the behaviours and attitudes of targets  Conducting semi-structured or focused group interviews  Asking targets to complete a questionnaire or test  Asking targets to participate in a self-assessment and to indicate which of the categories they think best match their feelings, attitudes and practices. It is important that more than one data collection methodology – and ideally three – is used for the categorisation. This will strengthen its accuracy, although the assessment will always remain approximate as none of the categories are likely to match any one person to a hundred percent. The location of target groups, under the relevant phase or phases at the onset of the intervention, is useful both as an input to creating a performance baseline as well as for assessing the progress and performance of our interventions during the implementation. This location is decided by the project implementers and planners, as they are the ones who will identify which of the categories in their scale best reflect the description of their rights’ holders, or the institutions that they work with. When the first measurements are made, it is likely that rights’ holders/targets will be best characterised by the descriptions under Phases one or two, especially if the intervention concerns a group, that has not been targeted before. The outcome of the categorisation may be more diversified, if the group consists of ‘old’ as well as new rights’ holders or targets. Step 3. Measuring progress As mentioned earlier, categorising rights’ holders or targets in your scale, at the onset of your intervention, will build the intervention’s performance baseline. (However, this can also be constructed retrospectively, if no baseline was made at the onset of the intervention. For instance you can do this by interviewing targets about their attitudes and feelings at the onset of the project.) Depending on the nature of your intervention and how quickly changes are likely to happen, you may repeat the exercise described in Step two either on an annual or semi-annual basis in order to trace its progress. Rights’ holders/targets are expected to belong to the ‘higher’ categories in later measurements, provided that the intervention is effective. Rights’ holders who reach Phases four or five are expected to ‘graduate’ from the intervention, so that new beneficiaries can be enrolled. Table 3: Using a scale for measuring. 6. Apples or pears? Aggregation of data in diversified programs Many interventions, such as country or thematic programs, are challenged by the fact that they support a variety of interventions under the same ‘heading’ or outcomes. You can quickly get the feeling that you are trying to compare apples with pears or bananas, if you try to aggregate data from these interventions, so as to answer the broader questions about a program’s overall progress Phase 1 Phase 2 Phase 3 Phase 4 Phase 5 Rights’ holder categorisation, later measurement Rights’ holder categorisation, first measurement
  • 6. or contribution to outcomes, such as community resilience, food security of accountability. Scales can help alleviate this problem as they allow the country or thematic program to answer broad questions about the program’s overall progress towards outcomes. At the same time they leave room for a reflection of the individual characteristics of each intervention under the program. This is done by ensuring that all similar interventions (e.g. empowerment or resilience interventions) under the program outcome use the same scale headings (e.g. a scale from Phase 1 to 5), and allow the intervention to interpret how the situation would look under each of the five headings. The two tables below provide examples of how that could be done. Phases: Fixed descriptions Phase I – Targets are passive and unaware Phase II: Targets are aware and start questioning their situation Phase II: Targets take steps to change their situation with the support of the intervention Phase IV: Targets are being proactive but still need regular support Phase V: Targets are becoming independent of support Description tailored to each individual intervention Community members are unaware of rights and where to claim them. Community members aware of their rights and opportunities to seek local development funds. Communities plan a joint project together and file a claim with local authorities – closely assisted by the intervention Communities negotiate with local authorities about their project. The Intervention provides advice regularly. Communities implement projects. Plan new initiativess and campaign with authorities – without support. Table 4: Example 1: What is measured: Community capacity for claiming rights and access to resources: Intervention 1: Claiming local development funds Phases: Fixed description (Repetition from table above) Phase I – Targets are passive and unaware Phase II: Targets are aware and start questioning their situation Phase II: Targets take steps to change their situation with the support of the intervention Phase IV: Targets are being proactive but still need regular support Phase V: Targets are becoming independent of support Description tailored to each individual intervention Community members are unaware of rights and budgets in their municipality. Community members are able to read local budgets and expenditures. Community members have skills to question budget expenditures. Individual community members file questions related to the budget at local council meetings. Questioning supported by the intervention. Community members organise themselves into a budget monitoring committee. Intervention supports the formulation of bylaws for committee. Monitoring committee meet every month, without support. Network to local decision makers established. Table 5: What is measured: Community' capacity to claim rights and to access community resources: Intervention 2: Claiming transparency of local budgets and expenditures
  • 7. Literature for inspiration:  E. Jane Davidson, Evaluation Basics  David Hunter, Working Hard and Working Well – A practical Guide to Performance Management  Mario Morino: Leap of reason. Managing to outcomes in an era of scarcity  John Mayne: Contribution analysis: An approach to exploring cause and effect  Joy MacKeith, The Development of the Outcomes Star: A Participatory Approach to Assessment and Outcome Measurement