Download to read offline
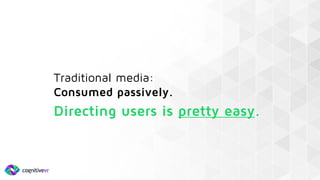
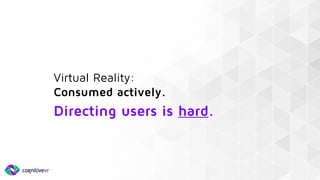
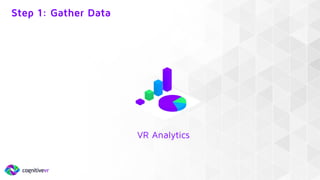
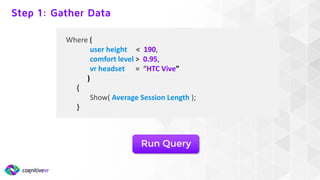
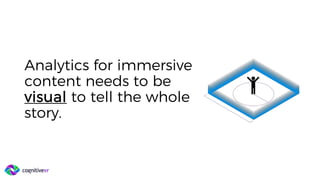
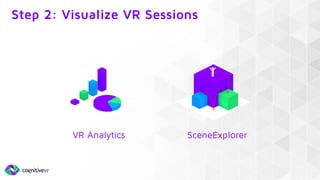
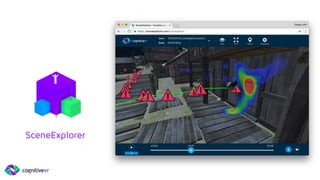
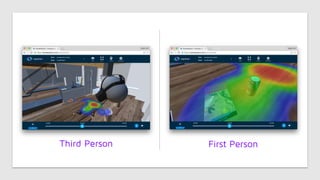
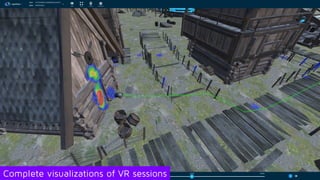
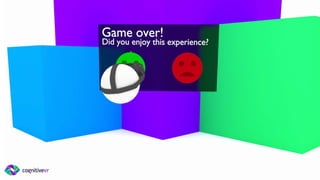
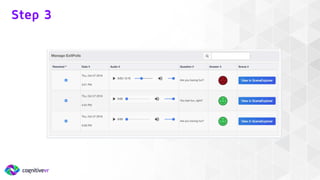
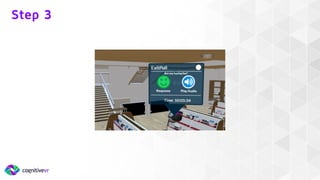
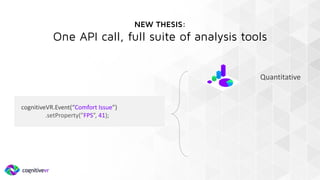
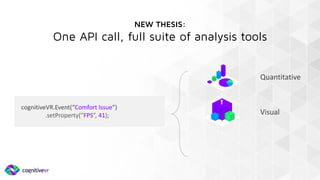
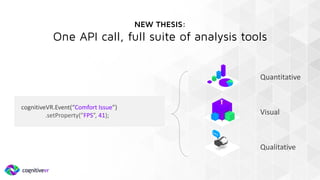
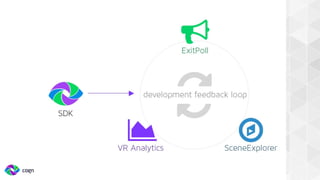

This document discusses developer tools for analyzing virtual reality (VR) experiences. It notes that directing users is harder in VR than traditional media since VR is consumed actively. It outlines a three step process for VR analytics: 1) gather data on user behaviors and characteristics, 2) visualize VR sessions to see what users are doing, and 3) go beyond quantitative data to qualitative insights by seeing sessions from the user's perspective and identifying comfort issues. It introduces a new tool that provides quantitative, visual, and qualitative analytics with a single API call to help developers better understand user experiences.


![5G Explained! A High Level Overview [Introduction]](https://cdn.slidesharecdn.com/ss_thumbnails/5gexplainedahighleveloverview-260119165306-cc137a3e-thumbnail.jpg?width=640&height=640&fit=bounds)


