Enhancing Data Representation:Data Visualization and Artificial Intelligence in Spatial Computing
1.
UNIT 4
Enhancing DataRepresentation: Data Visualization and Artificial Intelligence in
Spatial Computing
Introduction
Spatial computing combines the physical and digital worlds through technologies such as
augmented reality (AR), virtual reality (VR), and mixed reality (MR). Within this context,
data and machine learning visualization design plays a critical role in making complex
information accessible, interpretable, and actionable. The integration of machine learning
(ML) into spatial computing environments enables adaptive, personalized, and predictive
experiences, while visualization provides the interface for human understanding and
decision-making.
Importance of Data Visualization in Spatial Computing
1. Enhanced Understanding of Complex Data: Spatial visualization allows data
scientists, engineers, and end-users to interact with data in three dimensions, making
trends and anomalies easier to perceive.
2. Immersive Analytics: By moving beyond traditional 2D charts and dashboards,
immersive visualizations engage users cognitively and physically, improving
comprehension and retention.
3. Human-Centered Interaction: Visualization bridges the gap between raw machine
learning outputs and meaningful human interpretation, allowing non-experts to
leverage advanced analytics.
Role of Machine Learning in Visualization
1. Pattern Recognition and Prediction: ML algorithms identify patterns within large,
complex datasets and provide predictive insights that can be spatially visualized.
2. Adaptive Visualization Systems: Machine learning enables visualizations that adapt
dynamically to user interactions, preferences, and behaviors.
3. Natural Interaction Support: ML enhances input modalities such as gesture
recognition, eye tracking, and voice commands for more intuitive visualization
exploration.
Design Principles for Visualization in Spatial Computing
1. Contextual Relevance
Visuals should adapt to the user’s environment, task, and purpose.
Meenalochini.M, AP/CSD 22CDT52- VR & AR
2.
Example: InAR healthcare, patient vitals should appear near the patient’s body (not
floating randomly).
Align data overlays with real-world anchors (geographic locations, objects, or user’s
current activity).
2. Minimal Cognitive Load
Avoid overwhelming users with too much information at once.
Use progressive disclosure: reveal data as needed.
Leverage natural affordances (color, shape, spatial proximity) to guide attention.
Example: Instead of showing a large dataset, highlight anomalies or key metrics first.
3. Scalability Across Levels of Detail
Provide both macro-level summaries and micro-level details depending on zoom or
user focus.
Users should seamlessly transition between big-picture trends and detailed data
points.
Example: In urban planning, VR could show city-wide traffic flow, while zooming in
reveals neighborhood-level congestion patterns.
4. Accessibility and Inclusivity
Design for diverse users with different sensory abilities.
Incorporate multimodal cues:
o Visual (colors, spatial placement)
o Auditory (alerts, spoken feedback)
o Haptic (vibration, pressure feedback)
Avoid over-reliance on color-only indicators (e.g., red-green distinctions).
5. Real-Time Responsiveness
Data updates must appear without noticeable lag, especially in simulations or
monitoring systems.
ML-driven predictive models should update visualizations instantly when new inputs
arrive.
Example: In financial VR dashboards, stock prices should update live with no
noticeable delay.
6. Natural User Interaction
Support intuitive interactions such as:
Meenalochini.M, AP/CSD 22CDT52- VR & AR
3.
o Gestures (pinchto zoom in AR)
o Eye-tracking (focus-based selection)
o Voice commands for filtering or querying data
Example: A scientist in VR could point at a molecule to highlight its atomic
properties.
7. Narrative and Storytelling
Data is more meaningful when presented as a story rather than raw numbers.
Spatial computing enables immersive data-driven narratives where users explore
scenarios dynamically.
Example: Climate change VR showing rising sea levels by gradually filling virtual
cityscapes with water.
Development Approaches
1. Data Pipelines for Spatial Systems
Real-time Data Integration: Spatial computing often requires live data (e.g., IoT
sensors, biomedical devices, stock markets). Pipelines must handle streaming data
efficiently.
ETL in Immersive Environments: Extract, Transform, Load processes adapt for
3D/AR/VR contexts. Data must be pre-processed to balance accuracy and rendering
speed.
Cloud + Edge Processing: Cloud provides scalability, while edge devices (headsets,
AR glasses) ensure low-latency visualization.
Example: In AR-assisted manufacturing, sensor data from machines flows into a visualization
pipeline that shows predictive maintenance warnings directly on equipment.
2. Visualization Frameworks and Toolkits
Unity & Unreal Engine: Widely used for building AR/VR experiences. They
provide APIs for integrating data visualizations (graphs, heatmaps, volumetric
rendering).
WebXR / WebAR / WebVR: Allow browser-based immersive data visualizations
accessible without heavy software installations.
Specialized Toolkits:
o D3.js integrated with WebXR for interactive 3D charts.
o A-Frame (open-source framework) for AR/VR visualization.
o NVIDIA Omniverse for collaborative spatial simulations.
Meenalochini.M, AP/CSD 22CDT52- VR & AR
4.
Example: Unity +TensorFlow integration allows real-time ML-driven object recognition
visualized directly in a VR environment.
3. Integration with Machine Learning Models
Model Deployment: ML models (TensorFlow, PyTorch, ONNX) can be embedded
into visualization pipelines for real-time inference.
Adaptive Visualization: Visualizations adjust based on ML outputs—highlighting
anomalies, clustering data, or forecasting trends.
Predictive Simulation: ML models enable “what-if” analysis by dynamically
changing scenarios in VR/AR.
Example: A VR city simulation powered by ML predicts traffic congestion and visualizes it
in real-time as traffic density heatmaps.
4. Interaction Design & User Experience
Multimodal Interfaces: Gesture recognition, eye tracking, haptic feedback, and
voice commands for intuitive interaction.
Personalization: ML adapts visualization complexity to user expertise (novice vs
expert).
Collaborative Visualization: Shared VR spaces allow multiple users to analyze and
interact with the same dataset.
Example: In VR classrooms, students collaboratively manipulate 3D data models using hand
gestures.
5. Testing and Iteration
Usability Testing in Immersive Environments: Requires measuring cognitive load,
spatial awareness, and interaction efficiency.
A/B Testing with ML-driven Visualizations: Compare effectiveness of different
layouts, color schemes, or interaction styles.
Iterative Development: Frequent prototyping ensures that performance, comfort, and
clarity improve over time.
Example: In healthcare AR, iterative testing ensures doctors can interpret patient scans
quickly without distraction or fatigue.
6. Performance Optimization
Meenalochini.M, AP/CSD 22CDT52- VR & AR
5.
Latency Reduction:Immersive systems demand sub-20ms latency for a smooth
experience.
Level of Detail (LOD): Use adaptive rendering where detail increases only in areas
the user focuses on.
Data Compression: Optimize large datasets for rendering in real-time (point clouds,
3D models).
Example: Streaming millions of geospatial points in VR requires LOD techniques to maintain
fluid interactivity.
Applications
1. Healthcare and Medicine
Surgical Assistance (AR): Doctors visualize patient anatomy overlaid directly on the
body during operations.
Diagnostic Support: ML models analyze scans (MRI, CT, X-ray) and display 3D
anomalies interactively in VR.
Rehabilitation & Therapy: Immersive biofeedback environments visualize patient
progress in real time.
2. Urban Planning and Smart Cities
Traffic Simulation: VR/AR platforms visualize real-time traffic flow, congestion,
and predictive routing.
Infrastructure Design: Architects overlay 3D models on physical construction sites
using AR.
Environmental Monitoring: ML-based climate models visualized spatially for flood,
pollution, or heat risk assessment.
3. Education and Training
Immersive Classrooms: Complex scientific concepts (DNA structures, physics
simulations) explored in 3D.
Workforce Training: Industrial workers train on AR/VR simulations of hazardous
environments safely.
Adaptive Learning: ML customizes difficulty levels and content visualization per
learner’s pace.
4. Scientific Research
Meenalochini.M, AP/CSD 22CDT52- VR & AR
6.
Molecular Visualization:Chemists interactively explore protein structures and drug
binding in 3D VR.
Astrophysics: Visualization of galaxies, black holes, or cosmic radiation patterns
with real-time data overlays.
Climate Science: ML-driven climate predictions displayed in immersive simulations.
5. Business Intelligence and Analytics
Executive Dashboards in VR: 3D data cubes, heatmaps, and immersive charts
provide big-picture insights.
Retail Analytics: AR visualizations overlay real-time sales, customer movement, and
shelf inventory in stores.
Financial Modeling: Risk simulations and market forecasts visualized as immersive
scenarios.
6. Defense and Security
Situational Awareness: AR overlays battlefield intelligence (troop positions, terrain
data) in real-time.
Threat Detection: ML visualizes anomalous patterns in surveillance data.
Training Simulations: Immersive environments replicate combat or emergency
response scenarios.
Challenges and Future Directions
1. Data Complexity and Volume
Challenge: Handling massive datasets (e.g., genomics, IoT sensors, financial
transactions) in real-time VR/AR.
Future Direction: Edge AI + cloud hybrid processing pipelines to balance speed and
scalability.
2. Usability and Ergonomics
Challenge: Prolonged use of headsets causes fatigue, motion sickness, and reduced
attention span.
Future Direction: Lightweight, ergonomic AR glasses + adaptive visual layouts to
reduce strain.
3. Ethical and Social Considerations
Meenalochini.M, AP/CSD 22CDT52- VR & AR
7.
Challenge: ML-drivenvisualizations may amplify bias, mislead users, or obscure
data provenance.
Future Direction: Transparent AI (explainable ML models) and ethical
visualization guidelines for fairness and accountability.
4. Interoperability and Standards
Challenge: Lack of universal frameworks for spatial data representation across
platforms (Unity, Unreal, WebXR).
Future Direction: Open standards (like Khronos Group’s OpenXR) for cross-
platform visualization.
5. Real-Time Responsiveness
Challenge: Latency above ~20ms breaks immersion, especially in VR data
monitoring.
Future Direction: Hardware acceleration (GPUs, neural processors) + predictive
rendering to reduce lag.
6. Security and Privacy
Challenge: Visualizing sensitive data (health, defense, finance) in AR/VR raises risks
of breaches.
Future Direction: End-to-end encrypted pipelines, federated learning, and privacy-
preserving ML models.
7. Human Factors and Collaboration
Challenge: Designing intuitive collaboration in shared AR/VR spaces without
overwhelming users.
Future Direction: Multi-user immersive data environments with role-based
visualization
Understanding Data Visualization in Spatial Computing
1. The Role of Data Visualization
Data visualization transforms raw, abstract data into visual metaphors that humans
can intuitively interpret.
In traditional computing, this means 2D charts, graphs, and dashboards.
Meenalochini.M, AP/CSD 22CDT52- VR & AR
8.
In spatialcomputing (AR/VR/MR), visualization becomes experiential — users
perceive and interact with data as if it occupies the same space around them.
2. Human Perception and Cognitive Advantage
Humans have highly developed visual-spatial reasoning skills.
Visualization leverages these capabilities, allowing people to:
o Recognize patterns and clusters.
o Detect anomalies quickly.
o Understand complex multidimensional relationships.
In AR/VR, visualizations tap into depth, motion, and embodied interaction,
enhancing cognitive processing beyond flat screens.
3. Data Visualization as a Communication Medium
It serves as a bridge between machines and humans.
Machine learning models often generate high-dimensional outputs (clusters,
probabilities, feature importance). Visualization translates these into forms humans
can understand.
In spatial computing, this communication is enriched through immersive metaphors
(e.g., walking inside a dataset, holding a 3D chart).
4. Interaction and Engagement
Unlike static 2D graphs, immersive data visualization is interactive:
o Users can manipulate, rotate, or filter datasets.
o Data can respond to gaze, gestures, or voice input.
This makes visualization not just a way to see data, but a tool for exploration and
discovery.
5. Narrative and Storytelling
Visualization doesn’t just convey facts — it tells stories through data.
Spatial computing enables data narratives that unfold dynamically:
o A VR simulation might let users move forward in time to see predicted
outcomes.
o An AR overlay might contextualize real-world objects with relevant data.
Storytelling enhances comprehension, especially for non-expert users.
Meenalochini.M, AP/CSD 22CDT52- VR & AR
9.
6. Challenges inUnderstanding Data Visualization in Immersive Contexts
Overload Risk: Too much information in a 3D environment can overwhelm
perception.
Design Complexity: Unlike 2D dashboards, immersive visualizations require
balancing spatial metaphors, scale, and interaction models.
Trust in Data: Users must be assured that the visualization accurately represents the
underlying dataset and ML models.
Principles for Data and Machine Learning Visualization
1. Clarity and Simplicity
Visualizations should reduce complexity, not add to it.
Avoid excessive visual elements that cause cognitive overload.
Use progressive disclosure: present high-level summaries first, then allow drilling
into details.
Example: A VR financial dashboard highlights market anomalies with glowing
markers instead of showing every single datapoint at once.
2. Contextual Relevance
Place data in relation to the environment, task, and user goals.
In AR, data overlays should align with physical objects (e.g., patient vitals above the
body in surgery).
In VR, datasets should be spatially organized to match real-world metaphors (e.g., 3D
city models for urban planning).
3. Human-Centered Design
Always design with the end-user’s cognition and perception in mind.
Use natural interaction modalities: gaze, gestures, touch, voice.
Allow users to control complexity by filtering or focusing on subsets of data.
4. Transparency in ML Outputs
Machine learning predictions should be explained visually.
Include confidence intervals, uncertainty indicators, and data provenance.
Example: In AR medical diagnosis, anomalies could be highlighted with confidence
percentages, giving doctors insight into model reliability.
Meenalochini.M, AP/CSD 22CDT52- VR & AR
10.
5. Scalability andMulti-Resolution Data
Visualizations must support macro-to-micro exploration.
Users should zoom out to see big-picture trends, then zoom in for fine-grained
details.
Example: A geospatial VR platform might show global weather patterns, but zooming
in reveals street-level air quality data.
6. Multimodal Accessibility
Not all users process visual data the same way.
Incorporate auditory (alerts, speech) and haptic feedback (vibrations, tactile cues).
Ensure designs don’t rely only on color coding (important for colorblind users).
7. Real-Time Responsiveness
Data-driven AR/VR systems often deal with live streams (finance, IoT, healthcare).
Visualizations must update instantly with minimal latency to maintain immersion.
Example: A VR operations center for cybersecurity shows network anomalies as soon
as they are detected by ML models.
8. Ethical Visualization
Prevent misleading or biased visualizations.
Clearly differentiate between measured data and predicted/ML-generated data.
Provide transparency about data sources and potential limitations.
9. Narrative and Storytelling
Visualization should not only present facts but also enable data-driven storytelling.
Immersive narratives guide users through cause-effect relationships, simulations, and
predictions.
Example: An AR app for climate change could gradually show rising sea levels on
real-world coastlines.
2D Data Visualizations versus 3D Data Visualization
1. Strengths of 2D Data Visualization
Meenalochini.M, AP/CSD 22CDT52- VR & AR
11.
Simplicity &Familiarity
o Users are accustomed to charts, graphs, scatterplots, and dashboards.
o Low learning curve for general audiences.
Efficiency in Communication
o Best for presenting exact values and well-structured data.
o Works well for quick insights (e.g., sales trends, line graphs).
Low Cognitive Load
o Easier to interpret when datasets are simple or limited in dimensions.
Example: A 2D line chart showing daily temperature changes across a week.
2. Limitations of 2D Visualizations
Poor Representation of High-Dimensional Data
o Difficult to show more than 2–3 variables clearly without clutter.
Lack of Spatial Context
o Cannot represent 3D environments, geospatial relationships, or volumetric
data effectively.
Static Interaction
o Users often consume data passively, with limited exploration options.
3. Strengths of 3D Data Visualization (in Spatial Computing)
Natural Mapping to Real-World Context
o Spatial positioning matches how humans perceive the environment.
o Ideal for geospatial, architectural, biological, or astrophysical datasets.
Immersive Exploration
o Users can walk through, rotate, zoom, and manipulate data directly.
o Creates embodied cognition: people understand data by physically engaging
with it.
High-Dimensional Data Representation
o Multiple variables represented simultaneously using position, depth, color,
motion, and scale.
Example: A VR simulation where climate scientists explore atmospheric CO layers
₂
in a volumetric 3D map.
4. Challenges of 3D Visualizations
Cognitive Overload
o Too much complexity can overwhelm users, especially with cluttered spatial
designs.
Navigation & Orientation Issues
o Users may get lost or disoriented in immersive environments.
Higher Hardware Requirements
Meenalochini.M, AP/CSD 22CDT52- VR & AR
12.
o Rendering largedatasets in real-time 3D requires powerful GPUs and
optimized pipelines.
Risk of Misrepresentation
o Perspective distortions can make data relationships appear misleading.
5. When to Use 2D vs 3D
Best for 2D:
o Simple datasets with few dimensions.
o Dashboards where speed and clarity matter more than immersion.
o Static reporting (business reports, charts, presentations).
Best for 3D (Spatial Computing):
o Data tied to real-world spaces (geography, anatomy, architecture).
o High-dimensional or volumetric data.
o Exploratory analysis where interaction enhances discovery.
Hybrid Approach:
o Many spatial computing applications mix 2D and 3D.
o Example: A VR urban planning tool may use 3D for city models but overlay
2D charts for statistics.
Animation in Data and Machine Learning Visualization
1. Purpose of Animation
Show Change Over Time
o Data often evolves (e.g., stock prices, patient vitals, climate conditions).
o Animation makes trends visible and memorable.
Reveal Cause and Effect
o Users can see how one variable influences another.
Support Data Storytelling
o Instead of static snapshots, data becomes a narrative journey.
2. Benefits of Animation in Spatial Computing
Immersion & Engagement
o Movement grabs attention naturally and helps guide user focus.
Temporal Insights
o Time-series data becomes more understandable when animated.
Enhanced Understanding
o Animation helps users comprehend transitions, progressions, and anomalies.
Prediction & Simulation
o When combined with machine learning, animation can visualize forecasts
dynamically (e.g., predictive traffic flow in a VR city).
Meenalochini.M, AP/CSD 22CDT52- VR & AR
13.
3. Types ofAnimation in Visualization
1. Transition Animations
o Smooth transitions when filtering, zooming, or changing perspectives.
o Prevents disorientation and helps maintain context.
2. Narrative Animations
o Predefined sequences that explain a dataset step-by-step (like a guided tour).
3. Data-Driven Animations
o Movement driven directly by live or simulated data streams (e.g., sensor
readings in real time).
4. Interactive Animations
o Users trigger or control the animation with gaze, gesture, or voice (e.g., saying
“play next 10 years” in a climate model).
4. Best Practices
Purposeful, Not Decorative
o Animation must aid comprehension, not distract.
User Control
o Provide pause, replay, speed adjustment to prevent cognitive overload.
Consistency
o Maintain coherent motion rules across visualizations (e.g., similar types of
data always animate in similar ways).
Highlighting vs. Overloading
o Animate key variables; avoid animating everything at once.
5. Applications of Animation
Healthcare: Animated AR overlays show how a tumor grows or shrinks over time
under treatment.
Education: In VR, animated molecules demonstrate chemical reactions.
Urban Planning: Animated traffic simulations show how policy changes impact
congestion.
Business: Animated financial dashboards reveal trends across markets with predictive
ML overlays.
Scientific Research: Animating astrophysics simulations helps researchers “see”
galactic evolution.
6. Challenges
Overuse Risk: Too much animation can distract or confuse.
Meenalochini.M, AP/CSD 22CDT52- VR & AR
14.
Performance Demands:Smooth, real-time animation requires optimized rendering.
Accuracy vs. Simplification: Animations must balance storytelling with fidelity to
the underlying data.
User Fatigue: Fast or continuous animations in VR/AR may cause discomfort if not
carefully designed.
Data Representations in Spatial Computing
1. Why Data Representation Matters in Spatial Computing
In 2D computing (desktop/web), data representation is mostly about clarity and
precision.
In spatial computing (AR/VR/MR), data is no longer confined to a flat screen — it
is presented in three dimensions, in context, and often interactively.
This shift means that representation has to consider space, depth, motion, scale, and
embodiment (how the user’s body relates to the visualization).
Key Difference: Spatial computing turns data from a picture on a screen into a space the
user can inhabit and manipulate.
2. Types of Data Representations in Spatial Computing
a) Abstract Representations
Traditional graphs, charts, and diagrams reimagined in immersive 3D.
Example: A VR 3D bar chart where users can walk around bars, zoom into clusters,
or touch a bar to see its metadata.
Benefit: Preserves analytical rigor but makes exploration more engaging.
b) Spatially Anchored Representations
Data tied to real-world environments via AR or mixed reality.
Example:
o In AR, pointing your phone/glasses at a car engine shows live sensor data
floating above components.
Meenalochini.M, AP/CSD 22CDT52- VR & AR
15.
o In cityplanning, an AR city model overlays real-time traffic flow on roads.
Benefit: Contextualizes data exactly where it is relevant.
c) Realistic / Photoreal Representations
Data represented as 3D reconstructions of real-world objects.
Example: A 3D MRI scan of the brain where doctors can “slice” through tissue layers
interactively.
Benefit: Helps experts understand spatial structures in medical imaging, geology, or
manufacturing.
d) Symbolic or Metaphorical Representations
Data represented with storytelling metaphors to make it intuitive.
Example:
o A social network visualized as a galaxy, where each star = a user, clusters =
communities.
o A forest metaphor, where each tree = a dataset, branches = categories,
growth = progress.
Benefit: Engages non-technical audiences through memorable visuals.
e) Hybrid Representations
Combining multiple approaches into multi-layered environments.
Example: In VR:
o 3D globe shows climate change data (realistic).
o Floating panels show abstract charts for temperature changes.
o AR overlays let users see the same data on a physical globe in a classroom.
Benefit: Provides both big-picture and detail-level insights.
3. Dimensions of Data Representation in Spatial Computing
1. Scale: Data can be microscopic (molecules) or macroscopic (galaxies). Users can
“zoom” across scales in VR.
2. Embodiment: Users can interact with data physically — e.g., walking through a
scatterplot or grabbing nodes in a graph.
3. Immersion: Representations may fully surround the user (VR) or blend into the
physical world (AR).
4. Dynamics: Representations are not static — they update with live data streams,
animations, or simulations.
5. Collaboration: Representations may be multi-user, allowing shared analysis in a VR
workspace or AR overlay.
Meenalochini.M, AP/CSD 22CDT52- VR & AR
16.
4. Example UseCases by Domain
Healthcare:
o 3D organ reconstructions with overlays of patient vitals.
o VR anatomy training with immersive datasets.
Urban Planning:
o AR overlays of traffic data, pollution levels, and energy use on a city map.
o VR digital twins of smart cities for future scenario testing.
Education:
o AR-enabled textbooks that pop out molecular structures or math graphs.
o VR classrooms where students walk through historical timelines as data
stories.
Astronomy:
o Navigating point clouds of galaxies or star systems in VR.
o Exploring cosmic radiation data as volumetric fields.
Business Analytics:
o Immersive dashboards where managers walk around KPIs in VR.
o AR dashboards overlaying sales or inventory data on warehouses.
5. Design Considerations for Effective Representation
Clarity over Novelty: Immersive design should enhance comprehension, not distract
with gimmicks.
Depth Cues: Use shadows, perspective, and occlusion to help users interpret 3D data.
Interactivity: Users must filter, zoom, and manipulate data to prevent overload.
Accessibility: Avoid over-reliance on color or complex gestures; ensure inclusivity.
Performance: Representations should load quickly and run smoothly in AR/VR
headsets.
Infographics in Spatial Contexts
1. What are Infographics in Spatial Computing?
Traditional infographics: static 2D visuals combining text, charts, icons, and
illustrations to explain data or concepts.
In spatial computing (AR/VR/MR):
o Infographics become immersive, interactive, and situational.
o Instead of being flat posters or dashboards, they are 3D, animated, and
anchored in real or virtual environments.
o They combine visual storytelling, data visualization, and user interaction
in one experience.
Meenalochini.M, AP/CSD 22CDT52- VR & AR
17.
2. Core Characteristicsof Spatial Infographics
a) Immersive Layouts
Instead of scrolling or zooming, users move physically to explore different parts of an
infographic.
Example: A VR infographic on climate change might be a 3D timeline environment,
where walking forward takes you through decades of global warming data.
b) Spatial Anchoring
Infographics can be tied to real-world objects or spaces.
Example: In AR, looking at a building site reveals an infographic floating above it
showing construction progress, costs, and safety metrics.
c) Multimodal Presentation
Spatial infographics use 3D models, animated icons, sound cues, haptic feedback,
and voice narration to enhance comprehension.
Example: A VR health infographic might combine a 3D beating heart model with
animated labels showing blood flow and live stats.
d) Interactive Storytelling
Users don’t just read — they engage:
o Tap or gaze at hotspots to reveal more info.
o Filter datasets (e.g., show only female demographic data in a population
infographic).
o Manipulate 3D models to understand relationships.
3. Examples of Infographics in Spatial Contexts
Education:
o AR-enabled textbooks with 3D pop-up infographics (e.g., solar system model
with planetary data panels).
o VR “data journeys” where students walk through a process (like cell division).
Healthcare:
o AR infographics for patient education (overlaying medical data directly on the
body with anatomy models).
o VR training infographics for doctors showing procedural workflows.
Business & Analytics:
o VR financial dashboards where infographics are floating panels that
executives can walk around.
o AR infographics overlaying sales performance directly on physical store
shelves.
Public Communication:
Meenalochini.M, AP/CSD 22CDT52- VR & AR
18.
o AR infographicsin museums or city landmarks providing historical or cultural
data.
o VR infographics in journalism (immersive storytelling of disasters, elections,
or climate reports).
4. Benefits of Infographics in Spatial Contexts
Improved Engagement: Users spend more time interacting with immersive visuals
than static charts.
Deeper Understanding: Complex relationships (e.g., cause and effect, processes,
hierarchies) are easier to grasp in 3D.
Contextual Learning: Anchoring infographics to real objects makes data relevant
and memorable.
Accessibility of Complex Data: Infographics transform abstract machine learning
outputs into digestible stories.
5. Design Principles for Spatial Infographics
1. Hierarchy of Information – Avoid clutter by layering details (overview first, details
on demand).
2. Spatial Organization – Use depth and positioning to guide user attention (important
info closer, secondary further away).
3. Consistency – Maintain consistent icons, colors, and motion patterns to avoid
confusion.
4. Guided Narratives – Use animation or storytelling sequences to prevent users from
getting lost.
5. Scalability – Design infographics that adapt to different display contexts (AR glasses,
VR headsets, mobile AR).
6. Challenges
Cognitive Overload – Too many floating panels or animations can overwhelm users.
Design Complexity – Requires multidisciplinary design (data viz + spatial UX +
storytelling).
Hardware Constraints – Infographics must run smoothly on AR/VR devices without
latency.
Standardization – Unlike 2D infographics, no universal design language yet for
spatial infographics.
Interaction with Data in Spatial Computing
Meenalochini.M, AP/CSD 22CDT52- VR & AR
19.
1. Why InteractionMatters
In traditional 2D charts, users consume information passively.
In spatial computing (AR/VR/MR), users can actively explore, manipulate, and
query data.
Interaction transforms data from static visuals into experiential knowledge, making
patterns, anomalies, and insights easier to understand.
2. Types of Data Interaction in Spatial Contexts
a) Direct Manipulation
Users grab, rotate, resize, or rearrange datasets like physical objects.
Example: In VR, dragging 3D bars on a histogram to filter values.
b) Immersive Navigation
Data is explored by moving through space (walking, teleporting, flying).
Example: Navigating a galaxy of stars representing a recommendation system’s
dataset.
c) Filtering and Layering
Users can toggle dimensions of data (time, category, metric).
Example: In AR, turning hand gestures on/off reveals layers like demographics,
geographic heat maps, or ML predictions.
d) Multimodal Inputs
Interaction isn’t limited to hands — it includes:
o Gestures (pinch, swipe, grab)
o Voice commands (“show me last year’s data only”)
o Eye tracking (gazing at a point highlights related data)
o Haptic feedback (feeling vibrations when anomalies are detected).
e) Collaboration
Multi-user interaction in the same AR/VR environment.
Example: A team of scientists in VR collaboratively annotating a 3D protein dataset.
3. Enhancing Data Exploration with ML
Machine learning can guide interactions by:
o Suggesting data subsets based on context.
o Highlighting patterns, outliers, or anomalies.
Meenalochini.M, AP/CSD 22CDT52- VR & AR
20.
o Enabling predictiveexploration (e.g., projecting trends into the future while
users manipulate present data).
4. Examples of Interactive Data Applications
Healthcare: Doctors in AR directly interact with MRI data, slicing through 3D scans
with hand gestures.
Urban Planning: Planners in VR move buildings or simulate traffic flow by
manipulating data layers.
Finance: Traders walk through a 3D market graph where clusters of volatility are
highlighted interactively.
Education: Students interact with planetary systems, zooming into orbits, and
rearranging solar models.
5. Principles of Good Interaction Design
1. Intuitive Control: Use natural gestures (pointing, grabbing) that mimic real-world
interactions.
2. Progressive Complexity: Start with simple interactions; unlock advanced filters for
power users.
3. Feedback Loops: Always give visual, auditory, or haptic confirmation of
interactions.
4. Error Tolerance: Allow undo/redo and safeguard against accidental manipulations.
5. Low Latency: Interaction must feel immediate to maintain immersion.
6. Challenges
Cognitive Overload: Too many interactive options can overwhelm.
Accessibility: Must support users with disabilities (e.g., voice over gestures).
Standardization: Lack of universal AR/VR interaction standards leads to
inconsistent designs.
Data Scale: Large datasets may be too heavy for real-time interactive rendering.
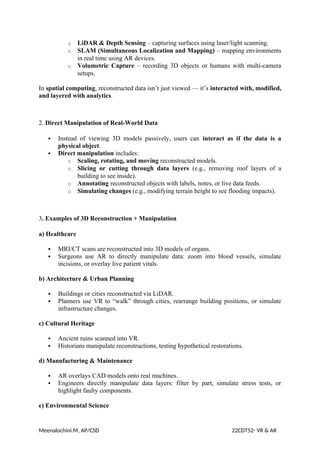
3D Reconstruction and Direct Manipulation of Real-World Data
1. What is 3D Reconstruction in Spatial Computing?
3D Reconstruction is the process of turning real-world objects, spaces, or
environments into digital 3D models.
Techniques include:
o Photogrammetry – stitching together multiple 2D photos into a 3D mesh.
Meenalochini.M, AP/CSD 22CDT52- VR & AR
21.
o LiDAR &Depth Sensing – capturing surfaces using laser/light scanning.
o SLAM (Simultaneous Localization and Mapping) – mapping environments
in real time using AR devices.
o Volumetric Capture – recording 3D objects or humans with multi-camera
setups.
In spatial computing, reconstructed data isn’t just viewed — it’s interacted with, modified,
and layered with analytics.
2. Direct Manipulation of Real-World Data
Instead of viewing 3D models passively, users can interact as if the data is a
physical object.
Direct manipulation includes:
o Scaling, rotating, and moving reconstructed models.
o Slicing or cutting through data layers (e.g., removing roof layers of a
building to see inside).
o Annotating reconstructed objects with labels, notes, or live data feeds.
o Simulating changes (e.g., modifying terrain height to see flooding impacts).
3. Examples of 3D Reconstruction + Manipulation
a) Healthcare
MRI/CT scans are reconstructed into 3D models of organs.
Surgeons use AR to directly manipulate data: zoom into blood vessels, simulate
incisions, or overlay live patient vitals.
b) Architecture & Urban Planning
Buildings or cities reconstructed via LiDAR.
Planners use VR to “walk” through cities, rearrange building positions, or simulate
infrastructure changes.
c) Cultural Heritage
Ancient ruins scanned into VR.
Historians manipulate reconstructions, testing hypothetical restorations.
d) Manufacturing & Maintenance
AR overlays CAD models onto real machines.
Engineers directly manipulate data layers: filter by part, simulate stress tests, or
highlight faulty components.
e) Environmental Science
Meenalochini.M, AP/CSD 22CDT52- VR & AR
22.
3D terrainreconstructions (satellite + LiDAR).
Scientists interact with topographical data: simulate rising sea levels, deforestation
effects, or wildfire spread.
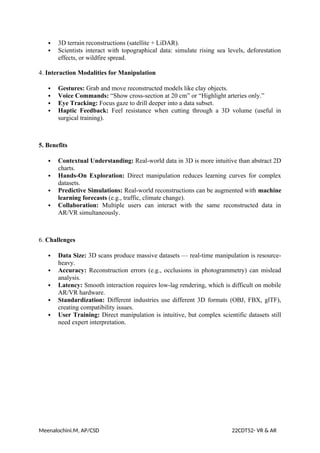
4. Interaction Modalities for Manipulation
Gestures: Grab and move reconstructed models like clay objects.
Voice Commands: “Show cross-section at 20 cm” or “Highlight arteries only.”
Eye Tracking: Focus gaze to drill deeper into a data subset.
Haptic Feedback: Feel resistance when cutting through a 3D volume (useful in
surgical training).
5. Benefits
Contextual Understanding: Real-world data in 3D is more intuitive than abstract 2D
charts.
Hands-On Exploration: Direct manipulation reduces learning curves for complex
datasets.
Predictive Simulations: Real-world reconstructions can be augmented with machine
learning forecasts (e.g., traffic, climate change).
Collaboration: Multiple users can interact with the same reconstructed data in
AR/VR simultaneously.
6. Challenges
Data Size: 3D scans produce massive datasets — real-time manipulation is resource-
heavy.
Accuracy: Reconstruction errors (e.g., occlusions in photogrammetry) can mislead
analysis.
Latency: Smooth interaction requires low-lag rendering, which is difficult on mobile
AR/VR hardware.
Standardization: Different industries use different 3D formats (OBJ, FBX, glTF),
creating compatibility issues.
User Training: Direct manipulation is intuitive, but complex scientific datasets still
need expert interpretation.
Meenalochini.M, AP/CSD 22CDT52- VR & AR