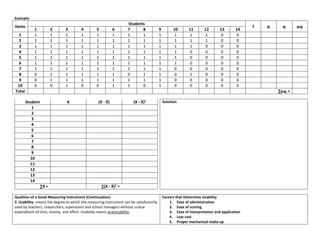
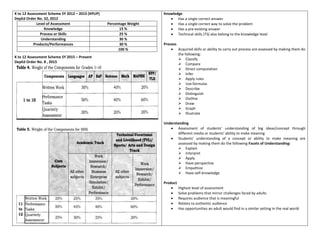
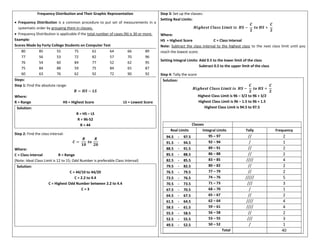
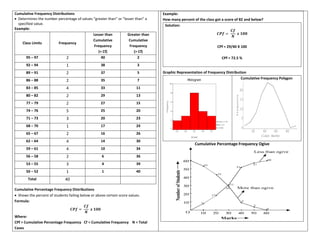
This document discusses concepts related to measurement and evaluation in education. It defines key terms like assessment, testing, and measurement. It outlines the functions of measurement and evaluation, which include measuring student achievement, evaluating instruction, and motivating learning. The document also discusses different approaches to assessment, including assessment for learning, of learning, and as learning. It provides examples of different types of tests, the principles of assessment, and steps in constructing teacher-made tests. Overall, the document provides a comprehensive overview of measurement and evaluation concepts and processes in education.

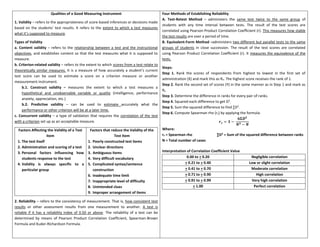
![Solutions:
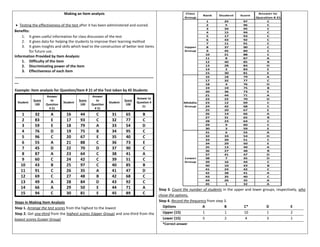
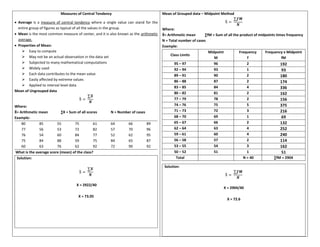
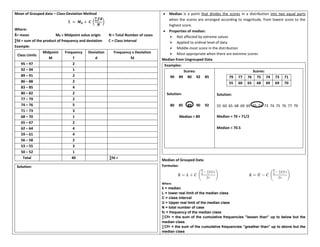
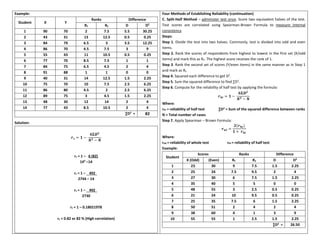
𝒓𝒉𝒕 = 𝟏 −
𝟔𝚺𝑫𝟐
𝑵𝟑 − 𝑵
rht = 1 – 6 (26.50)
103
–10
rht = 1 – 159
1000 –10
rht = 1 – 159
990
rht = 1 – 0.16060606
rht = 0.84 (reliability of half of the test)
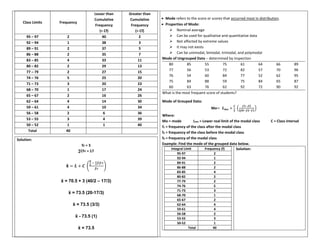
𝒓𝒘𝒕 =
𝟐(𝒓𝒉𝒕)
𝟏 + 𝒓𝒉𝒕
rwt = 2 (0.84)
1 + 0.84
rwt = 1.68
1.84
rwt = 0.91 or 91 5 (Reliability of the whole test: Very high correlation)
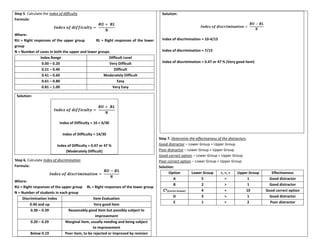
Four Methods of Establishing Reliability (continuation)
D. Kuder-Richardson Formula – administer test once. This method is used with
psychological test which consists of dichotomously scored items. The examinee either
passes or fails in an item. It measures internal consistency of homogeneity of the
measuring instrument.
Steps:
Step 1. Find the proportion passing each item (pi) and the proportion failing each item
(qi).
Step 2. Multiply pi and qi for each item and sum for all items.
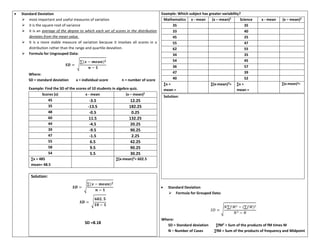
Step 3. Compute for the variance (SD2
) of the test scores for the whole group using the
formula:
Ẋ =
∑𝑿
𝑵
𝑺𝑫𝟐
=
∑(𝑿 − Ẋ)𝟐
𝑵 − 𝟏
Where:
Ẋ = mean ∑X = Summation of scores SD2
= Variance N = Number of cases
Step 4. Substitute the calculated values in the Kunder-Richardson 20 formula:
𝒓𝒙𝒙 = [
𝑵
𝑵 − 𝟏
] [
𝑺𝑫𝟐
− ∑𝒑𝒊𝒒𝒊
𝑺𝑫𝟐
]
Where:
N = number of items SD2
= variance of scores
piqi = product of proportion passing and failing item i](https://image.slidesharecdn.com/measurementandevaluation-230815134358-ad36bc2c/85/Measurement-and-Evaluation-pdf-12-320.jpg)