Download as PDF, PPTX
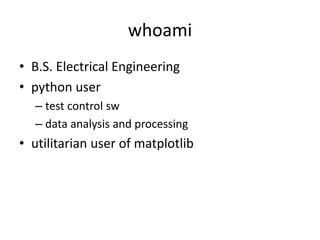
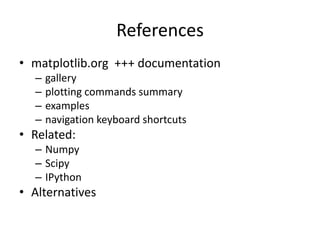
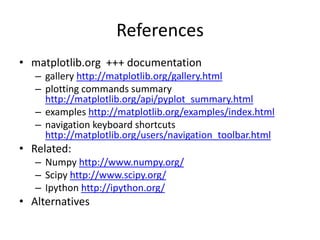
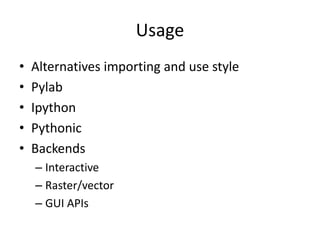

This document provides an introduction to using Matplotlib for data analysis and visualization. It outlines the presenter's background and experience with Python and Matplotlib. References to key Matplotlib documentation resources are given, including galleries of examples, API summaries, and tutorials. Different methods for importing and using Matplotlib are described, such as with Pylab, IPython, or different backends. The presentation concludes with demonstrations of Matplotlib examples using real stock market data.