Download to read offline
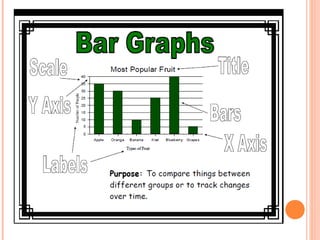
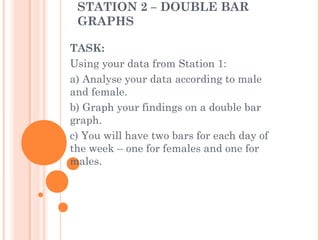
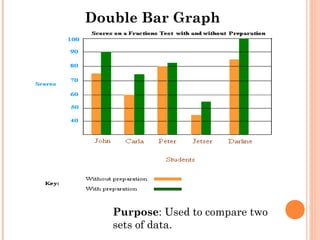
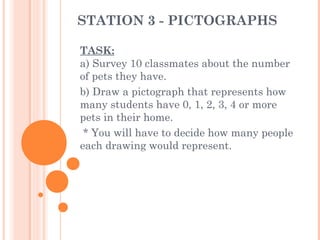
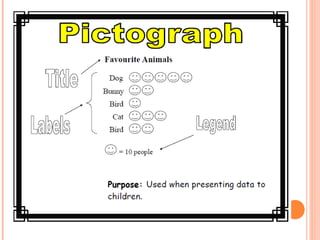
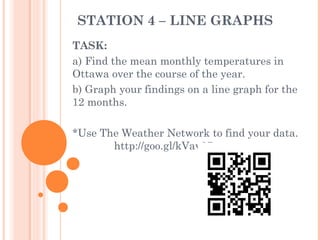
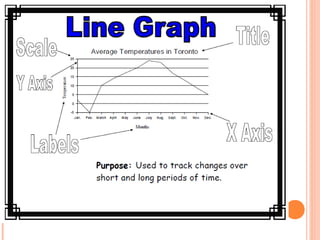
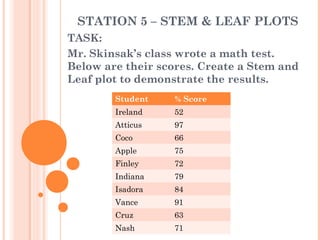
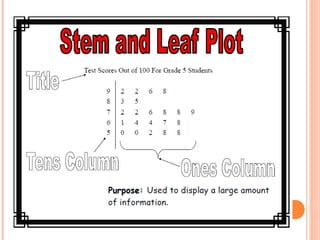
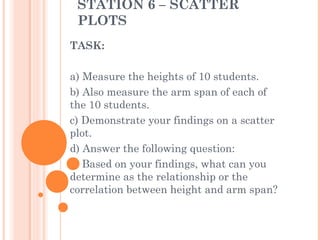
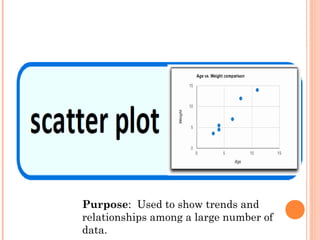
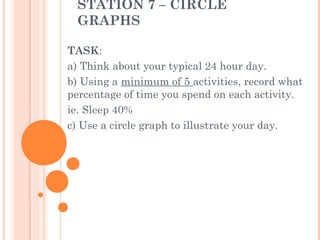
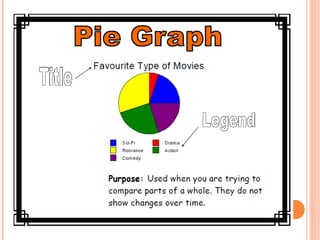

The document outlines 7 stations for students to complete graphing and data analysis activities. At station 1, students survey classmates' favorite days of the week and create a bar graph. Station 2 has students make a double bar graph comparing male and female favorites. Station 3 involves a pictograph of classmates' pet ownership. Station 4 is a line graph of monthly temperature data. Station 5 is a stem-and-leaf plot of a math test scores. Station 6 is a scatter plot comparing student heights and arm spans. Station 7 is a circle graph of time spent on daily activities.


