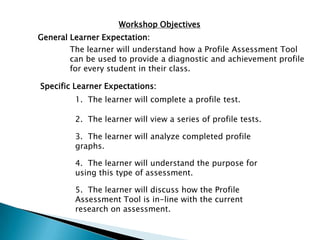
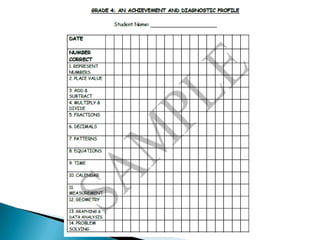
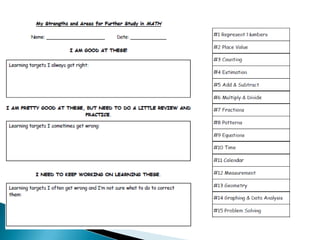
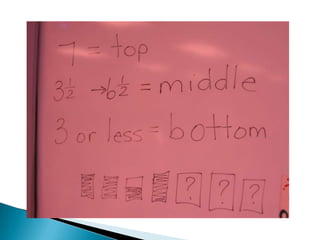
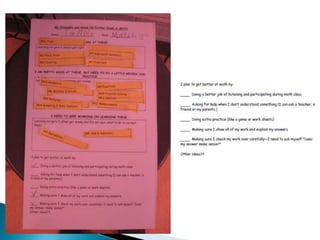
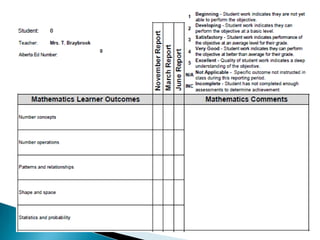
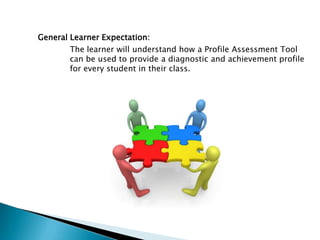
Presented by Tanya Braybrook, B.Ed.
Email: tanya@mathprofile.com
Follow on Twitter: @MathProfile
Find us on Facebook#mathchat
#mathprofile
Workshop Objectives
General Learner Expectation:
The learner will understand how a Profile Assessment Tool
can be used to provide a diagnostic and achievement profile
for every student in their class.
Specific Learner Expectations:
1. The learner will complete a profile test.
2. The learner will view a series of profile tests.
3. The learner will analyze completed profile
graphs.
4. The learner will understand the purpose for
using this type of assessment.
5. The learner will discuss how the Profile
Assessment Tool is in-line with the current
research on assessment.
As you complete a Profile Assessment, think about…
What objectives or outcomes are being assessed?
What processes are being assessed?
-communication, connections, mental math &
estimation, problem
solving, reasoning, technology, visualization
What might happen if a similar test is given regularly?
Categories for the Math Profile Assessment Tool by Grade Level
GRADE 1—9 categories
Represent Numbers Place Value Counting
Estimation Add & Subtract Patterns
Equalities Measurement Geometry
GRADE 2—12 categories
Represent Numbers Place Value Counting
Estimation Add & Subtract Patterns
Equalities Measurement Geometry
Calendar Graphing & Data Analysis
Problem Solving
GRADE 3—15 categories
Represent Numbers Place Value Counting
Estimation Add & Subtract Multiply & Divide
Fractions Patterns Equations
Time Calendar Measurement
Geometry Graphing & Data Analysis Problem Solving
GRADE 4—14 categories
Represent Numbers Place Value Add & Subtract
Multiply & Divide Fractions Decimals
Patterns Equations Time
Calendar Measurement Geometry
Graphing & Data Analysis Problem Solving
GRADE 5—12 categories
Represent Numbers Estimation Multiply & Divide
Fractions Decimals Patterns
Equations Measurement Geometry
Graphing & Data Analysis Chance & Uncertainty Problem Solving
GRADE 6—13 categories
Represent Numbers Estimation Whole Number Operations
Fractions, Ratios & Percents Decimals
Patterns Equations Measurement
Geometry Transformations Graphing & Data Analysis
Chance & Uncertainty Problem Solving
The Basics of Using a Profile Assessment Tool
Give a test regularly; start as early in the year as possible.
Every test has the same number of questions—one for each
category. Each question is ALWAYS on the same category.
At the beginning of the year, use questions from the
previous grade level. Once you’ve taught the current grade
level outcomes, change that category to reflect those
outcomes.
Where do I get questions from?
Your instructional program & other resources
Marking the Test
Do it in a way that is easy for students to understand.
= correct = wrong = half a mark
Graphing the Test Results
If there is a checkmark, color the box in.
If there is a circle, put a ? in the box.
If there is ½, color in half the box.
Reading & Interpreting the Profile Graph
How does this assessment strategy align with current research on
assessment?
What makes this an effective assessment strategy?
Note: Your handout has a
bibliography of research.
General Learner Expectation:
The learner will understand how a Profile Assessment Tool
can be used to provide a diagnostic and achievement profile
for every student in their class.

Math Profile Assessment Tool

  • 1.
    Presented by TanyaBraybrook, B.Ed. Email: tanya@mathprofile.com Follow on Twitter: @MathProfile Find us on Facebook#mathchat #mathprofile
  • 2.
    Workshop Objectives General LearnerExpectation: The learner will understand how a Profile Assessment Tool can be used to provide a diagnostic and achievement profile for every student in their class. Specific Learner Expectations: 1. The learner will complete a profile test. 2. The learner will view a series of profile tests. 3. The learner will analyze completed profile graphs. 4. The learner will understand the purpose for using this type of assessment. 5. The learner will discuss how the Profile Assessment Tool is in-line with the current research on assessment.
  • 3.
    As you completea Profile Assessment, think about… What objectives or outcomes are being assessed? What processes are being assessed? -communication, connections, mental math & estimation, problem solving, reasoning, technology, visualization What might happen if a similar test is given regularly?
  • 8.
    Categories for theMath Profile Assessment Tool by Grade Level GRADE 1—9 categories Represent Numbers Place Value Counting Estimation Add & Subtract Patterns Equalities Measurement Geometry GRADE 2—12 categories Represent Numbers Place Value Counting Estimation Add & Subtract Patterns Equalities Measurement Geometry Calendar Graphing & Data Analysis Problem Solving GRADE 3—15 categories Represent Numbers Place Value Counting Estimation Add & Subtract Multiply & Divide Fractions Patterns Equations Time Calendar Measurement Geometry Graphing & Data Analysis Problem Solving
  • 9.
    GRADE 4—14 categories RepresentNumbers Place Value Add & Subtract Multiply & Divide Fractions Decimals Patterns Equations Time Calendar Measurement Geometry Graphing & Data Analysis Problem Solving GRADE 5—12 categories Represent Numbers Estimation Multiply & Divide Fractions Decimals Patterns Equations Measurement Geometry Graphing & Data Analysis Chance & Uncertainty Problem Solving GRADE 6—13 categories Represent Numbers Estimation Whole Number Operations Fractions, Ratios & Percents Decimals Patterns Equations Measurement Geometry Transformations Graphing & Data Analysis Chance & Uncertainty Problem Solving
  • 10.
    The Basics ofUsing a Profile Assessment Tool Give a test regularly; start as early in the year as possible. Every test has the same number of questions—one for each category. Each question is ALWAYS on the same category. At the beginning of the year, use questions from the previous grade level. Once you’ve taught the current grade level outcomes, change that category to reflect those outcomes. Where do I get questions from? Your instructional program & other resources
  • 15.
    Marking the Test Doit in a way that is easy for students to understand. = correct = wrong = half a mark Graphing the Test Results If there is a checkmark, color the box in. If there is a circle, put a ? in the box. If there is ½, color in half the box.
  • 16.
    Reading & Interpretingthe Profile Graph
  • 23.
    How does thisassessment strategy align with current research on assessment? What makes this an effective assessment strategy? Note: Your handout has a bibliography of research.
  • 25.
    General Learner Expectation: Thelearner will understand how a Profile Assessment Tool can be used to provide a diagnostic and achievement profile for every student in their class.