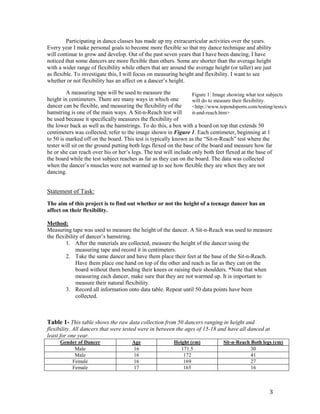
The document investigates the relationship between a dancer's height and flexibility. It describes collecting data from 50 dancers by measuring their height in centimeters and flexibility using a sit-and-reach test. Basic calculations were performed on the data like average, minimum, maximum, and standard deviation. Graphs including box plots, scatter plots, and cumulative frequency plots were created to visualize the data. Further analysis with Pearson's correlation coefficient and chi-squared tests will be done to determine if there is a relationship between height and flexibility in dancers.