Downloaded 24 times

![Section 2– Data Response
In the exam you will have a choice of two sets of questions called Contexts. One will
be on Markets and the other on Market Failure. Both sets require similar structure but
will require different skills in each. Each context comes with 3 extracts which you
should study. One extract will always be a graph which shows two things on the same
graph. The others tend to be articles or information.
Question 1: Define [5 Marks]
This is the same for both contexts and will normally ask you to define a term men-
tioned in one of the extracts you have read. This question requires a simple one line
definition from you which is easy marks as it is work 5 marks.
E.g. January 2012: Define the term Composite Demand.
Composite Demand is where a good is demanded for two or more different purposes,
for example aluminium may be demanded for both the production of drinks cans and
aeroplanes
That was answer was awarded 5 marks
Question 2: Compare [8 Marks]
This requires the graph or chart extract. You should identify two significant points of
comparison which would be when a price peaked or was at a low. You must include
specific numerical values to gain top marks. Each comparison is worth 4 Marks.
To help the examiner place each comparison in a new paragraph.
Question 3: Mini Essay [12 Marks]
This question in the paper will require that you use a diagram and a specific extract to
explain why something happens. In the Markets Context a simple Demand and Supply
Diagram are appropriate. In the Market Failure context and Externalities Graph is re-
quired.
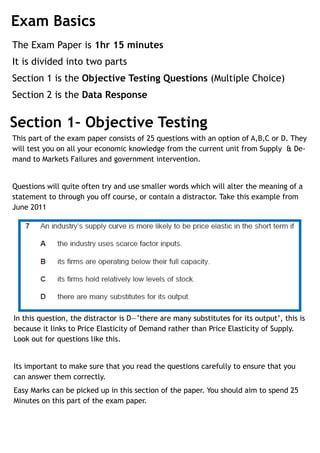
You should make your graphs big not small (see over page). Make sure that you do the
following:
Label the Axis
Use a Ruler
Label the Curves
Use lines to indicate areas of importance e.g. Price Level or Quantity Demanded](https://image.slidesharecdn.com/marketsmarketfailureexamquestionguide-120528105714-phpapp01/85/Markets-Market-Failure-Exam-Question-Guide-3-320.jpg)
![Question 4: Essay [25 Marks]
In this question you will be presented with an evaluate style question. You should aim
to make use of the extracts as these are likely to contain vital information to help you
complete the exam question.
You can pick up easy marks here by defining the term in which you are going to evalu-
ate as this would ground your economic knowledge and use of specialist vocabulary.
When evaluating you should go through the options that would be available in relation
to your question and analyse each one.
You can look at ISWOT to make your evaluation better and allow it cover the maximum
amount of areas available for evaluation.
Using a graph here would also add marks, and make you look like a more serious eco-
nomic student
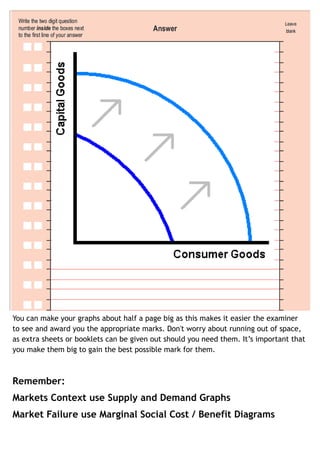
Evaluating ISWOT
Evaluation can gain a candidate a good amount of marks and if
done right you can be right on the money!
Impact: it is important that with all economic decisions that you
mention as to how far they go what would be affected or who
would be affected by the policy
Short Run/ Long Run: All decisions or options are going to have
ISWOT
short run and long term effects and it is up to you to decide what
they might be. For example a buffer stock scheme may in the
long run affect price levels but in the short run its effectiveness
may be limited
Weaknesses/Strengths: Policies or decisions are likely to be
stronger or weaker than others, so comment on these.
Opportunity Cost / Other Things Remain Equal: A decision is
likely to have an opportunity cost attached to it so comment on
it, what could the money required be used for if not the decision.
Most policies or decisions assume that everything else remains
equal and it is likely that it wont, so therefore comment on the
changing circumstances
Time Lag: All policies will have a delay in coming into effect such
as the building of motorways will take time for the positive exter-
nalities to be felt as well as the negatives such as pollution
Follow this to ensure a sound evaluation in your exam](https://image.slidesharecdn.com/marketsmarketfailureexamquestionguide-120528105714-phpapp01/85/Markets-Market-Failure-Exam-Question-Guide-5-320.jpg)

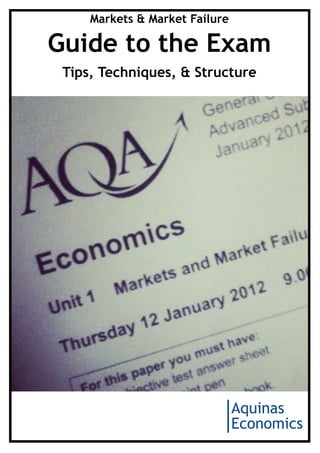
This document provides guidance on the structure and content of an economics exam, including: Section 1 consists of 25 multiple choice questions testing knowledge of concepts like supply and demand. Section 2 includes two contexts with accompanying extracts, requiring definitions, comparisons using data, and diagrams to explain economic phenomena. The final question is an essay evaluating policy options using an analytical framework. Well-explained diagrams and references to evidence can earn high marks.