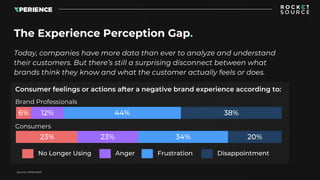
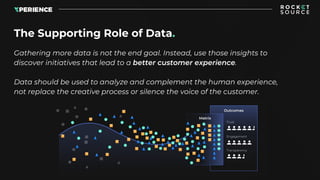
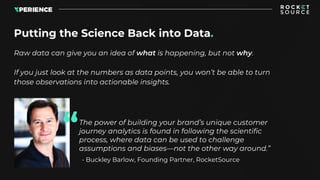
Humanizing Big Data:
The Key to Actionable
Customer Journey Analytics
Technology enables us to
digest and create data every
single day.
But this data doesn’t exist as
a static record of events—it’s
being actively used to reflect
and shape human behavior.
The Tech Effect:
Big Data, Big Changes.
Today, companies have more data than ever to analyze and understand
their customers. But there’s still a surprising disconnect between what
brands think they know and what the customer actually feels or does.
The Experience Perception Gap.
6% 12% 44% 38%
20%34%23%23%
Brand Professionals
Consumers
No Longer Using Anger Frustration Disappointment
Source: InMoment
Consumer feelings or actions after a negative brand experience according to:
Every company uses data. But keeping
everything in a database or dumping
it into a complex spreadsheet is not an
effective strategy.
Estimates suggest that 60-73% of all
enterprise data goes unused for
analytics. The companies that use
data effectively are better positioned
to deliver a superior product and
experience.
Disruption Starts With Data.
Source: Forrester
Thanks to data, small companies can act quickly on trends.
Larger organizations usually have more data at their disposal, but are
often bogged down by several mitigating factors:
1. Frontline managers lack understanding and confidence in the
analytics and hesitate to employ it
2. Existing organizational processes are unable to accommodate
advancements in analytics and automation
3. Decision-making protocols require multiple levels of approval
Startups Have a Distinct Edge.
Source: McKinsey
Gathering more data is not the end goal. Instead, use those insights to
discover initiatives that lead to a better customer experience.
Data should be used to analyze and complement the human experience,
not replace the creative process or silence the voice of the customer.
The Supporting Role of Data.
Raw data can give you an idea of what is happening, but not why.
If you just look at the numbers as data points, you won’t be able to turn
those observations into actionable insights.
Putting the Science Back into Data.
The power of building your brand’s unique customer
journey analytics is found in following the scientific
process, where data can be used to challenge
assumptions and biases—not the other way around.”
“
- Buckley Barlow, Founding Partner, RocketSource
Putting yourself in the customer’s shoes isn’t easy. Every team needs
to be structured to think about and treat data the right way:
1. Think like a scientist. Go fact-finding. Hypothesize, conduct
experiments, analyze the data, and report results.
2. Think like a psychologist. Get into the head of the buyer by
researching, analyzing, and understanding the factors that
contribute to human behavior.
3. Think like an anthropologist. Find out how and why your
customers use the product/service you offer. Look for concrete
evidence from users, such as audio from support calls.
How Teams Need to Think About Data.
Viewed in a vacuum, data are just numbers.
But people aren’t numbers—they’re people.
Data is humanized when a company uses
metrics to understand human behavior and
improve the brand experience through
people-centered initiatives.
Humanizing Data.
Empathy means understanding what your
customers and employees alike experience,
and seeking honest feedback.
Humility is being open to persuasion by
listening to and acting on input.
Leaders and organizations that are
empathetic and humble elicit loyalty from
employees and customers, and contribute
to a richer brand experience.
Core CX Traits: Empathy and Humility.
CX Empathy Map
Quantitative data describe broad trends
and are useful for statistical analysis.
Qualitative data are rich, personal, and
give insight into motivational behavior.
Both are necessary for understanding
and improving the customer journey.
Qualitative and Quantitative Data.
Qualitative and Quantitative Data
Apple doesn’t just sell products.
They sell experiences.
The company has loyal fans not
simply because of the features
and benefits they offer, but
everything that goes into opening
and using a new product, visiting
a retail store, and more.
How Apple Does Empathy.
Apple employees are trained
to do more than fix problems.
They are taught to validate
concerns and show concern
when the customer’s
expectations aren’t met.
It’s part of the design, not a
tacked-on afterthought.
How Apple Does Empathy.
Source: Gizmodo
Some companies focus on a simple metric like a net promoter score (NPS).
Don’t Take Shortcuts.
Source: Buffer
These only scratch the surface of what’s going on in your customer’s mind.
These results alone are not specific enough to draw out actionable insights
that can be used to turn a “good enough” experience into a great one.
Data Looping Pyramid
How to quantify qualitative observations or assumptions:
1. Quantify assumptions and observations with relevant metrics. Don’t rely
on anecdotes, opinions, votes, or defer to the loudest voice in the room.
2. Dig deeper by applying psychological principles. Go beyond the surface
by looking at more advanced data that uncovers motivational triggers.
3. Visualize and democratize the results. Share the information with the
entire team to spread the knowledge and insights.
Quantifying the Qualitative.
Many charts could be used to
portray data, but radar charts
are great at showing a lot of
points at a glance.
But basic charts don’t dig deep
enough to know what’s going
on both inside and outside of
the company.
Visualizing Quantitative Data.
Leadership
Communication
Innovation
Training
AgilitySupport
Collaboration
Wellness
Data-Driven Radar Graph
Turning data into beautiful visuals
isn’t the ultimate goal, but an
improved customer experience.
All of the quantitative data and
qualitative observations should be
combined and feed into a cohesive
dashboard that is easy to look at
and understand, and offers
meaningful, actionable insights.
Journey Analytics.
Insulate your business
from disruption.
Learn more at
RocketSource.co

Humanizing Big Data: The Key to Actionable Customer Journey Analytics

  • 1.
    Humanizing Big Data: TheKey to Actionable Customer Journey Analytics
  • 2.
    Technology enables usto digest and create data every single day. But this data doesn’t exist as a static record of events—it’s being actively used to reflect and shape human behavior. The Tech Effect: Big Data, Big Changes.
  • 3.
    Today, companies havemore data than ever to analyze and understand their customers. But there’s still a surprising disconnect between what brands think they know and what the customer actually feels or does. The Experience Perception Gap. 6% 12% 44% 38% 20%34%23%23% Brand Professionals Consumers No Longer Using Anger Frustration Disappointment Source: InMoment Consumer feelings or actions after a negative brand experience according to:
  • 4.
    Every company usesdata. But keeping everything in a database or dumping it into a complex spreadsheet is not an effective strategy. Estimates suggest that 60-73% of all enterprise data goes unused for analytics. The companies that use data effectively are better positioned to deliver a superior product and experience. Disruption Starts With Data. Source: Forrester
  • 5.
    Thanks to data,small companies can act quickly on trends. Larger organizations usually have more data at their disposal, but are often bogged down by several mitigating factors: 1. Frontline managers lack understanding and confidence in the analytics and hesitate to employ it 2. Existing organizational processes are unable to accommodate advancements in analytics and automation 3. Decision-making protocols require multiple levels of approval Startups Have a Distinct Edge. Source: McKinsey
  • 6.
    Gathering more datais not the end goal. Instead, use those insights to discover initiatives that lead to a better customer experience. Data should be used to analyze and complement the human experience, not replace the creative process or silence the voice of the customer. The Supporting Role of Data.
  • 7.
    Raw data cangive you an idea of what is happening, but not why. If you just look at the numbers as data points, you won’t be able to turn those observations into actionable insights. Putting the Science Back into Data. The power of building your brand’s unique customer journey analytics is found in following the scientific process, where data can be used to challenge assumptions and biases—not the other way around.” “ - Buckley Barlow, Founding Partner, RocketSource
  • 8.
    Putting yourself inthe customer’s shoes isn’t easy. Every team needs to be structured to think about and treat data the right way: 1. Think like a scientist. Go fact-finding. Hypothesize, conduct experiments, analyze the data, and report results. 2. Think like a psychologist. Get into the head of the buyer by researching, analyzing, and understanding the factors that contribute to human behavior. 3. Think like an anthropologist. Find out how and why your customers use the product/service you offer. Look for concrete evidence from users, such as audio from support calls. How Teams Need to Think About Data.
  • 9.
    Viewed in avacuum, data are just numbers. But people aren’t numbers—they’re people. Data is humanized when a company uses metrics to understand human behavior and improve the brand experience through people-centered initiatives. Humanizing Data.
  • 10.
    Empathy means understandingwhat your customers and employees alike experience, and seeking honest feedback. Humility is being open to persuasion by listening to and acting on input. Leaders and organizations that are empathetic and humble elicit loyalty from employees and customers, and contribute to a richer brand experience. Core CX Traits: Empathy and Humility.
  • 11.
  • 12.
    Quantitative data describebroad trends and are useful for statistical analysis. Qualitative data are rich, personal, and give insight into motivational behavior. Both are necessary for understanding and improving the customer journey. Qualitative and Quantitative Data.
  • 13.
  • 14.
    Apple doesn’t justsell products. They sell experiences. The company has loyal fans not simply because of the features and benefits they offer, but everything that goes into opening and using a new product, visiting a retail store, and more. How Apple Does Empathy.
  • 15.
    Apple employees aretrained to do more than fix problems. They are taught to validate concerns and show concern when the customer’s expectations aren’t met. It’s part of the design, not a tacked-on afterthought. How Apple Does Empathy. Source: Gizmodo
  • 16.
    Some companies focuson a simple metric like a net promoter score (NPS). Don’t Take Shortcuts. Source: Buffer These only scratch the surface of what’s going on in your customer’s mind. These results alone are not specific enough to draw out actionable insights that can be used to turn a “good enough” experience into a great one.
  • 17.
  • 18.
    How to quantifyqualitative observations or assumptions: 1. Quantify assumptions and observations with relevant metrics. Don’t rely on anecdotes, opinions, votes, or defer to the loudest voice in the room. 2. Dig deeper by applying psychological principles. Go beyond the surface by looking at more advanced data that uncovers motivational triggers. 3. Visualize and democratize the results. Share the information with the entire team to spread the knowledge and insights. Quantifying the Qualitative.
  • 19.
    Many charts couldbe used to portray data, but radar charts are great at showing a lot of points at a glance. But basic charts don’t dig deep enough to know what’s going on both inside and outside of the company. Visualizing Quantitative Data. Leadership Communication Innovation Training AgilitySupport Collaboration Wellness
  • 20.
  • 21.
    Turning data intobeautiful visuals isn’t the ultimate goal, but an improved customer experience. All of the quantitative data and qualitative observations should be combined and feed into a cohesive dashboard that is easy to look at and understand, and offers meaningful, actionable insights. Journey Analytics.
  • 22.
    Insulate your business fromdisruption. Learn more at RocketSource.co