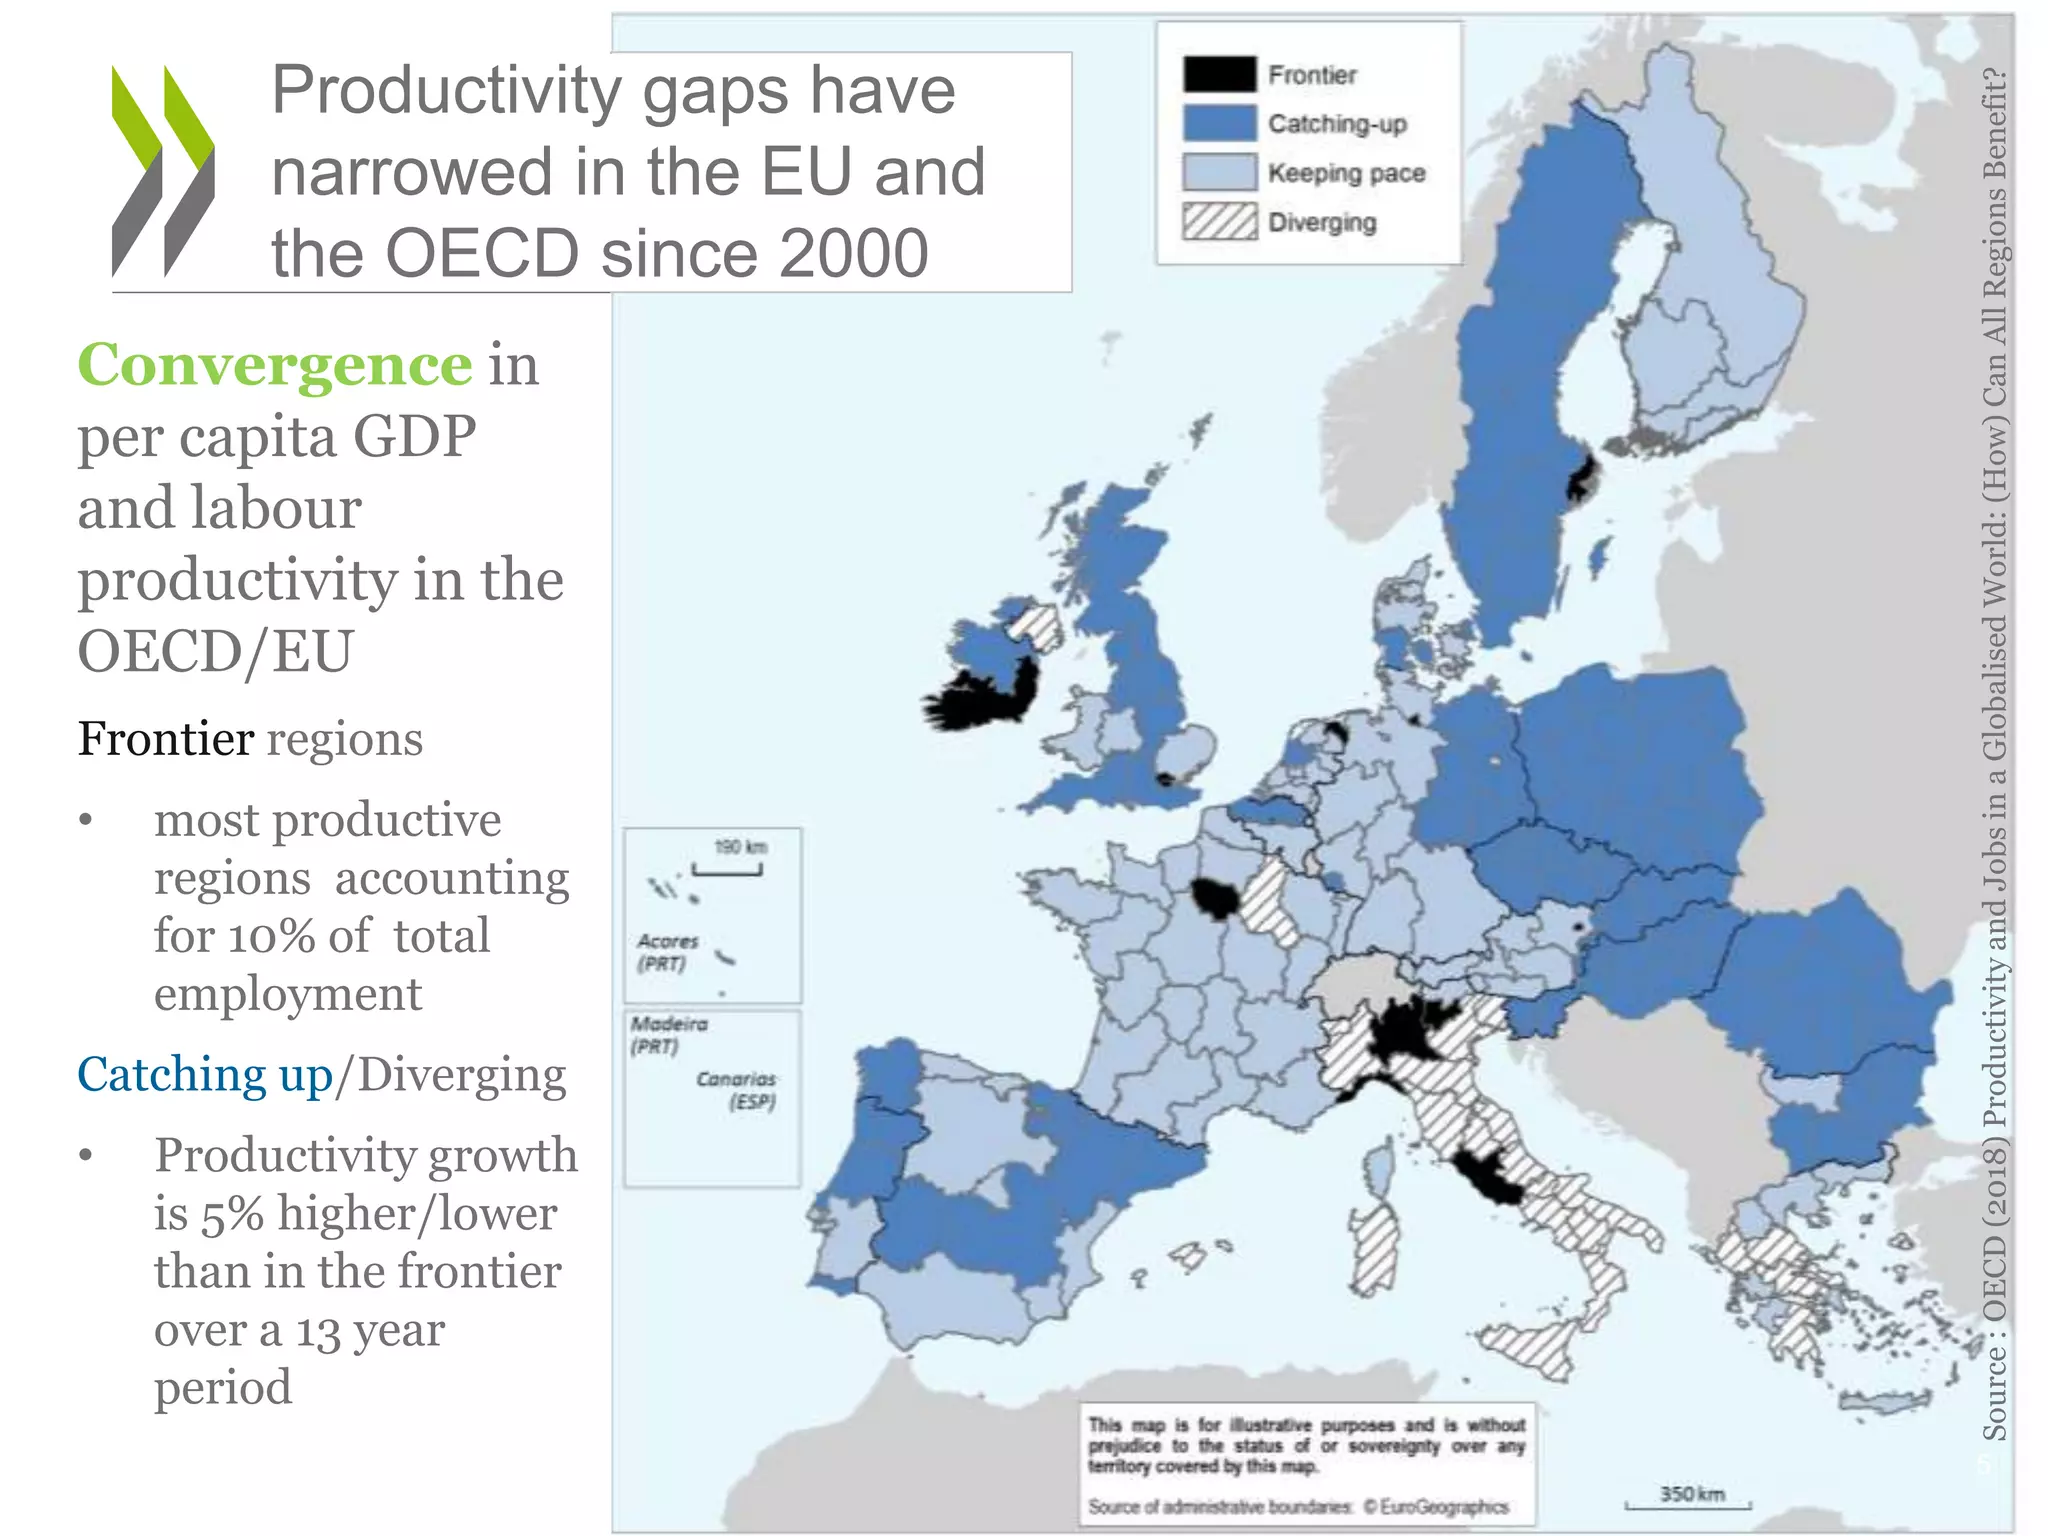
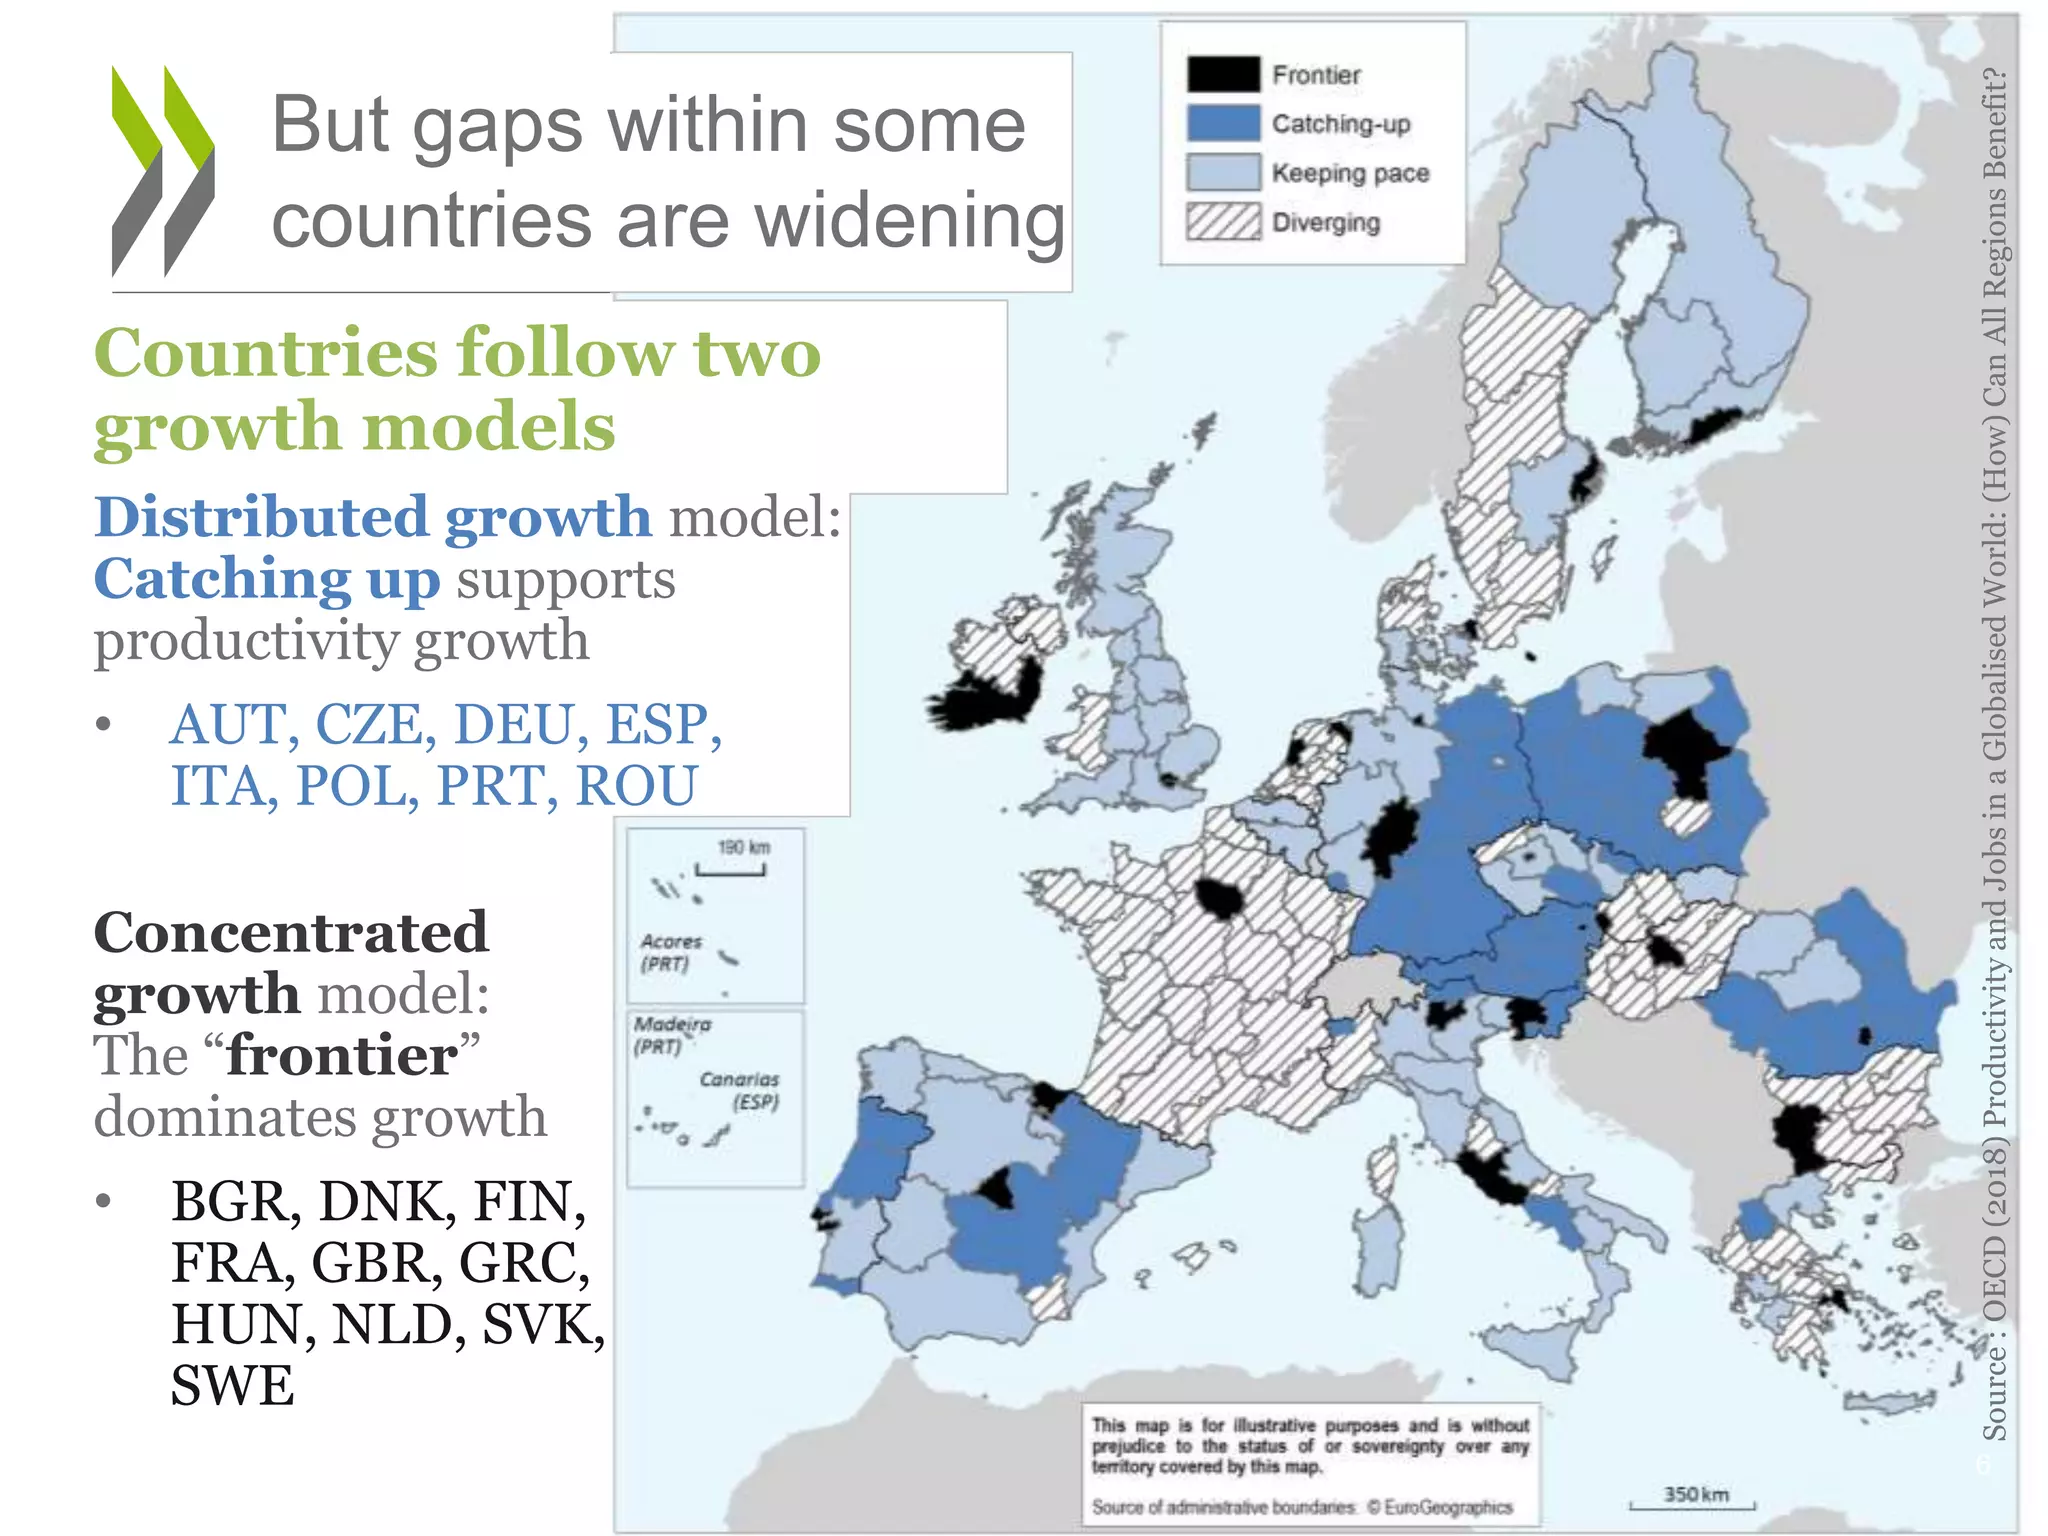
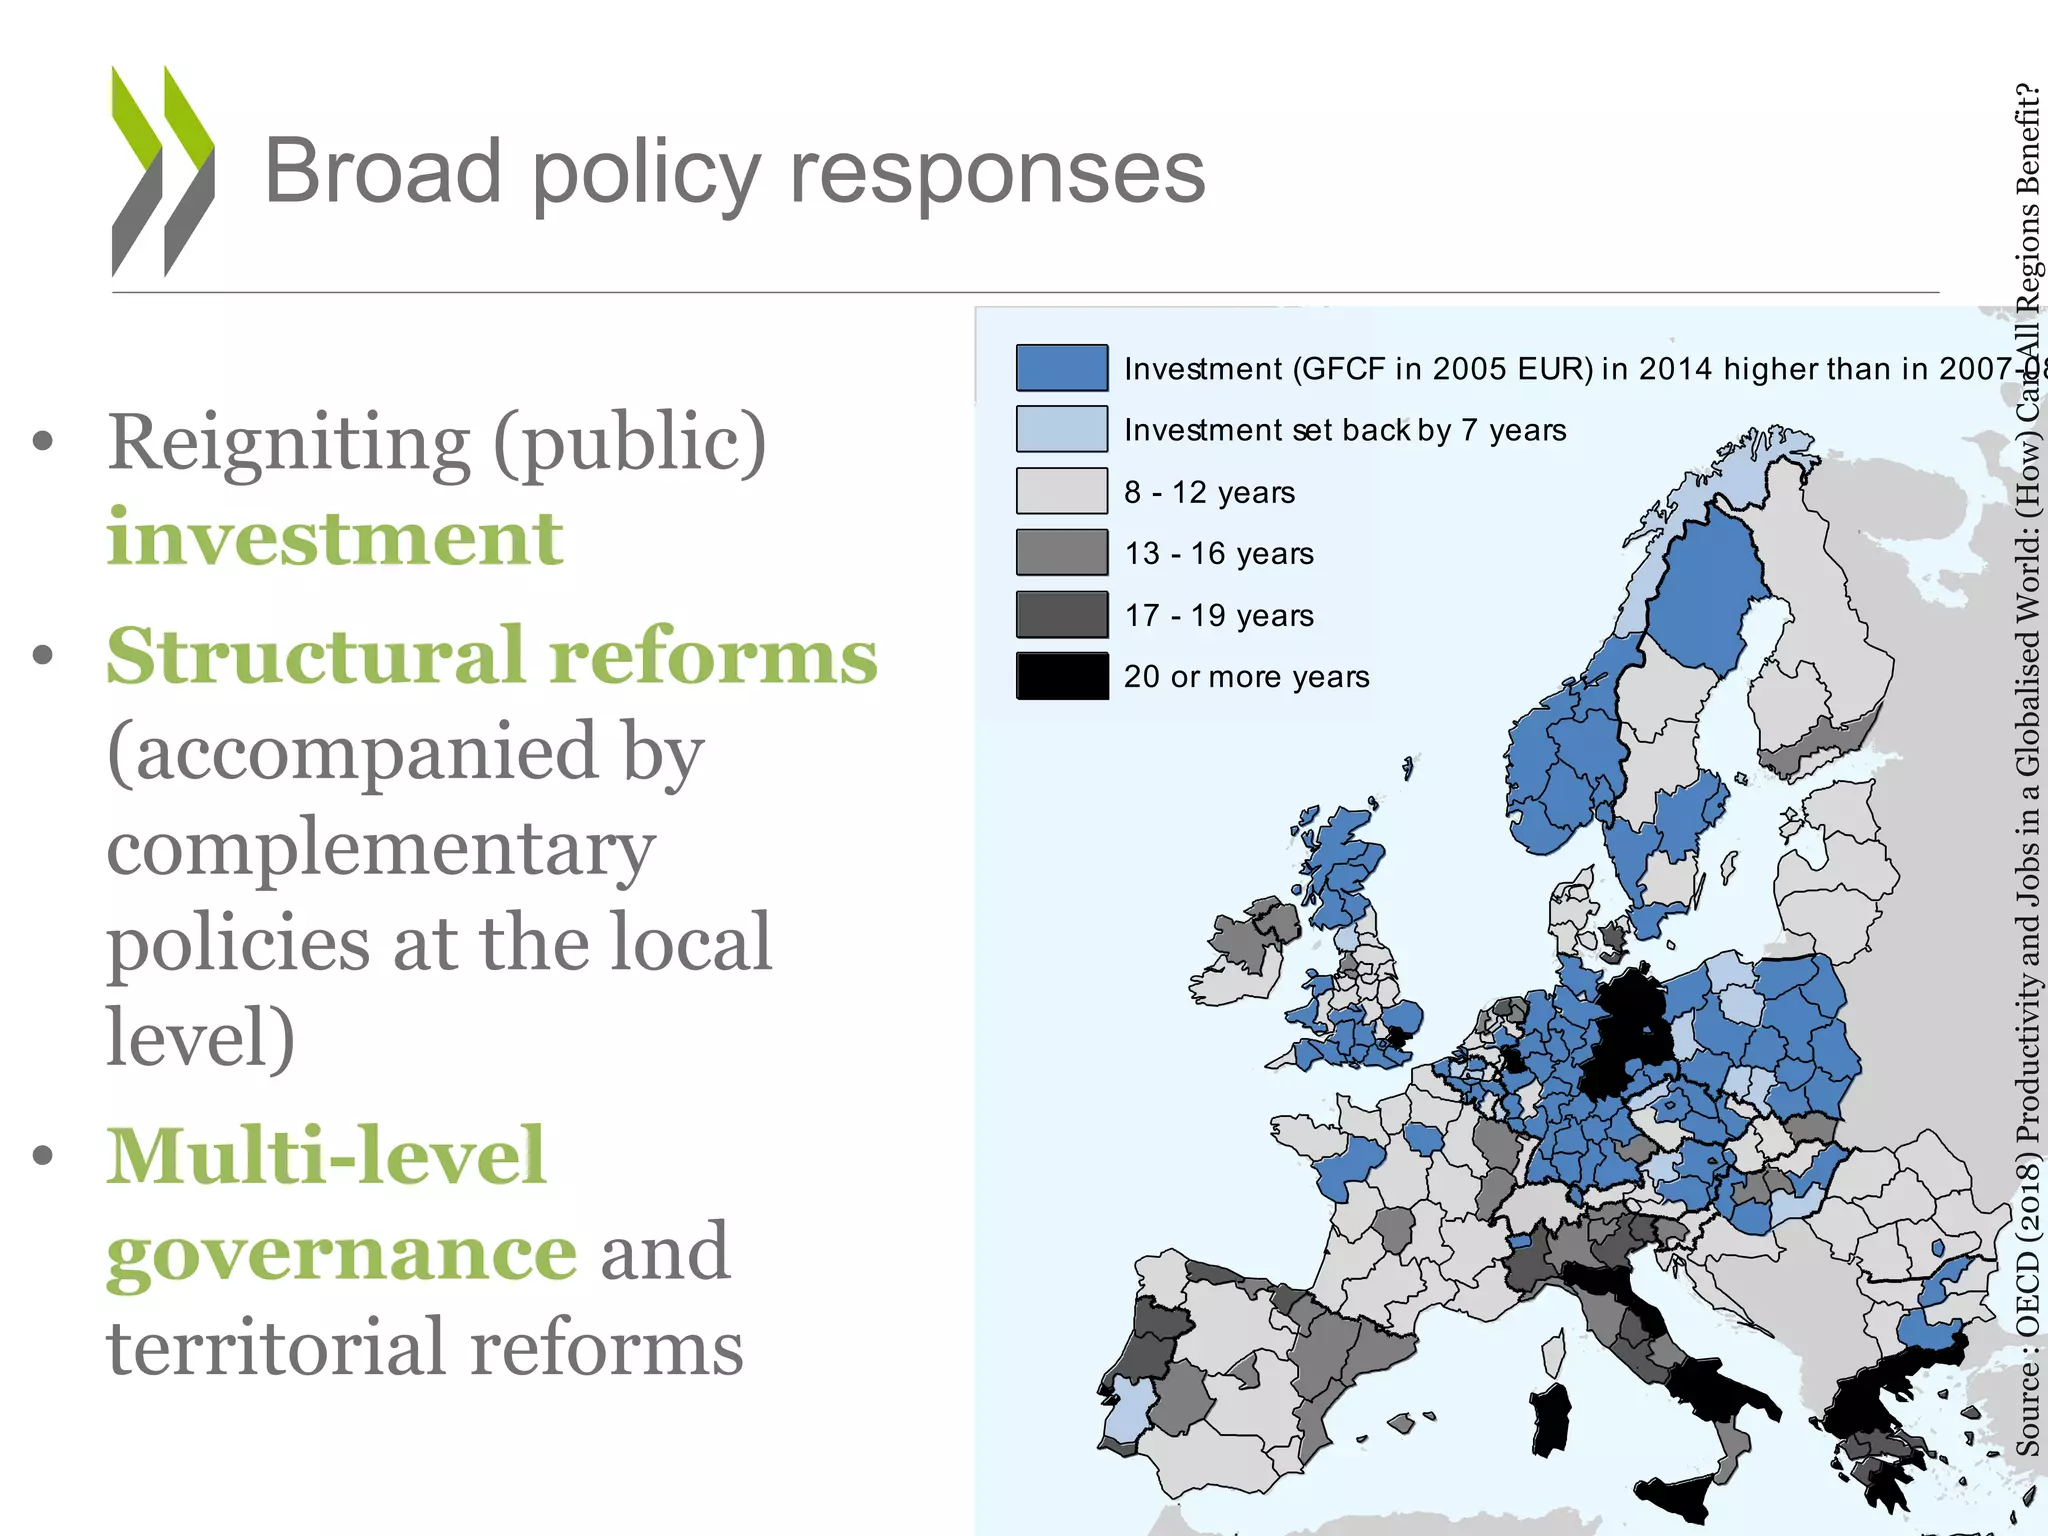
PRODUCTIVITY AND JOBS
IN A GLOBALISED WORLD:
(HOW) CAN ALL REGIONS
BENEFIT?
Committee of the Regions
26 April 2018
Joaquim Oliveira Martins
Special Advisor to the Director
OECD Centre for Entrepreneurship, SMEs, Regions and Cities
• Productivity and jobs:
the regional diffusion
challenge
• What supports
“catching up”?
• What can policy do to
leverage the potential
of all regions?
2
Roadmap for the presentation
PRODUCTIVITY AND JOBS:
THE REGIONAL DIFFUSION
CHALLENGE
3
Long-term decline in productivity
growth rates: not just the crisis
Source: OECD Productivity database; moving averages (t, t-1, t-2)
Aggregate trends of labour productivity growth, 2000-2016
4-0.5
0
0.5
1
1.5
2
2.5
3
2000 2001 2002 2003 2004 2005 2006 2007 2008 2009 2010 2011 2012 2013 2014 2015 2016
Japan US Euro Area
Financial crisis
Convergence in
per capita GDP
and labour
productivity in the
OECD/EU
Frontier regions
• most productive
regions accounting
for 10% of total
employment
Catching up/Diverging
• Productivity growth
is 5% higher/lower
than in the frontier
over a 13 year
period
5
Source:OECD(2018)ProductivityandJobsinaGlobalisedWorld:(How)CanAllRegionsBenefit?
Productivity gaps have
narrowed in the EU and
the OECD since 2000
6
But gaps within some
countries are widening
Source:OECD(2018)ProductivityandJobsinaGlobalisedWorld:(How)CanAllRegionsBenefit?
Countries follow two
growth models
Distributed growth model:
Catching up supports
productivity growth
• AUT, CZE, DEU, ESP,
ITA, POL, PRT, ROU
Concentrated
growth model:
The “frontier”
dominates growth
• BGR, DNK, FIN,
FRA, GBR, GRC,
HUN, NLD, SVK,
SWE
0
0.01
0.02
0.03
0.04
0.05
0.06
0.07
0.08
0.09
0.1
Within countries Across countries Total inequality
Theil index for GDP per capita (European TL2 regions)
The result: Inequality across European
regions declined, but not within countries
75%
25%
50%
50%
7
Source : OECD (2018) Productivity and Jobs in a Globalised World: (How) Can All Regions Benefit?
55 000
65 000
75 000
85 000
95 000
105 000
2000 2002 2004 2006 2008 2010 2012 2014
Top 10% Bottom 90%
Average labour productivity (2010USD)
1% per year
1.1% per year
The challenge of combining growth,
catching up and inequality reduction
0.13
0.14
0.15
0.16
0.17
0.18
2000
2001
2002
2003
2004
2005
2006
2007
2008
2009
2010
2011
2012
2013
2014
Catching up dominates Frontier pulls away
Average inequality in per capita GDP across TL3 regions (Gini)
Catching up dominates: AUT, CZE, DEU, ESP,
ITA, POL, PRT, ROU
Frontier pulls away: BGR, DNK, FIN, FRA,
GBR, GRC, HUN, NLD, SVK, SWE
55 000
65 000
75 000
85 000
95 000
105 000
2000 2002 2004 2006 2008 2010 2012 2014
Top 10% Bottom 90%
Average labour productivity (2010USD)
1.6% per year
0.9% per year
8
Source:OECD(2018)ProductivityandJobsinaGlobalisedWorld:(How)CanAllRegionsBenefit?
WHAT SUPPORTS
“CATCHING UP”?
WELL-FUNCTIONING CITIES
9
• Well-functioning cities
– Home to knowledge-intensive (traded) sectors
– Larger markets can support economic
diversity and dynamism
– Agglomeration economies (beyond borders)
through urban-rural linkages
What supports catching up?
10
European frontier regions tend to be urban,
catching-up regions rural or intermediate
TL3 regions, 2000-2014
Frontier regions are those with the highest labour productivity (per worker
GDP) accounting for at least 10% of total employment.
Catching-up/diverging regions grew 5% more/less over a 15-year period
than their country’s frontier
11
Source :Adapted from OECD (2016) OECD Regional Outlook 2016: Productive Regions for Inclusive Societies
Traded clusters: Contrast between
urban and rural regions
12
Non-traded clusters
Music and Sound Recording
Communications Equipment
and Services
Video Production and
Distribution
Biopharmaceuticals
Financial Services
Insurance Services
Marketing, Design, and
Publishing
Business Services
Appliances
Nonmetal Mining
Agricultural Inputs and
Services
Apparel
Fishing and Fishing Products
Leather and Related Products
Forestry
Footwear
10 000
20 000
30 000
40 000
50 000
60 000
70 000
0 10 20 30 40 50 60 70 80 90 100
Average wage in 2010 EUR
Percentage of FTE in mostly urban areas, %
Source : OECD (2018) Productivity and Jobs in a Globalised World: (How) Can All Regions Benefit?
13
Space matters: proximity to cities benefits
surrounding rural & intermediate regions
Source: Ahrend and Schumann (2014) “Does regional economic growth
WHAT SUPPORTS
CATCHING UP?
TRADABLE SECTORS
14
• Tradable sectors (that could be traded)
– Face competition even if they are not traded
– Might overcome market size and institutional
constraints
– Avoid economic imbalances from excessive
expansion of non-tradables
15
What supports catching up?
Annual average GVA growth, 2000-13 Percentage of total GVA (right axis), 2013
-20
-10
0
10
20
30
40
50
60
70
80
-1
-0.5
0
0.5
1
1.5
2
2.5
3
3.5
4
Tradable
services
Industry
Agriculture
Non-tradable
services
%%
-20
-10
0
10
20
30
40
50
60
70
80
-1
-0.5
0
0.5
1
1.5
2
2.5
3
3.5
4
Tradable
services
Industry
Agriculture
Non-tradable
services
%%
-20
-10
0
10
20
30
40
50
60
70
80
-1
-0.5
0
0.5
1
1.5
2
2.5
3
3.5
4
Tradable
services
Industry
Agriculture
Non-tradable
services
%%
Goods
?
16
The nature of tradable sectors is changing
… but not in all parts of Europe
EU low-growth regions EU low-income regions Other European regions
Tradable
services
Low-income: <50% of EU-average per capita GDP; low-growth: <90% per capita GDP and below average growth
Source : OECD (2018) Productivity and Jobs in a Globalised World: (How) Can All Regions Benefit?
17
The 2007-08 crisis revealed
unsustainable growth models
21 000
22 000
23 000
24 000
25 000
26 000
27 000
Per capita GDP
17 000
18 000
19 000
20 000
21 000
22 000
23 000
24 000
25 000
26 000
Per capita GDPAndalusia, Spain Central Macedonia, Greece
• Across the OECD real per capita GDP in 2015 remained below 2007-08 levels in
135 out of 350 TL2 regions
• Construction- and consumption-fueled growth turned out to be unsustainable
Source : OECD (2018) Productivity and Jobs in a Globalised World: (How) Can All Regions Benefit?
Regions with strong pre-crisis increases
in non-tradable sectors lost more jobs
18
Calculations based on 208 OECD TL2 regions. Those regions with the largest
shifts towards non-tradable sectors suffered higher employment losses, on
average, following the 2007-08 crisis.
-3.5
-3
-2.5
-2
-1.5
-1
-0.5
0
0.5
1
Less than 2.5
percentage points
increase
2.5 to 5 percentage
points
5 to 7.5 percentage
points
More than 7.5
percentage points
increase
Change in the share of non-tradable employment, 2000-07
Employment growth (%), 2008-14
Source:OECD(2018)ProductivityandJobsinaGlobalisedWorld:
(How)CanAllRegionsBenefit?
WHAT CAN POLICY DO TO
LEVERAGE THE POTENTIAL
OF ALL REGIONS?
19
• Reigniting (public)
investment
• Structural reforms
(accompanied by
complementary
policies at the local
level)
• Multi-level
governance and
territorial reforms
20
Broad policy responses
Investment (GFCF in 2005 EUR) in 2014 higher than in 2007-08
Investment set back by 7 years
8 - 12 years
13 - 16 years
17 - 19 years
20 or more years
Source:OECD(2018)ProductivityandJobsinaGlobalisedWorld:(How)CanAllRegionsBenefit?
• Strategically diversifying regional economies
– Specialised regions more productive, diversified ones grow faster
– Manufacturing important, but tradable services are gaining
• Identifying and building on local strengths
– Linking investment in skills, FDI, and knowledge from the
supply chain
– Taking advantage of opportunities for territorial branding
• Integration across actors and policies
– Skills development for place-based needs is a shared
responsibility
– But skills policies might not be enough: trade shocks vs
automation
Strategies to promote catching up and
employment growth
21
OECD (2018)
Productivity and Jobs in a Globalised World:
(How) Can All Regions Benefit
http://www.oecd.org/publications/productivity-
and-jobs-in-a-globalised-world-9789264293137-
en.htm
OECD (2016)
OECD Regional Outlook 2016:
Productive Regions for Inclusive Societies
http://www.oecd.org/regional/oecd-regional-
outlook-2016-9789264260245-en.htm
Thank you
22
• The distinguishing feature of “tradable” sectors is that they are exposed to
international competition
• Delineating tradable and non-tradable sectors is not straightforward in practice
• As sectors are highly aggregated in regional data the aim is to find a
classification that captures mostly tradable/non-tradable activities
The OECD Regional Outlook 2016 classifies sectors as:
23
Classification of tradable sectors:
exposure to international competition
Tradable sectors Non-tradable sectors
A: agriculture, forestry and fishing F: construction
B-E: industry (manufacturing, mining and
quarrying, supply of utilities: electricity, gas
water, etc.) excluding construction
G-I: wholesale and retail trade, transport,
accommodation and food service activities
J: information and communication L: real estate activities*
K: financial and insurance activities M-N: professional, scientific and technical
activities, administrative and support service
activities
R-U: arts, entertainment and recreation, other
service activities, activities of household and
extra-territorial organisations and bodies
O-Q: public administration, defence, education,
human health and social work activities
* excluded in parts of the analysis

Launch OECD report on Productivity and jobs in a globalised world

  • 1.
    PRODUCTIVITY AND JOBS INA GLOBALISED WORLD: (HOW) CAN ALL REGIONS BENEFIT? Committee of the Regions 26 April 2018 Joaquim Oliveira Martins Special Advisor to the Director OECD Centre for Entrepreneurship, SMEs, Regions and Cities
  • 2.
    • Productivity andjobs: the regional diffusion challenge • What supports “catching up”? • What can policy do to leverage the potential of all regions? 2 Roadmap for the presentation
  • 3.
    PRODUCTIVITY AND JOBS: THEREGIONAL DIFFUSION CHALLENGE 3
  • 4.
    Long-term decline inproductivity growth rates: not just the crisis Source: OECD Productivity database; moving averages (t, t-1, t-2) Aggregate trends of labour productivity growth, 2000-2016 4-0.5 0 0.5 1 1.5 2 2.5 3 2000 2001 2002 2003 2004 2005 2006 2007 2008 2009 2010 2011 2012 2013 2014 2015 2016 Japan US Euro Area Financial crisis
  • 5.
    Convergence in per capitaGDP and labour productivity in the OECD/EU Frontier regions • most productive regions accounting for 10% of total employment Catching up/Diverging • Productivity growth is 5% higher/lower than in the frontier over a 13 year period 5 Source:OECD(2018)ProductivityandJobsinaGlobalisedWorld:(How)CanAllRegionsBenefit? Productivity gaps have narrowed in the EU and the OECD since 2000
  • 6.
    6 But gaps withinsome countries are widening Source:OECD(2018)ProductivityandJobsinaGlobalisedWorld:(How)CanAllRegionsBenefit? Countries follow two growth models Distributed growth model: Catching up supports productivity growth • AUT, CZE, DEU, ESP, ITA, POL, PRT, ROU Concentrated growth model: The “frontier” dominates growth • BGR, DNK, FIN, FRA, GBR, GRC, HUN, NLD, SVK, SWE
  • 7.
    0 0.01 0.02 0.03 0.04 0.05 0.06 0.07 0.08 0.09 0.1 Within countries Acrosscountries Total inequality Theil index for GDP per capita (European TL2 regions) The result: Inequality across European regions declined, but not within countries 75% 25% 50% 50% 7 Source : OECD (2018) Productivity and Jobs in a Globalised World: (How) Can All Regions Benefit?
  • 8.
    55 000 65 000 75000 85 000 95 000 105 000 2000 2002 2004 2006 2008 2010 2012 2014 Top 10% Bottom 90% Average labour productivity (2010USD) 1% per year 1.1% per year The challenge of combining growth, catching up and inequality reduction 0.13 0.14 0.15 0.16 0.17 0.18 2000 2001 2002 2003 2004 2005 2006 2007 2008 2009 2010 2011 2012 2013 2014 Catching up dominates Frontier pulls away Average inequality in per capita GDP across TL3 regions (Gini) Catching up dominates: AUT, CZE, DEU, ESP, ITA, POL, PRT, ROU Frontier pulls away: BGR, DNK, FIN, FRA, GBR, GRC, HUN, NLD, SVK, SWE 55 000 65 000 75 000 85 000 95 000 105 000 2000 2002 2004 2006 2008 2010 2012 2014 Top 10% Bottom 90% Average labour productivity (2010USD) 1.6% per year 0.9% per year 8 Source:OECD(2018)ProductivityandJobsinaGlobalisedWorld:(How)CanAllRegionsBenefit?
  • 9.
  • 10.
    • Well-functioning cities –Home to knowledge-intensive (traded) sectors – Larger markets can support economic diversity and dynamism – Agglomeration economies (beyond borders) through urban-rural linkages What supports catching up? 10
  • 11.
    European frontier regionstend to be urban, catching-up regions rural or intermediate TL3 regions, 2000-2014 Frontier regions are those with the highest labour productivity (per worker GDP) accounting for at least 10% of total employment. Catching-up/diverging regions grew 5% more/less over a 15-year period than their country’s frontier 11 Source :Adapted from OECD (2016) OECD Regional Outlook 2016: Productive Regions for Inclusive Societies
  • 12.
    Traded clusters: Contrastbetween urban and rural regions 12 Non-traded clusters Music and Sound Recording Communications Equipment and Services Video Production and Distribution Biopharmaceuticals Financial Services Insurance Services Marketing, Design, and Publishing Business Services Appliances Nonmetal Mining Agricultural Inputs and Services Apparel Fishing and Fishing Products Leather and Related Products Forestry Footwear 10 000 20 000 30 000 40 000 50 000 60 000 70 000 0 10 20 30 40 50 60 70 80 90 100 Average wage in 2010 EUR Percentage of FTE in mostly urban areas, % Source : OECD (2018) Productivity and Jobs in a Globalised World: (How) Can All Regions Benefit?
  • 13.
    13 Space matters: proximityto cities benefits surrounding rural & intermediate regions Source: Ahrend and Schumann (2014) “Does regional economic growth
  • 14.
  • 15.
    • Tradable sectors(that could be traded) – Face competition even if they are not traded – Might overcome market size and institutional constraints – Avoid economic imbalances from excessive expansion of non-tradables 15 What supports catching up?
  • 16.
    Annual average GVAgrowth, 2000-13 Percentage of total GVA (right axis), 2013 -20 -10 0 10 20 30 40 50 60 70 80 -1 -0.5 0 0.5 1 1.5 2 2.5 3 3.5 4 Tradable services Industry Agriculture Non-tradable services %% -20 -10 0 10 20 30 40 50 60 70 80 -1 -0.5 0 0.5 1 1.5 2 2.5 3 3.5 4 Tradable services Industry Agriculture Non-tradable services %% -20 -10 0 10 20 30 40 50 60 70 80 -1 -0.5 0 0.5 1 1.5 2 2.5 3 3.5 4 Tradable services Industry Agriculture Non-tradable services %% Goods ? 16 The nature of tradable sectors is changing … but not in all parts of Europe EU low-growth regions EU low-income regions Other European regions Tradable services Low-income: <50% of EU-average per capita GDP; low-growth: <90% per capita GDP and below average growth Source : OECD (2018) Productivity and Jobs in a Globalised World: (How) Can All Regions Benefit?
  • 17.
    17 The 2007-08 crisisrevealed unsustainable growth models 21 000 22 000 23 000 24 000 25 000 26 000 27 000 Per capita GDP 17 000 18 000 19 000 20 000 21 000 22 000 23 000 24 000 25 000 26 000 Per capita GDPAndalusia, Spain Central Macedonia, Greece • Across the OECD real per capita GDP in 2015 remained below 2007-08 levels in 135 out of 350 TL2 regions • Construction- and consumption-fueled growth turned out to be unsustainable Source : OECD (2018) Productivity and Jobs in a Globalised World: (How) Can All Regions Benefit?
  • 18.
    Regions with strongpre-crisis increases in non-tradable sectors lost more jobs 18 Calculations based on 208 OECD TL2 regions. Those regions with the largest shifts towards non-tradable sectors suffered higher employment losses, on average, following the 2007-08 crisis. -3.5 -3 -2.5 -2 -1.5 -1 -0.5 0 0.5 1 Less than 2.5 percentage points increase 2.5 to 5 percentage points 5 to 7.5 percentage points More than 7.5 percentage points increase Change in the share of non-tradable employment, 2000-07 Employment growth (%), 2008-14 Source:OECD(2018)ProductivityandJobsinaGlobalisedWorld: (How)CanAllRegionsBenefit?
  • 19.
    WHAT CAN POLICYDO TO LEVERAGE THE POTENTIAL OF ALL REGIONS? 19
  • 20.
    • Reigniting (public) investment •Structural reforms (accompanied by complementary policies at the local level) • Multi-level governance and territorial reforms 20 Broad policy responses Investment (GFCF in 2005 EUR) in 2014 higher than in 2007-08 Investment set back by 7 years 8 - 12 years 13 - 16 years 17 - 19 years 20 or more years Source:OECD(2018)ProductivityandJobsinaGlobalisedWorld:(How)CanAllRegionsBenefit?
  • 21.
    • Strategically diversifyingregional economies – Specialised regions more productive, diversified ones grow faster – Manufacturing important, but tradable services are gaining • Identifying and building on local strengths – Linking investment in skills, FDI, and knowledge from the supply chain – Taking advantage of opportunities for territorial branding • Integration across actors and policies – Skills development for place-based needs is a shared responsibility – But skills policies might not be enough: trade shocks vs automation Strategies to promote catching up and employment growth 21
  • 22.
    OECD (2018) Productivity andJobs in a Globalised World: (How) Can All Regions Benefit http://www.oecd.org/publications/productivity- and-jobs-in-a-globalised-world-9789264293137- en.htm OECD (2016) OECD Regional Outlook 2016: Productive Regions for Inclusive Societies http://www.oecd.org/regional/oecd-regional- outlook-2016-9789264260245-en.htm Thank you 22
  • 23.
    • The distinguishingfeature of “tradable” sectors is that they are exposed to international competition • Delineating tradable and non-tradable sectors is not straightforward in practice • As sectors are highly aggregated in regional data the aim is to find a classification that captures mostly tradable/non-tradable activities The OECD Regional Outlook 2016 classifies sectors as: 23 Classification of tradable sectors: exposure to international competition Tradable sectors Non-tradable sectors A: agriculture, forestry and fishing F: construction B-E: industry (manufacturing, mining and quarrying, supply of utilities: electricity, gas water, etc.) excluding construction G-I: wholesale and retail trade, transport, accommodation and food service activities J: information and communication L: real estate activities* K: financial and insurance activities M-N: professional, scientific and technical activities, administrative and support service activities R-U: arts, entertainment and recreation, other service activities, activities of household and extra-territorial organisations and bodies O-Q: public administration, defence, education, human health and social work activities * excluded in parts of the analysis

Editor's Notes

  • #22 Based on this analysis with a focus on tradable sectors, policy recommendations include, among others: ensuring adequate skills provision and support for labour mobility to adjust to shocks; building on the network of cities across a country; avoiding disincentives for firms to engage in tradable sectors; promoting tradable activities and strategic diversification in related sectors through a range of policies, including clusters; increasing the mechanisms for innovation diffusion and improved management practices; and encouraging regions to compete based on region-specific advantages over tax competition.