Download to read offline
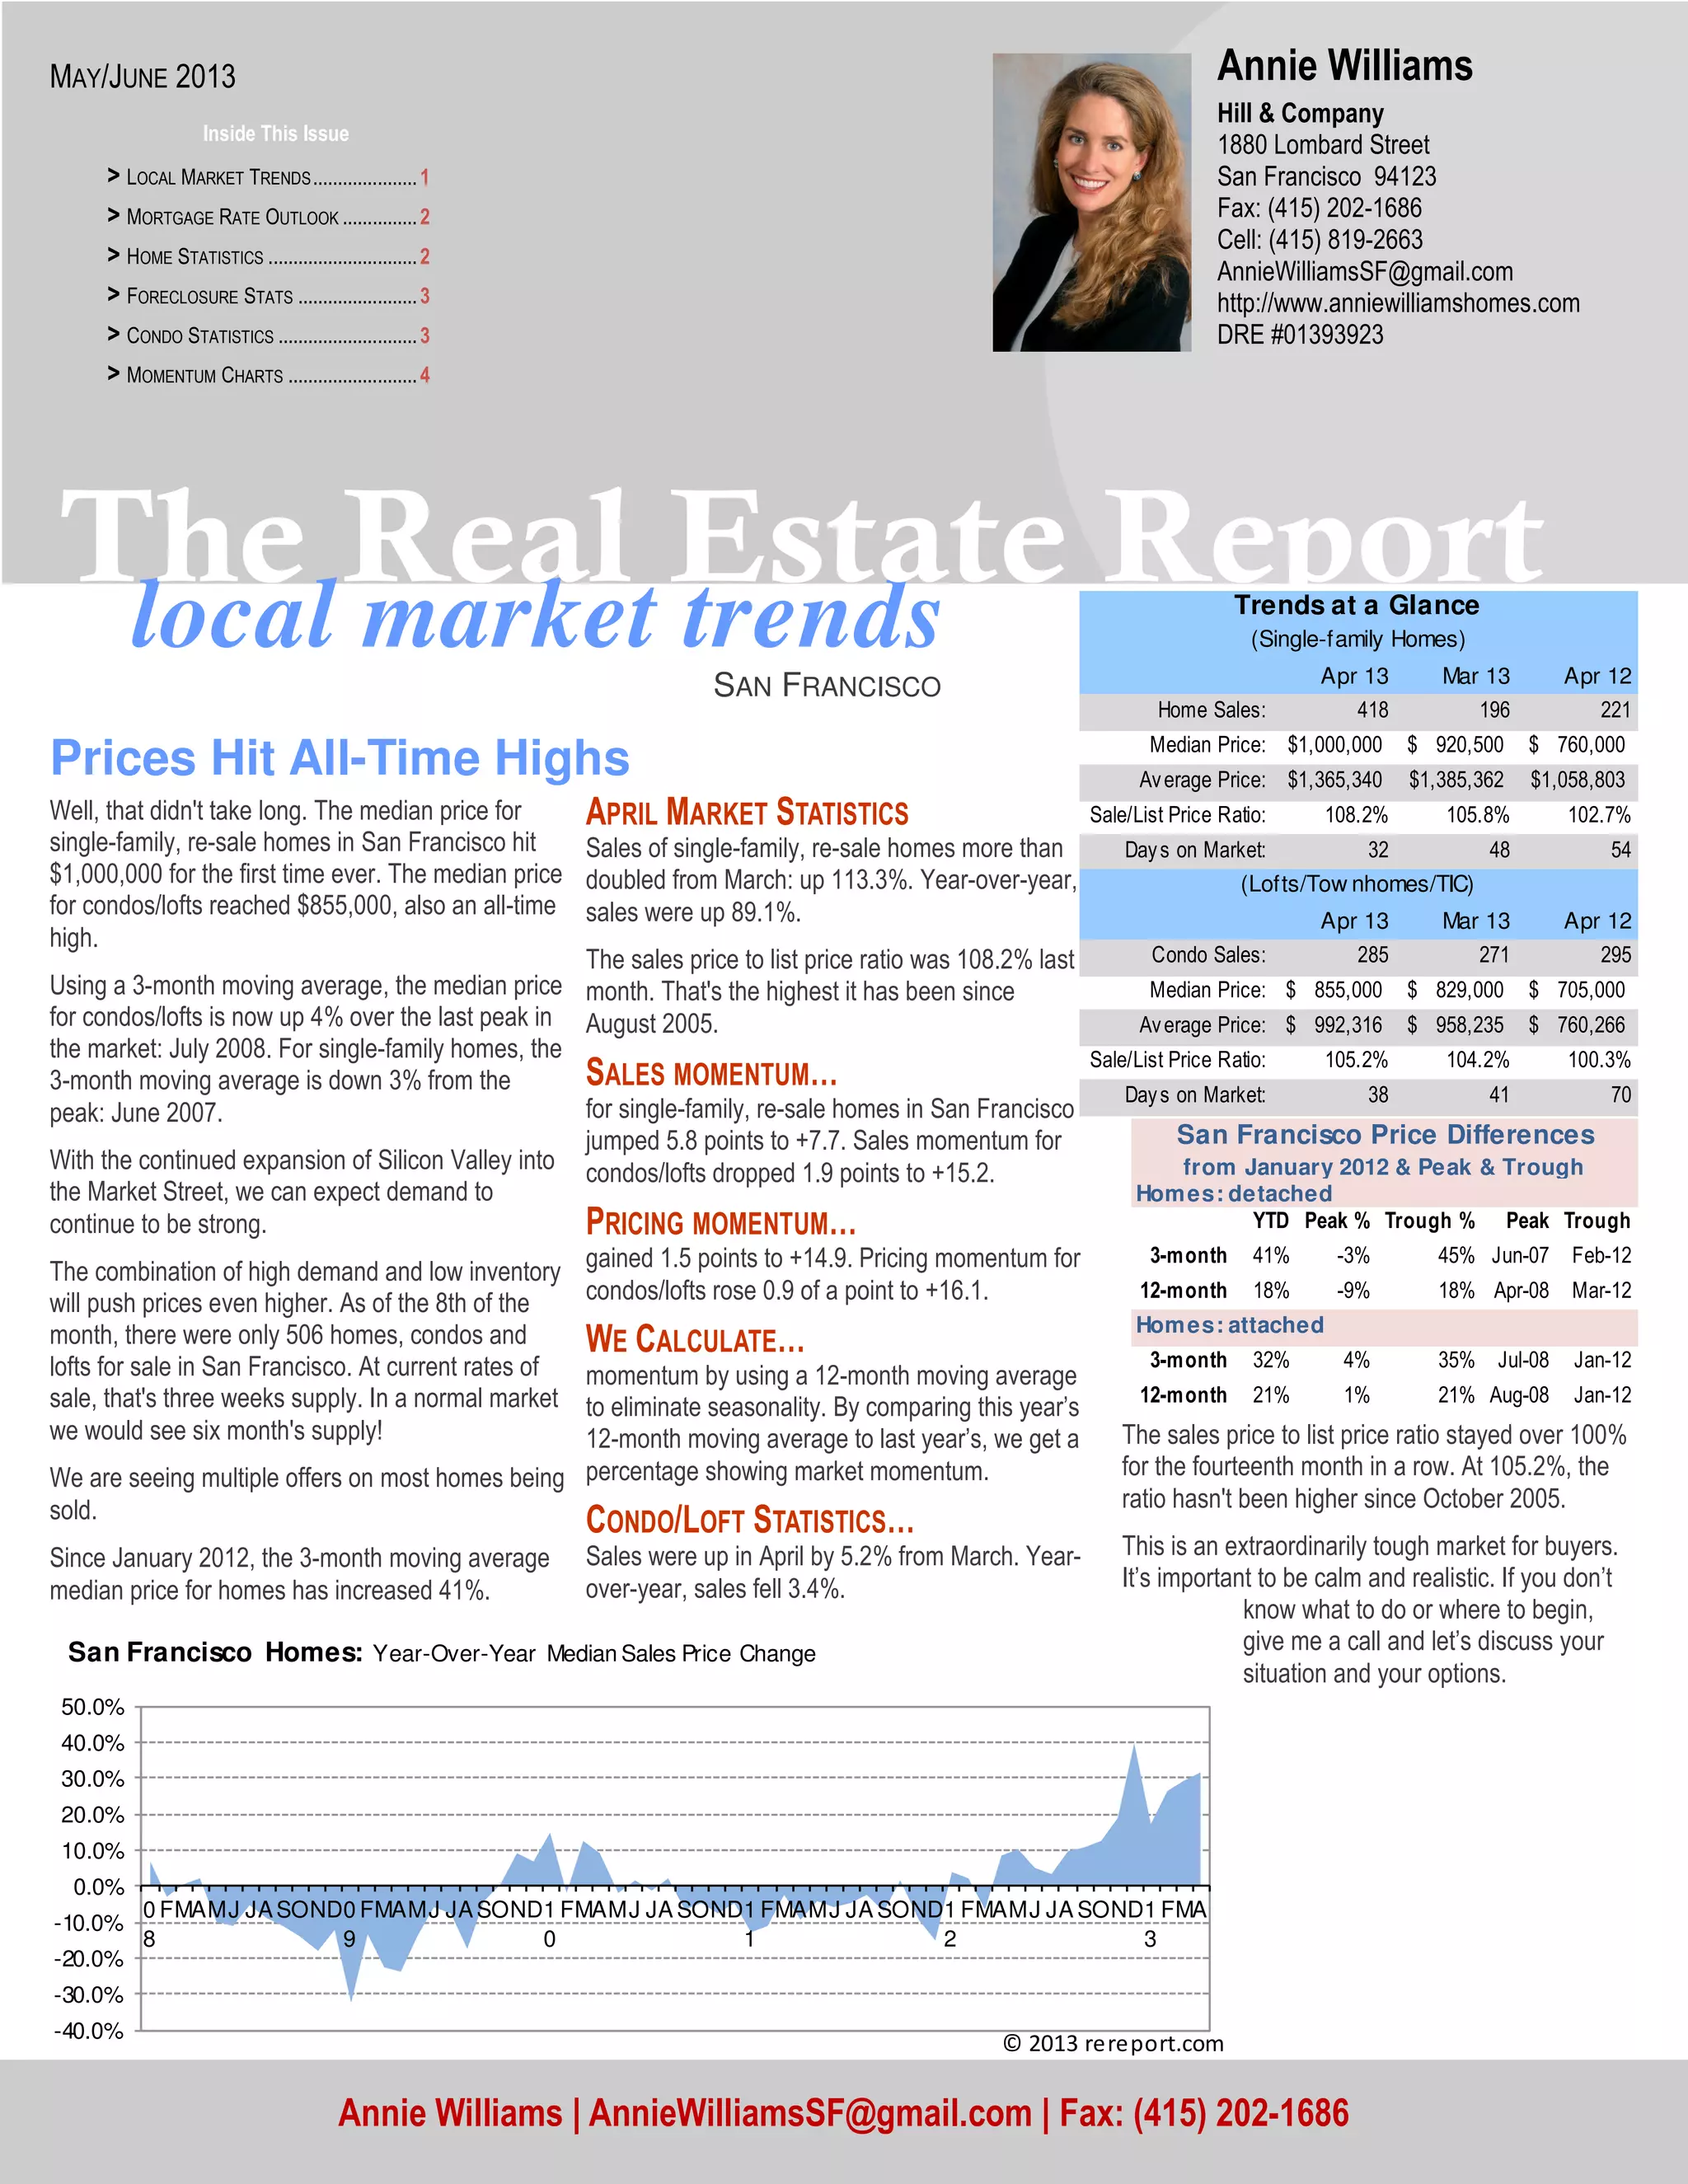
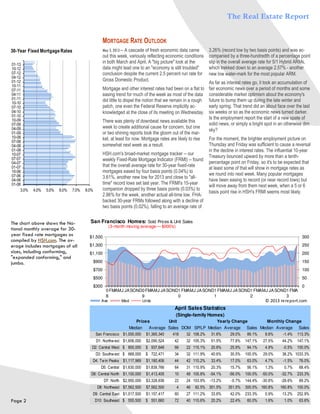
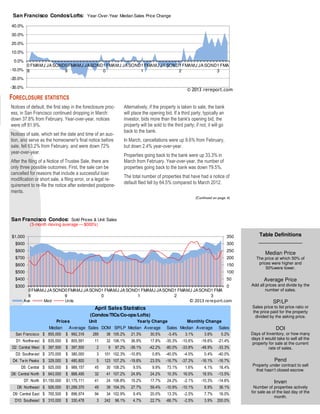

The San Francisco housing market saw record high median home and condo prices in April. Home sales more than doubled from March, while condo sales rose slightly. The sales to price ratio remained very high, indicating a seller's market with buyers paying well over the asking price. Inventory remained extremely low, at just over three weeks of supply. The report expects prices to continue rising due to high demand and low supply in the area.


![Fe Stival15[1]](https://cdn.slidesharecdn.com/ss_thumbnails/festival151-090811210413-phpapp01-thumbnail.jpg?width=640&height=640&fit=bounds)


