Download to read offline
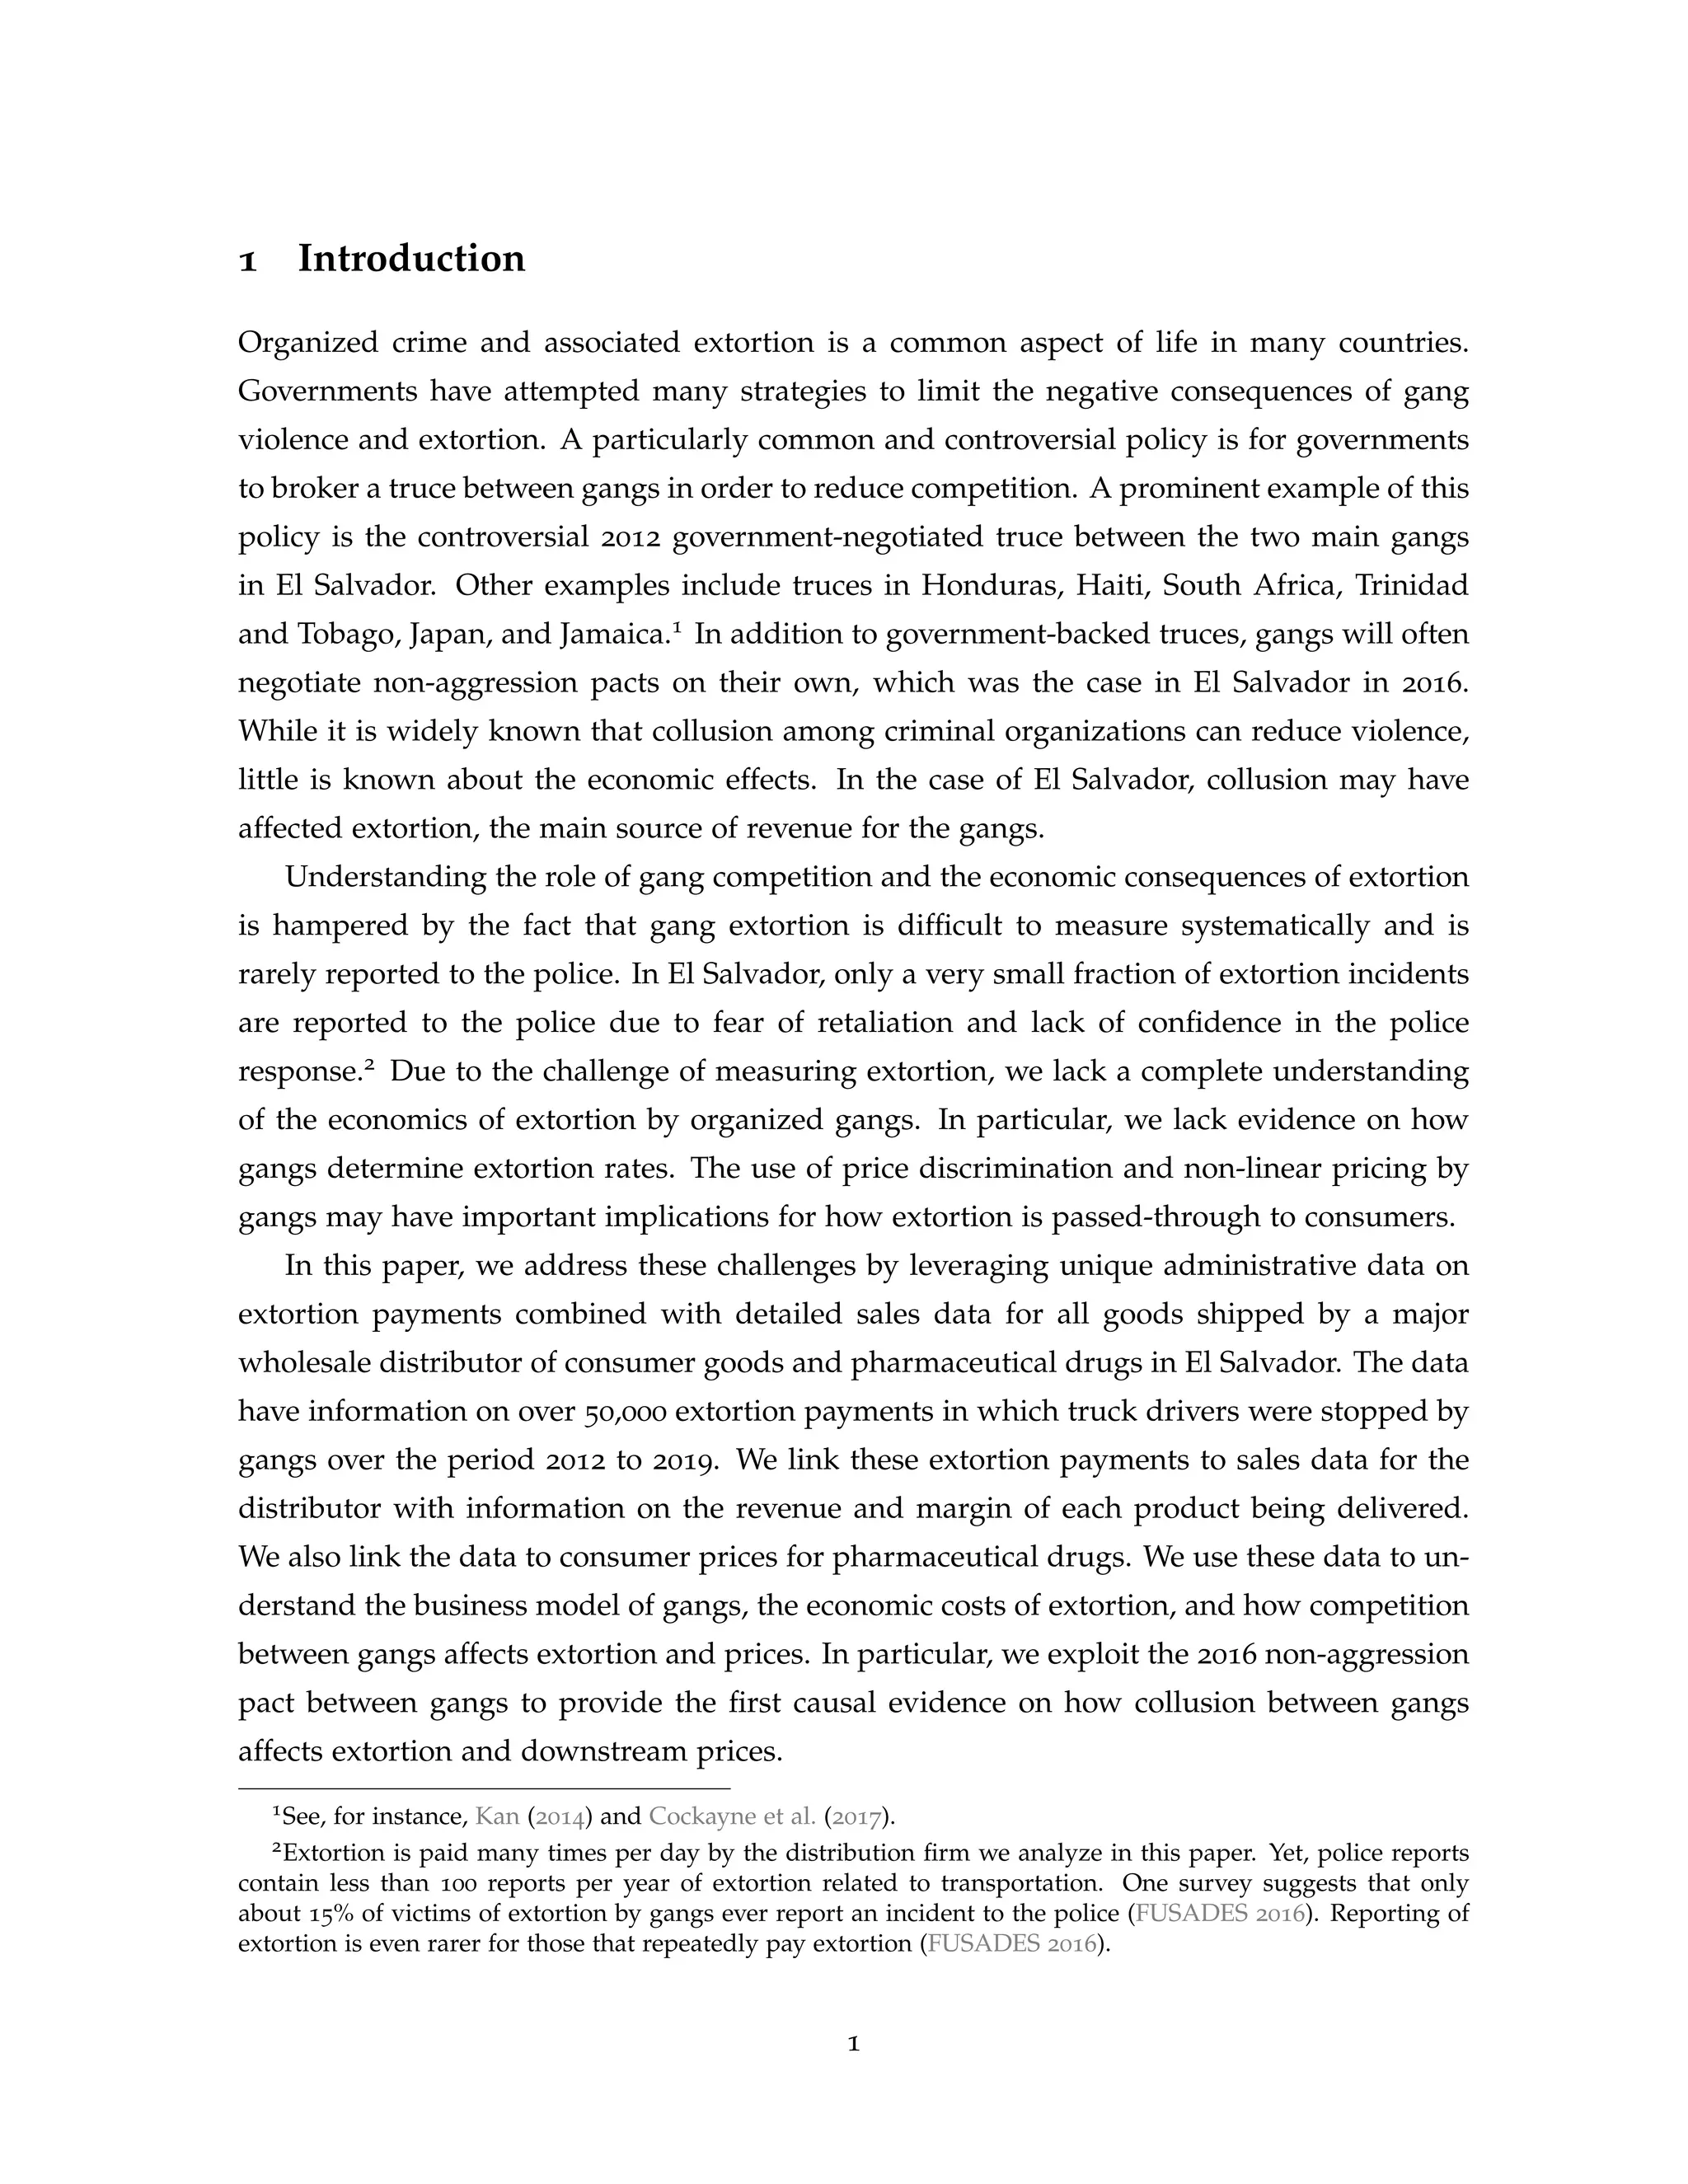
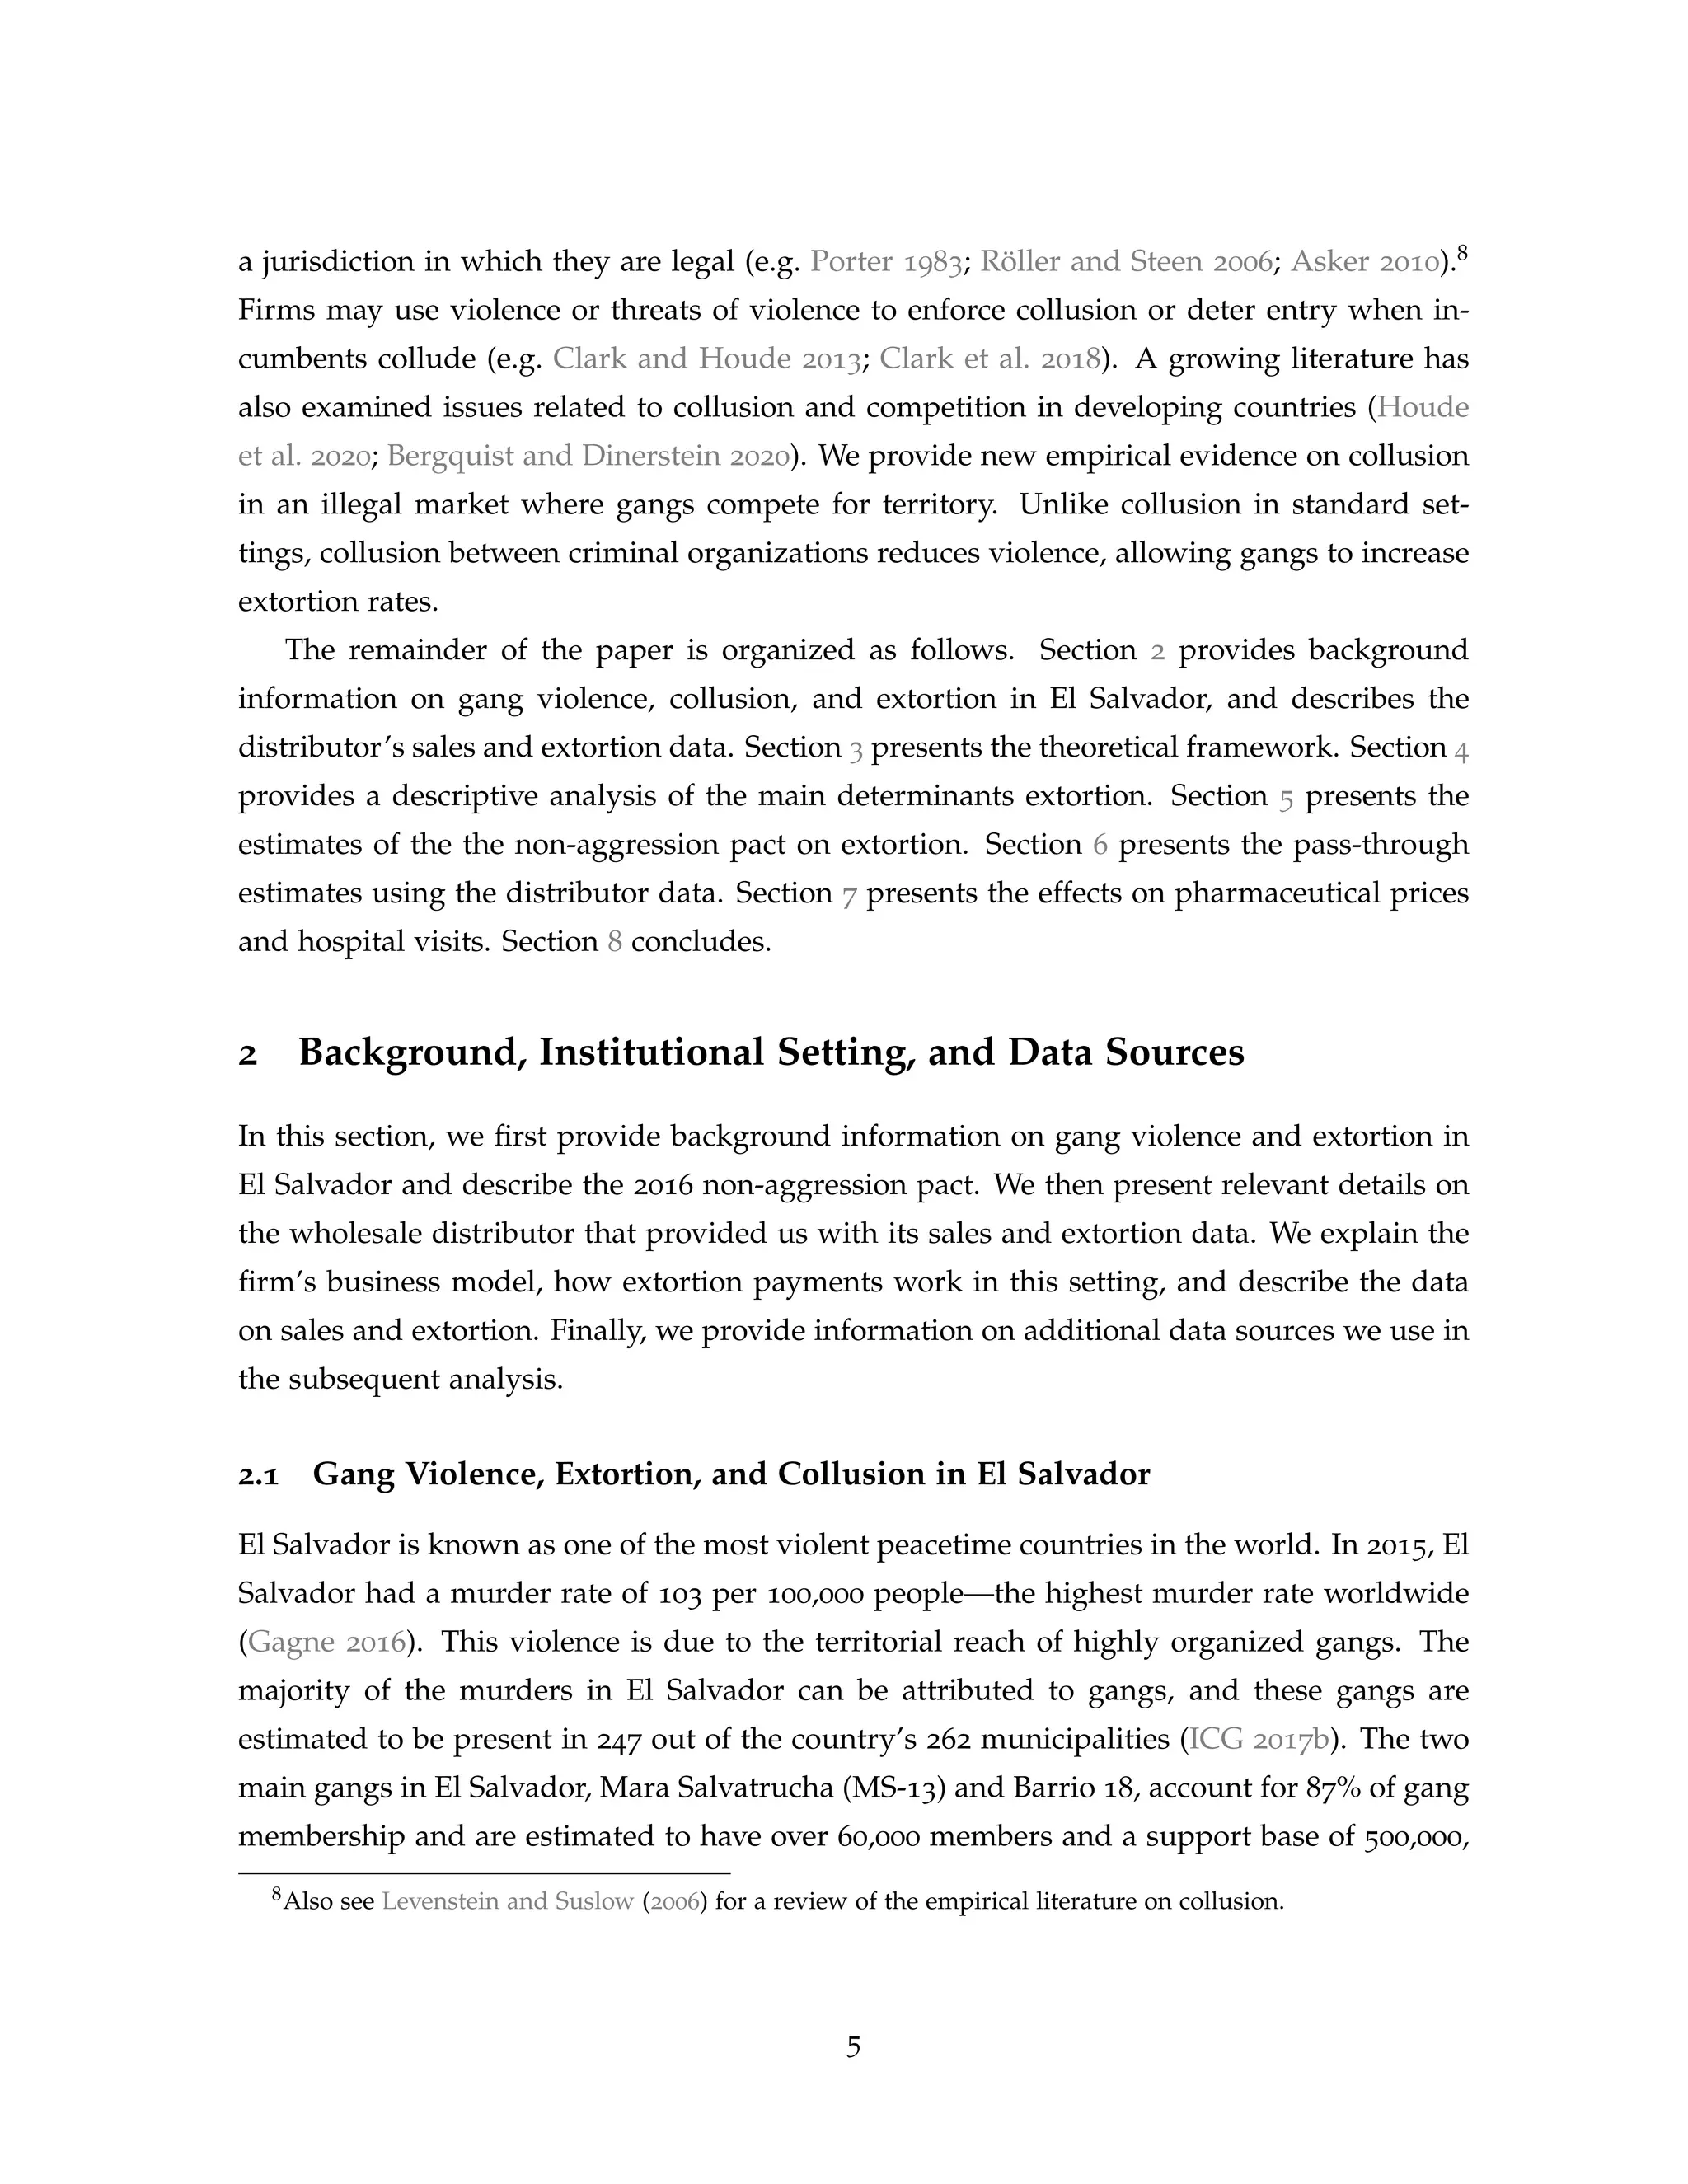
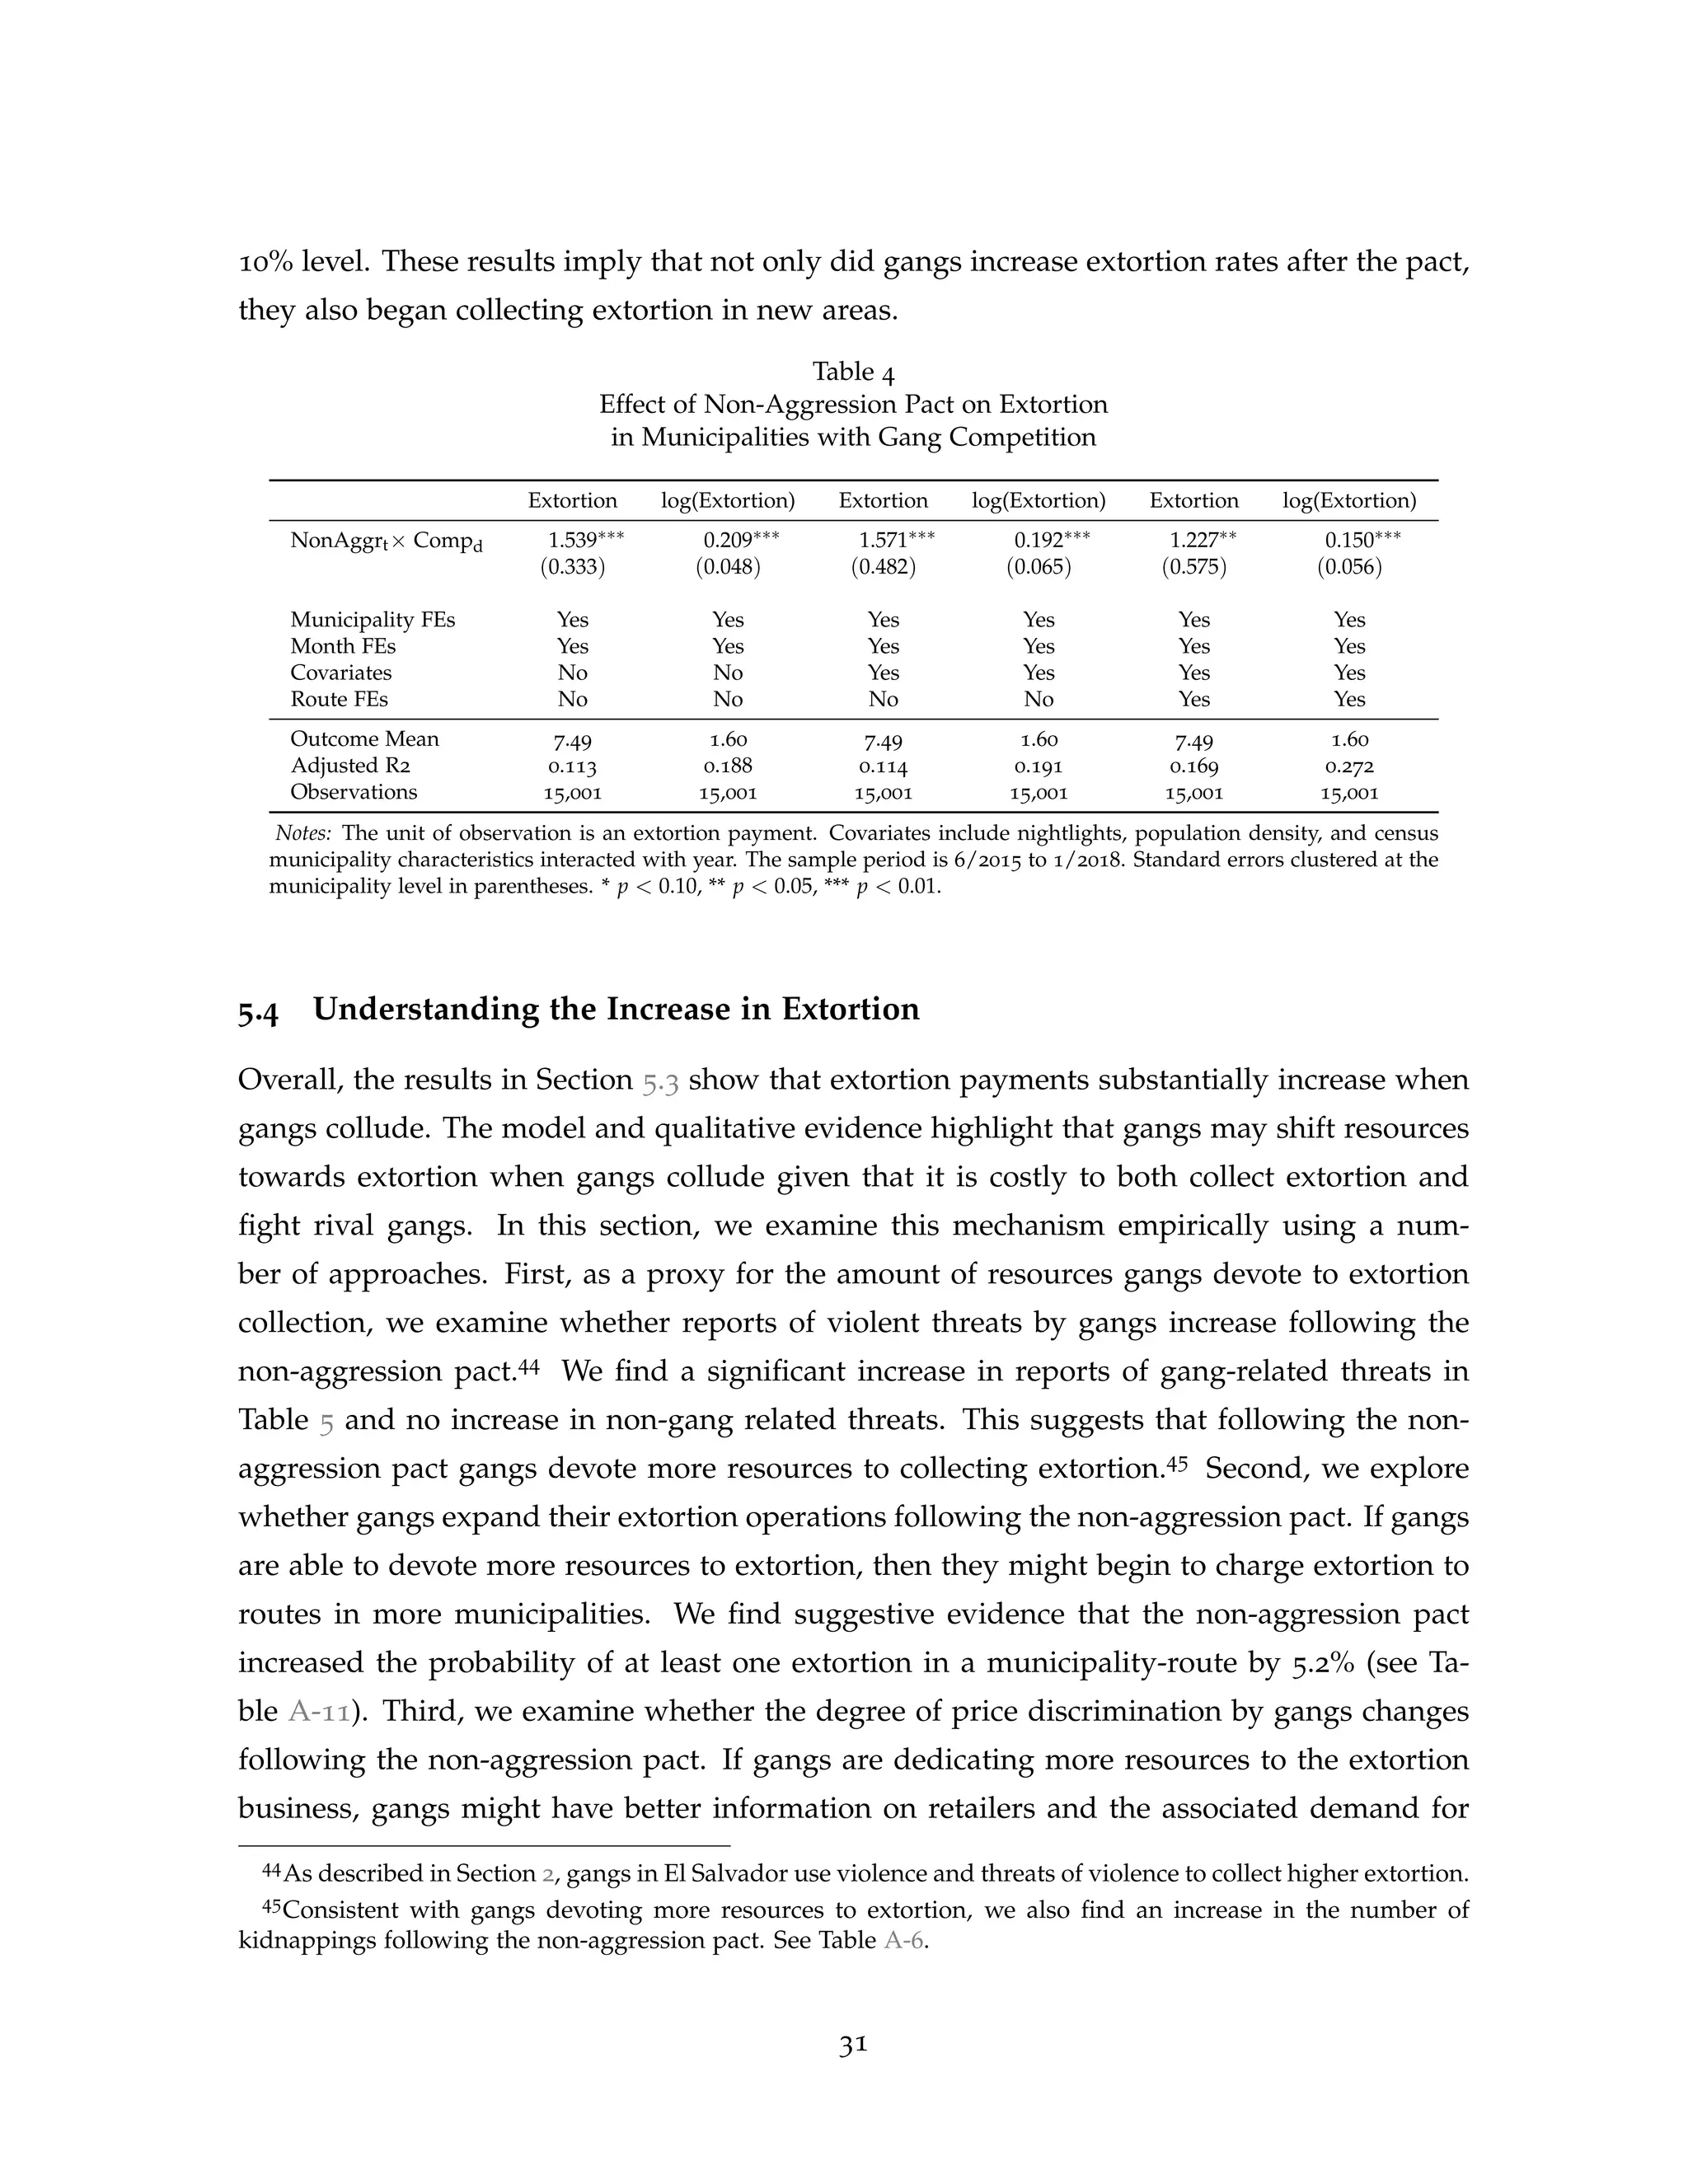
![Following the announcement of the non-aggression pact, homicides immediately fell by
nearly half in the three subsequent months, as seen in Figure 1. This drop in homicides was
mainly due to less violence between gangs: an MS-13 spokesman said at the time that “if you
have seen the reduction in homicides, it is because the [gangs] are not attacking each other”
(Martínez 2016a). There is little information about the status of the non-aggression pact in
subsequent years; however, the homicide rate has remained low relative to the period before
the pact. This has led many to speculate that the non-aggression pact was still in place as of
the end of our sample period (Papadovassilakis 2020).
While it is well known that both the 2012 truce and 2016 non-aggression pact affected
homicides, it is also possible that extortion rates were affected. Some have speculated that
cooperation between the gangs could allow gangs to grow stronger and increase extortion.
For instance, Dudley (2013) notes that “one theory [is] that the gang truce was really an
effort by larger criminal interests to grant the MS-13 and Barrio 18 more breathing room for
their operations.” MS-13 and Barrio 18 have a limited number of gang members, and there is
anecdotal evidence that when they compete for territory, they have fewer resources to extort
businesses.14 In particular, the truce may have freed up gang members to more credibly
threaten violence, increasing the ability of gangs to request high extortion payments.15 In
addition, it may be more dangerous to collect extortion when gang members are being
targeted by a rival gang. These issues suggest that it is costly for gangs to both compete
for territory and collect extortion. After the non-aggression pact, gangs may have been able
to focus their resources on collecting extortion.16 We explore this issue in the theoretical
framework we present in Section 3.
2.2 Extortion and Sales for Distribution Firm
We use extortion payment data and sales data for all goods delivered by a leading wholesale
distributor in El Salvador for the period 2012 to 2019.17 The distributor is a major sup-
plier of both consumer products and pharmaceuticals. The company buys these goods in
bulk from manufacturers—often from abroad—and resells the products to local retailers and
pharmacies. The firm has exclusive licensing rights with certain major international brands,
allowing them to be the sole distributor of these goods in El Salvador.
14Martínez (2016b) gives an example of a school that faces low extortion because it is in disputed gang territory,
unlike surrounding area.
15In a similar way, Olken and Barron (2009) finds that the number of officers at checkpoints is associated with
higher extortion payments.
16This is mainly because when gangs cooperate and do not fight each other for territorial control, they are able
to focus more resources on extortion (ICG 2020).
17Due to a confidentiality agreement with the firm, we do not name the firm.
8](https://image.slidesharecdn.com/competitionforextortion11-210608131931/75/Market-Structure-and-Extortion-Evidence-from-50-000-Extortion-Payments-9-2048.jpg)

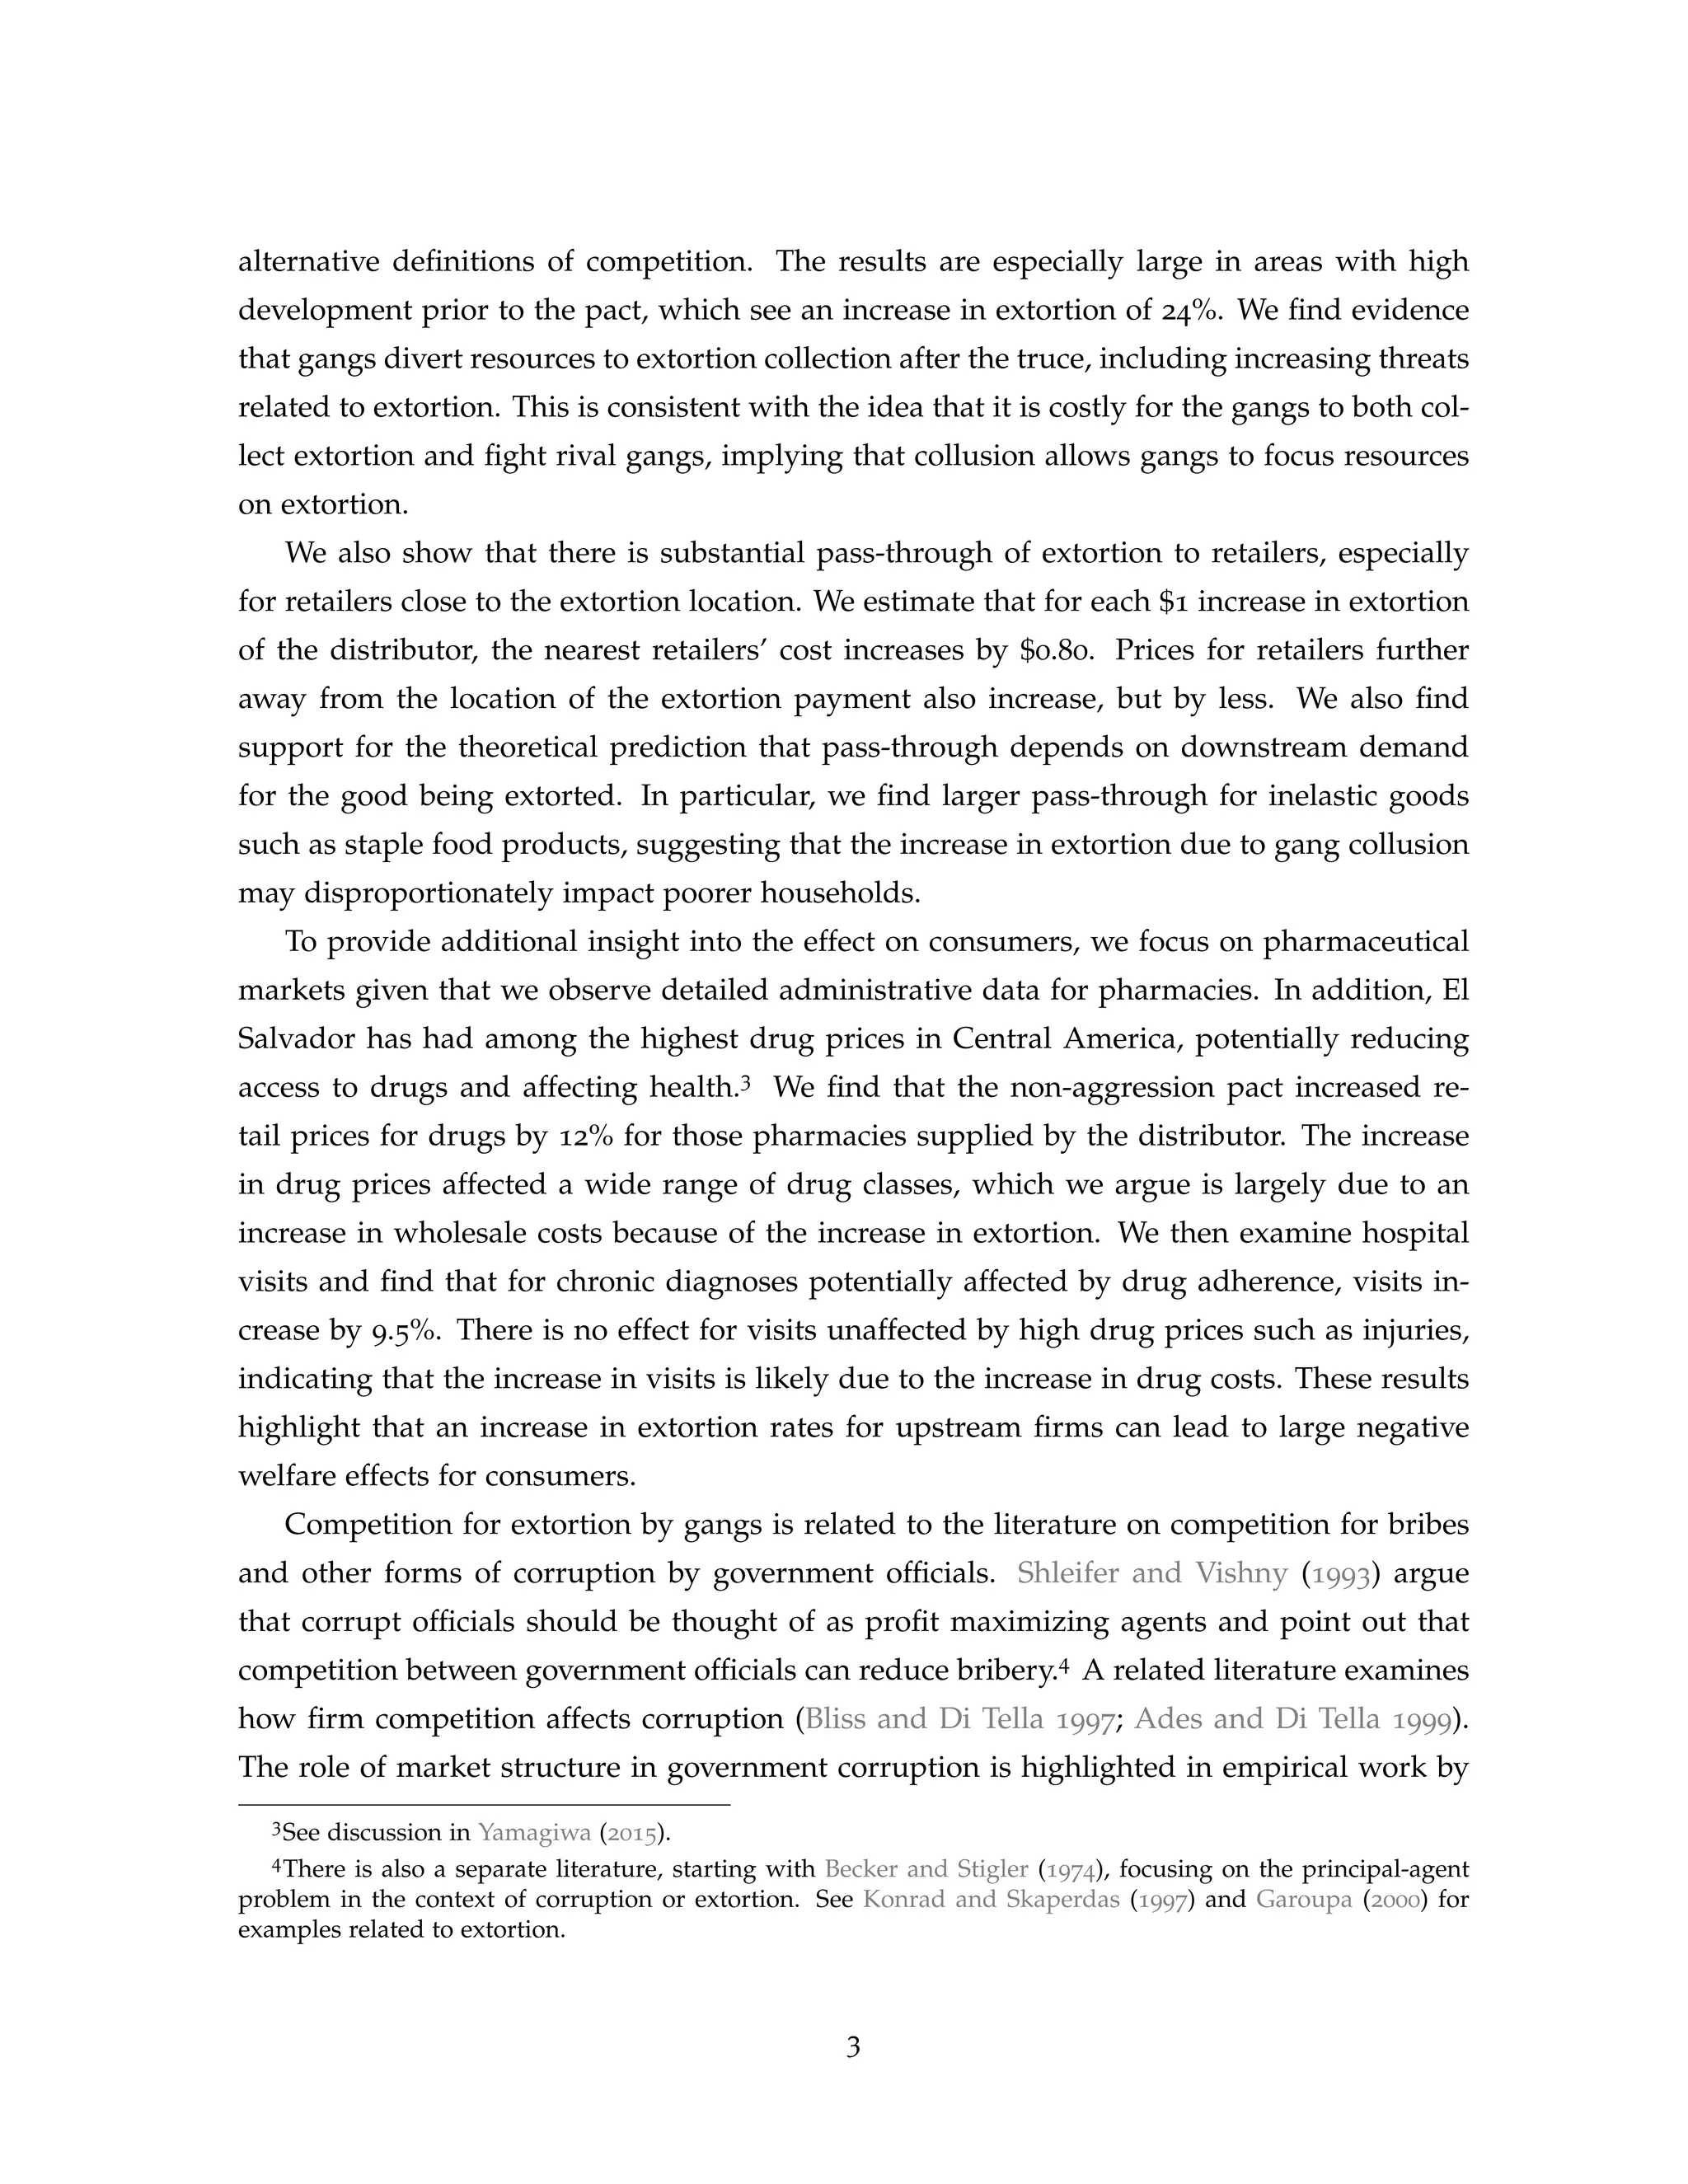
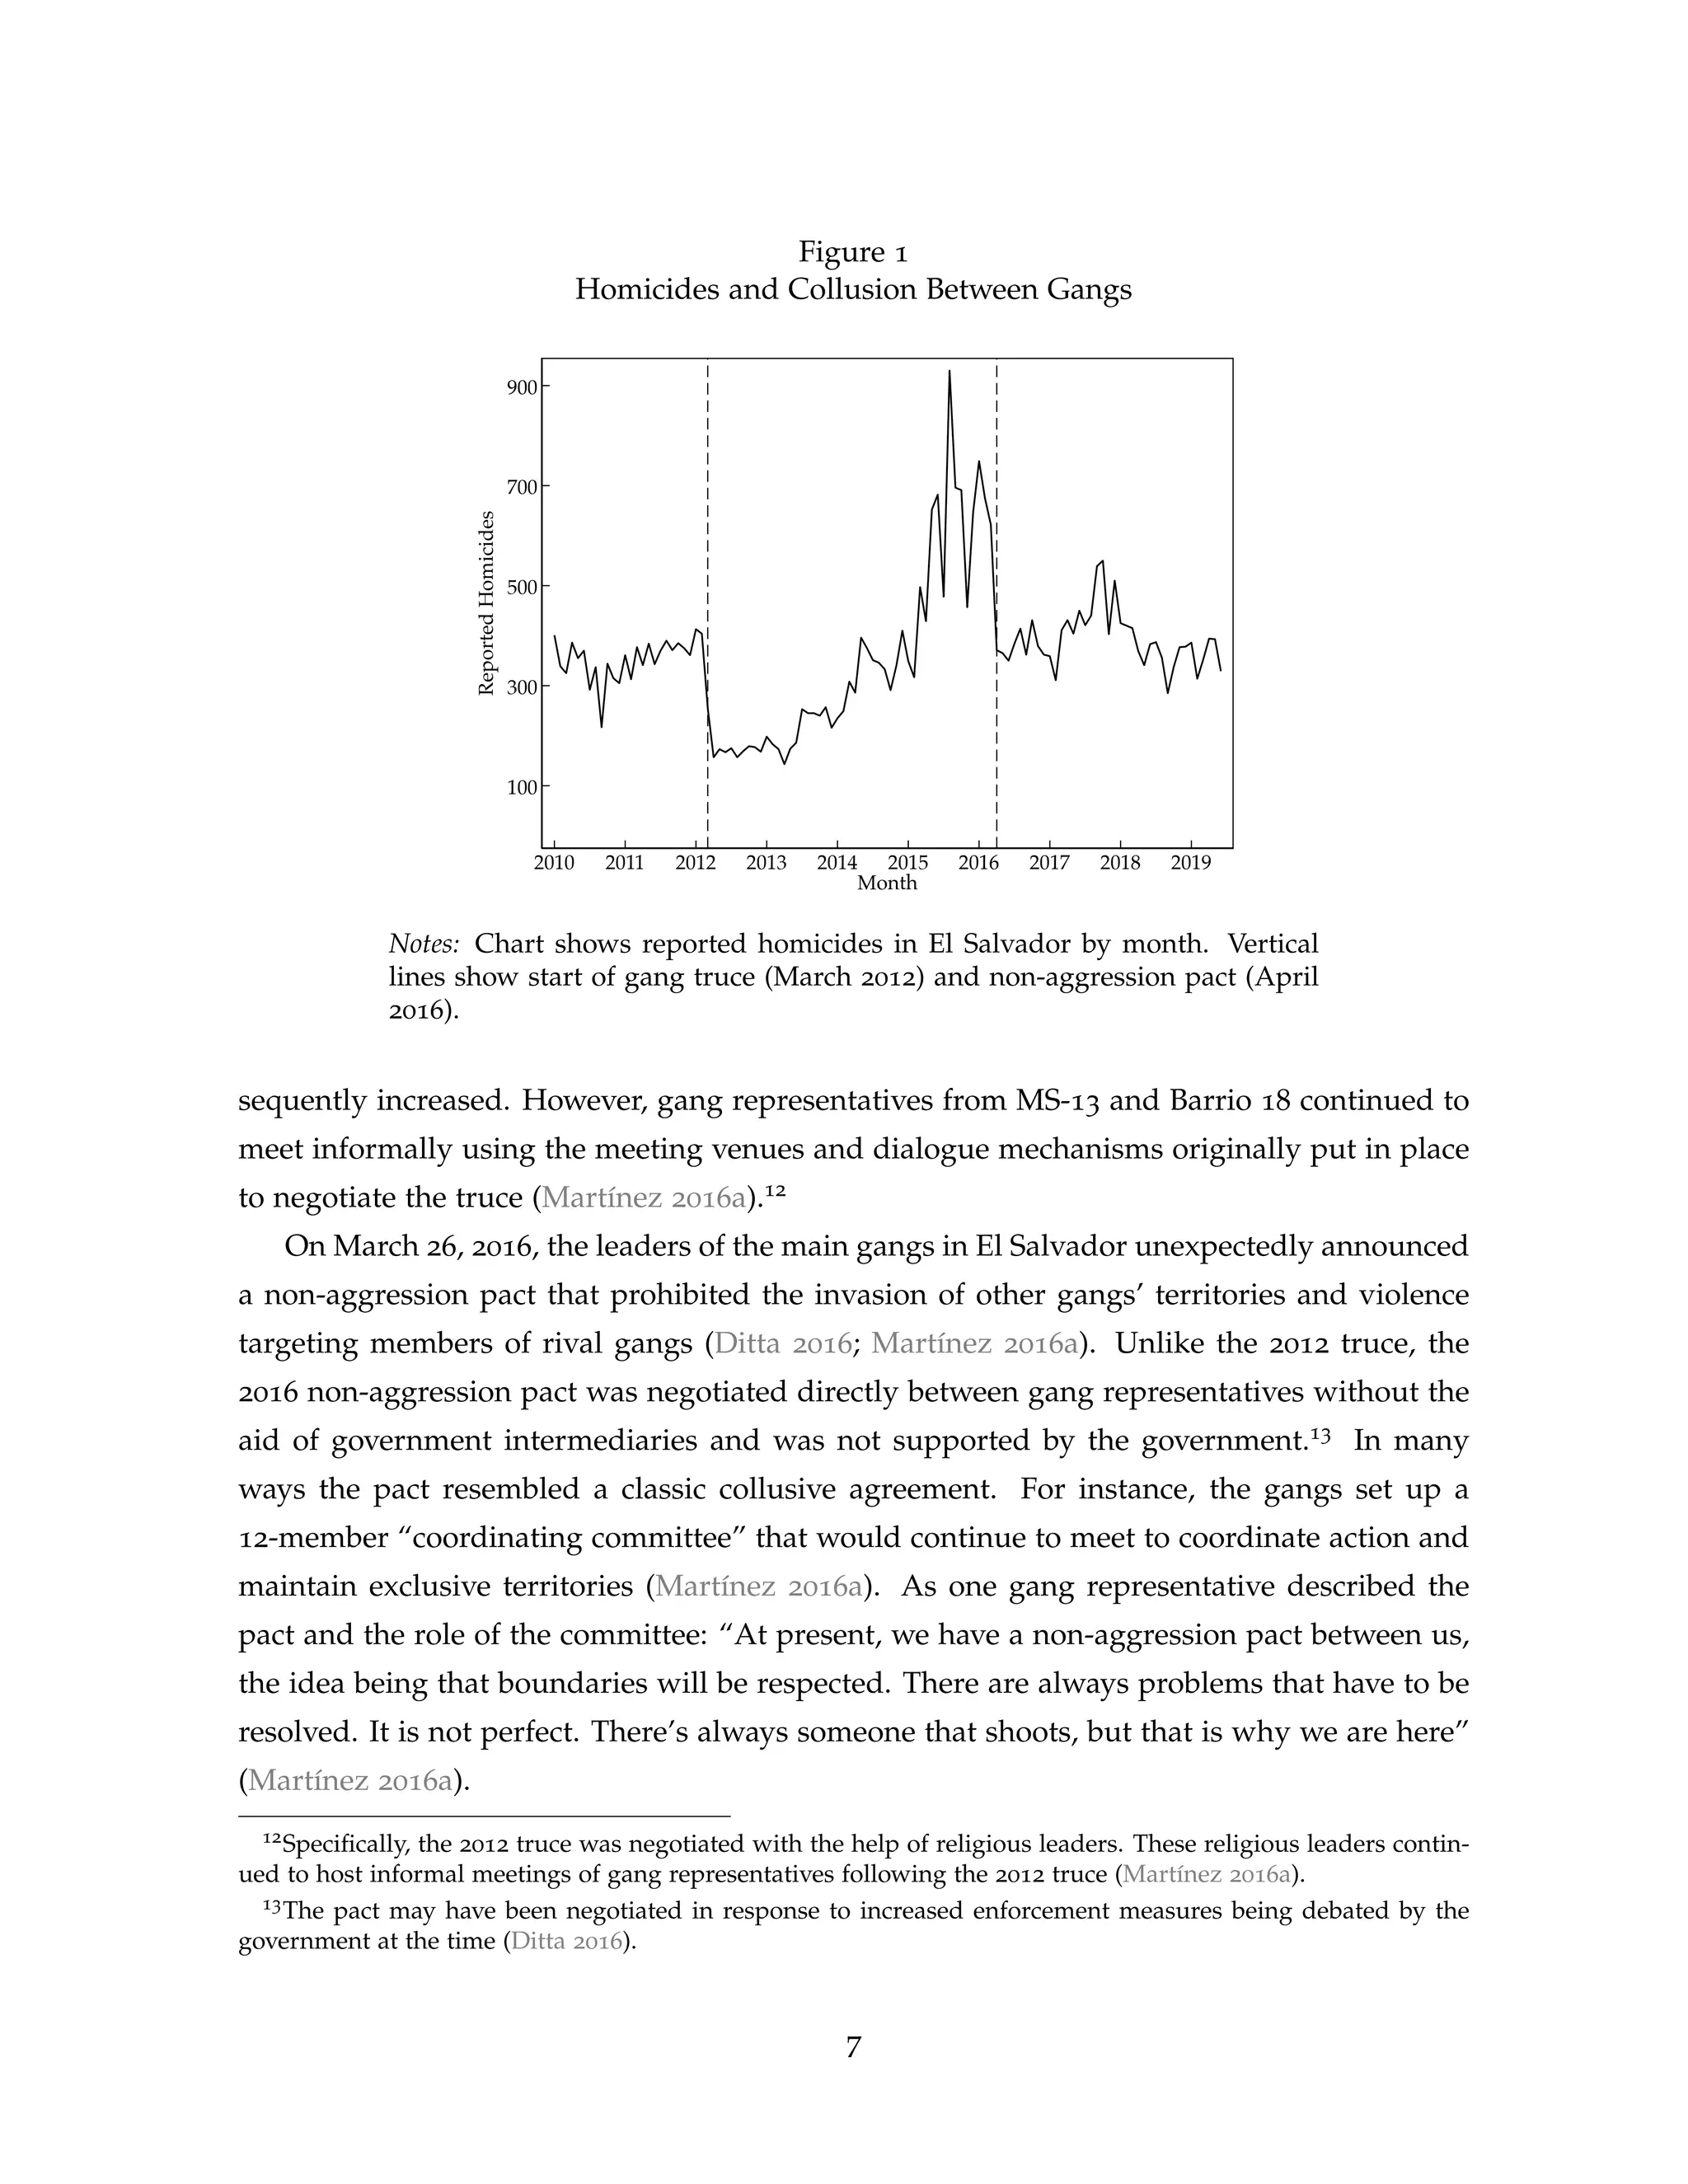
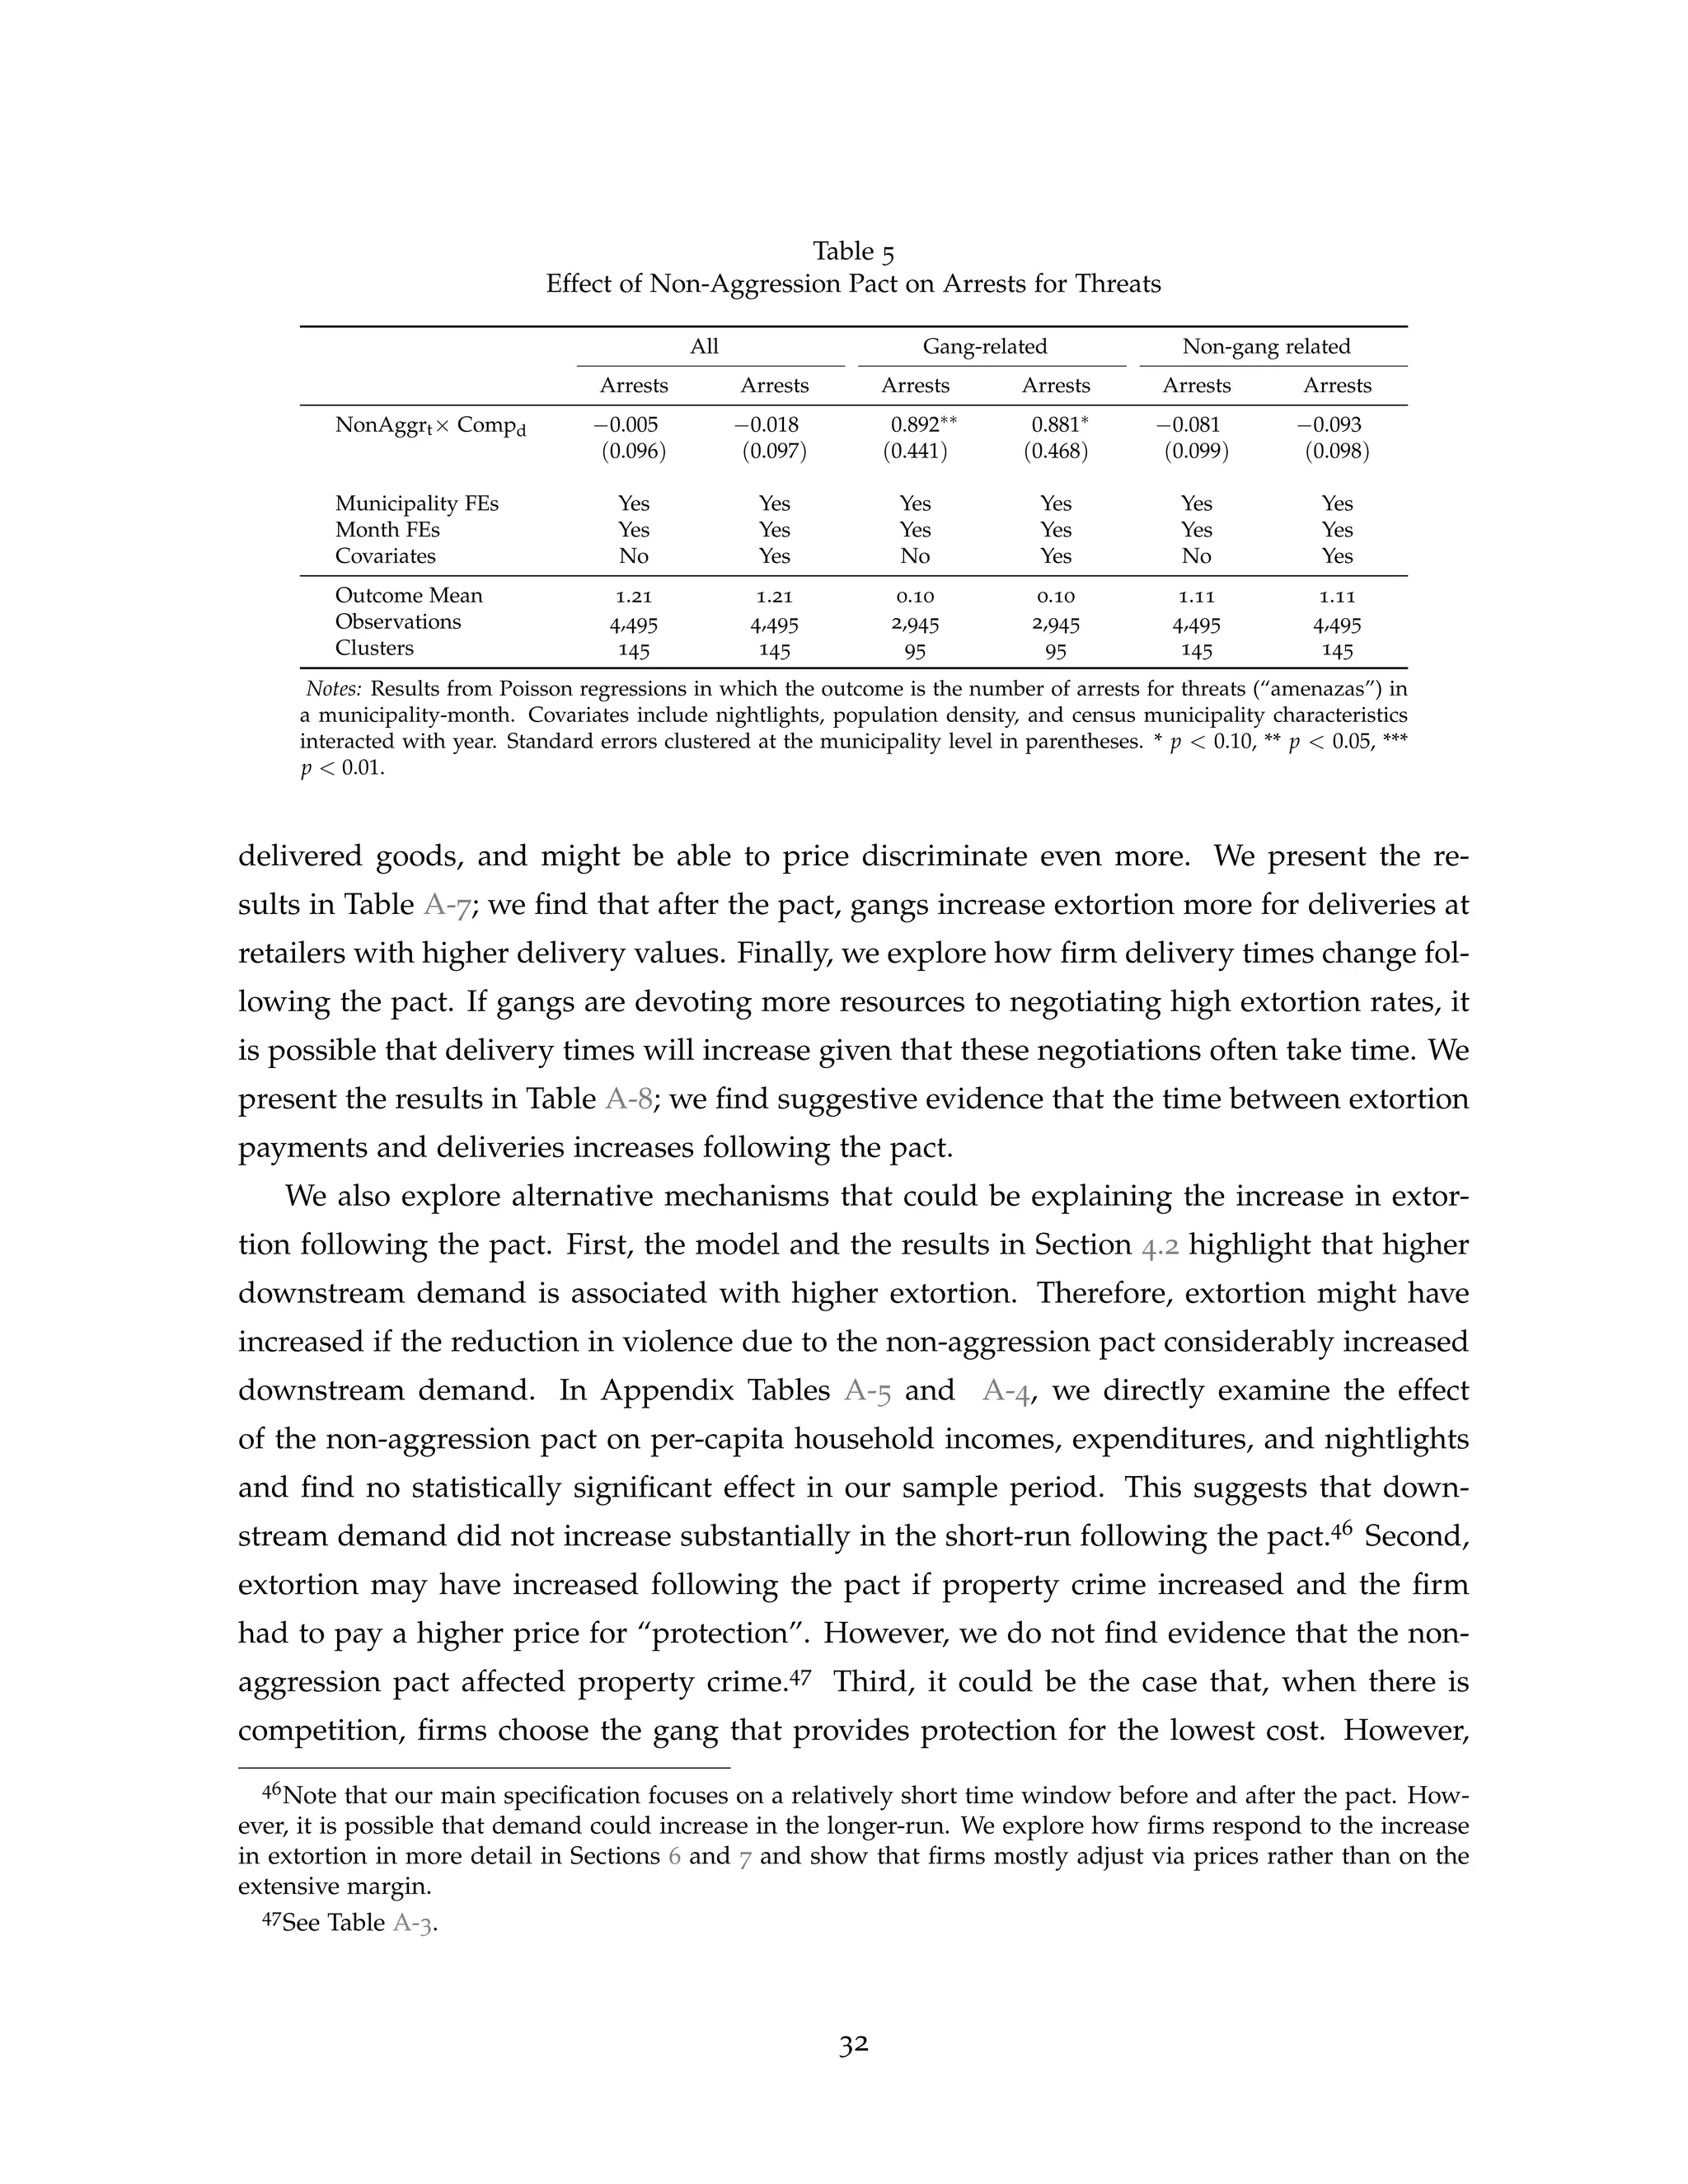
![Figure 4
Simulated Extortion, Prices, and Violence as a Function of Demand
Under Competition and Collusion
One gang Two gangs
Violence
αc
Demand Shifter (α)
Competition Collusion
One gang Two gangs
Extortion
αc
Demand Shifter (α)
Competition Collusion
One gang Two gangs
Downstream
Price
αc
Demand Shifter (α)
Competition Collusion
a. Violence (hgt) b. Extortion (egt) c. Price (pgt)
Notes: Charts show simulated outcomes for β = 1, φ = 0.2, and F = 17. The x-axis shows
log(α) for α in interval [6, 12]. The vertical line shows the threshold, αc, for entry by a
second gang.
In municipalities with high demand, there is incentive for both gangs to enter. In this
case, collusion decreases violence relative to the case with gang competition. Specifically,
violence declines by ( α
6φ )2 if gangs can maintain the cooperative equilibrium. This is consis-
tent with the large and well-documented reduction in homicides and other violence after the
start of both the 2012 truce and 2016 non-aggression pact. The model implies that violence
is a byproduct of competition over extortion territory and is unnecessary when gangs can
agree on an allocation of territory. Furthermore, violence under competition is increasing in
α, which corresponds to demand that is relatively less elastic. In other words, there is greater
incentive for the gang to fight rivals for territory when there are larger returns due to more
inelastic demand. This can be seen graphically in Figure 4 Panel a when α αc.
Relative to the case with gang competition, collusion increases extortion by α
6β in ar-
eas where both gangs are present. Loosely speaking, when gangs collude, they focus on
extracting extortion from firms in their territory rather than expanding territory. This in
turn increases downstream prices by α
12β since the downstream firm effectively has higher
marginal cost. In general, the degree of pass-through of extortion to downstream prices
depends on the specific demand function and is ultimately an empirical question.
Gangs may price discriminate when demand differs across markets or products. Figure 4
Panel b and Panel c show extortion and prices as a function of α. When the demand curve
in a market is more inelastic, there is more scope for the gang to charge high extortion. This
effect is exacerbated when gangs collude. An important caveat is that gangs may lack full
information about demand, making it difficult to perfectly price discriminate.
18](https://image.slidesharecdn.com/competitionforextortion11-210608131931/75/Market-Structure-and-Extortion-Evidence-from-50-000-Extortion-Payments-19-2048.jpg)
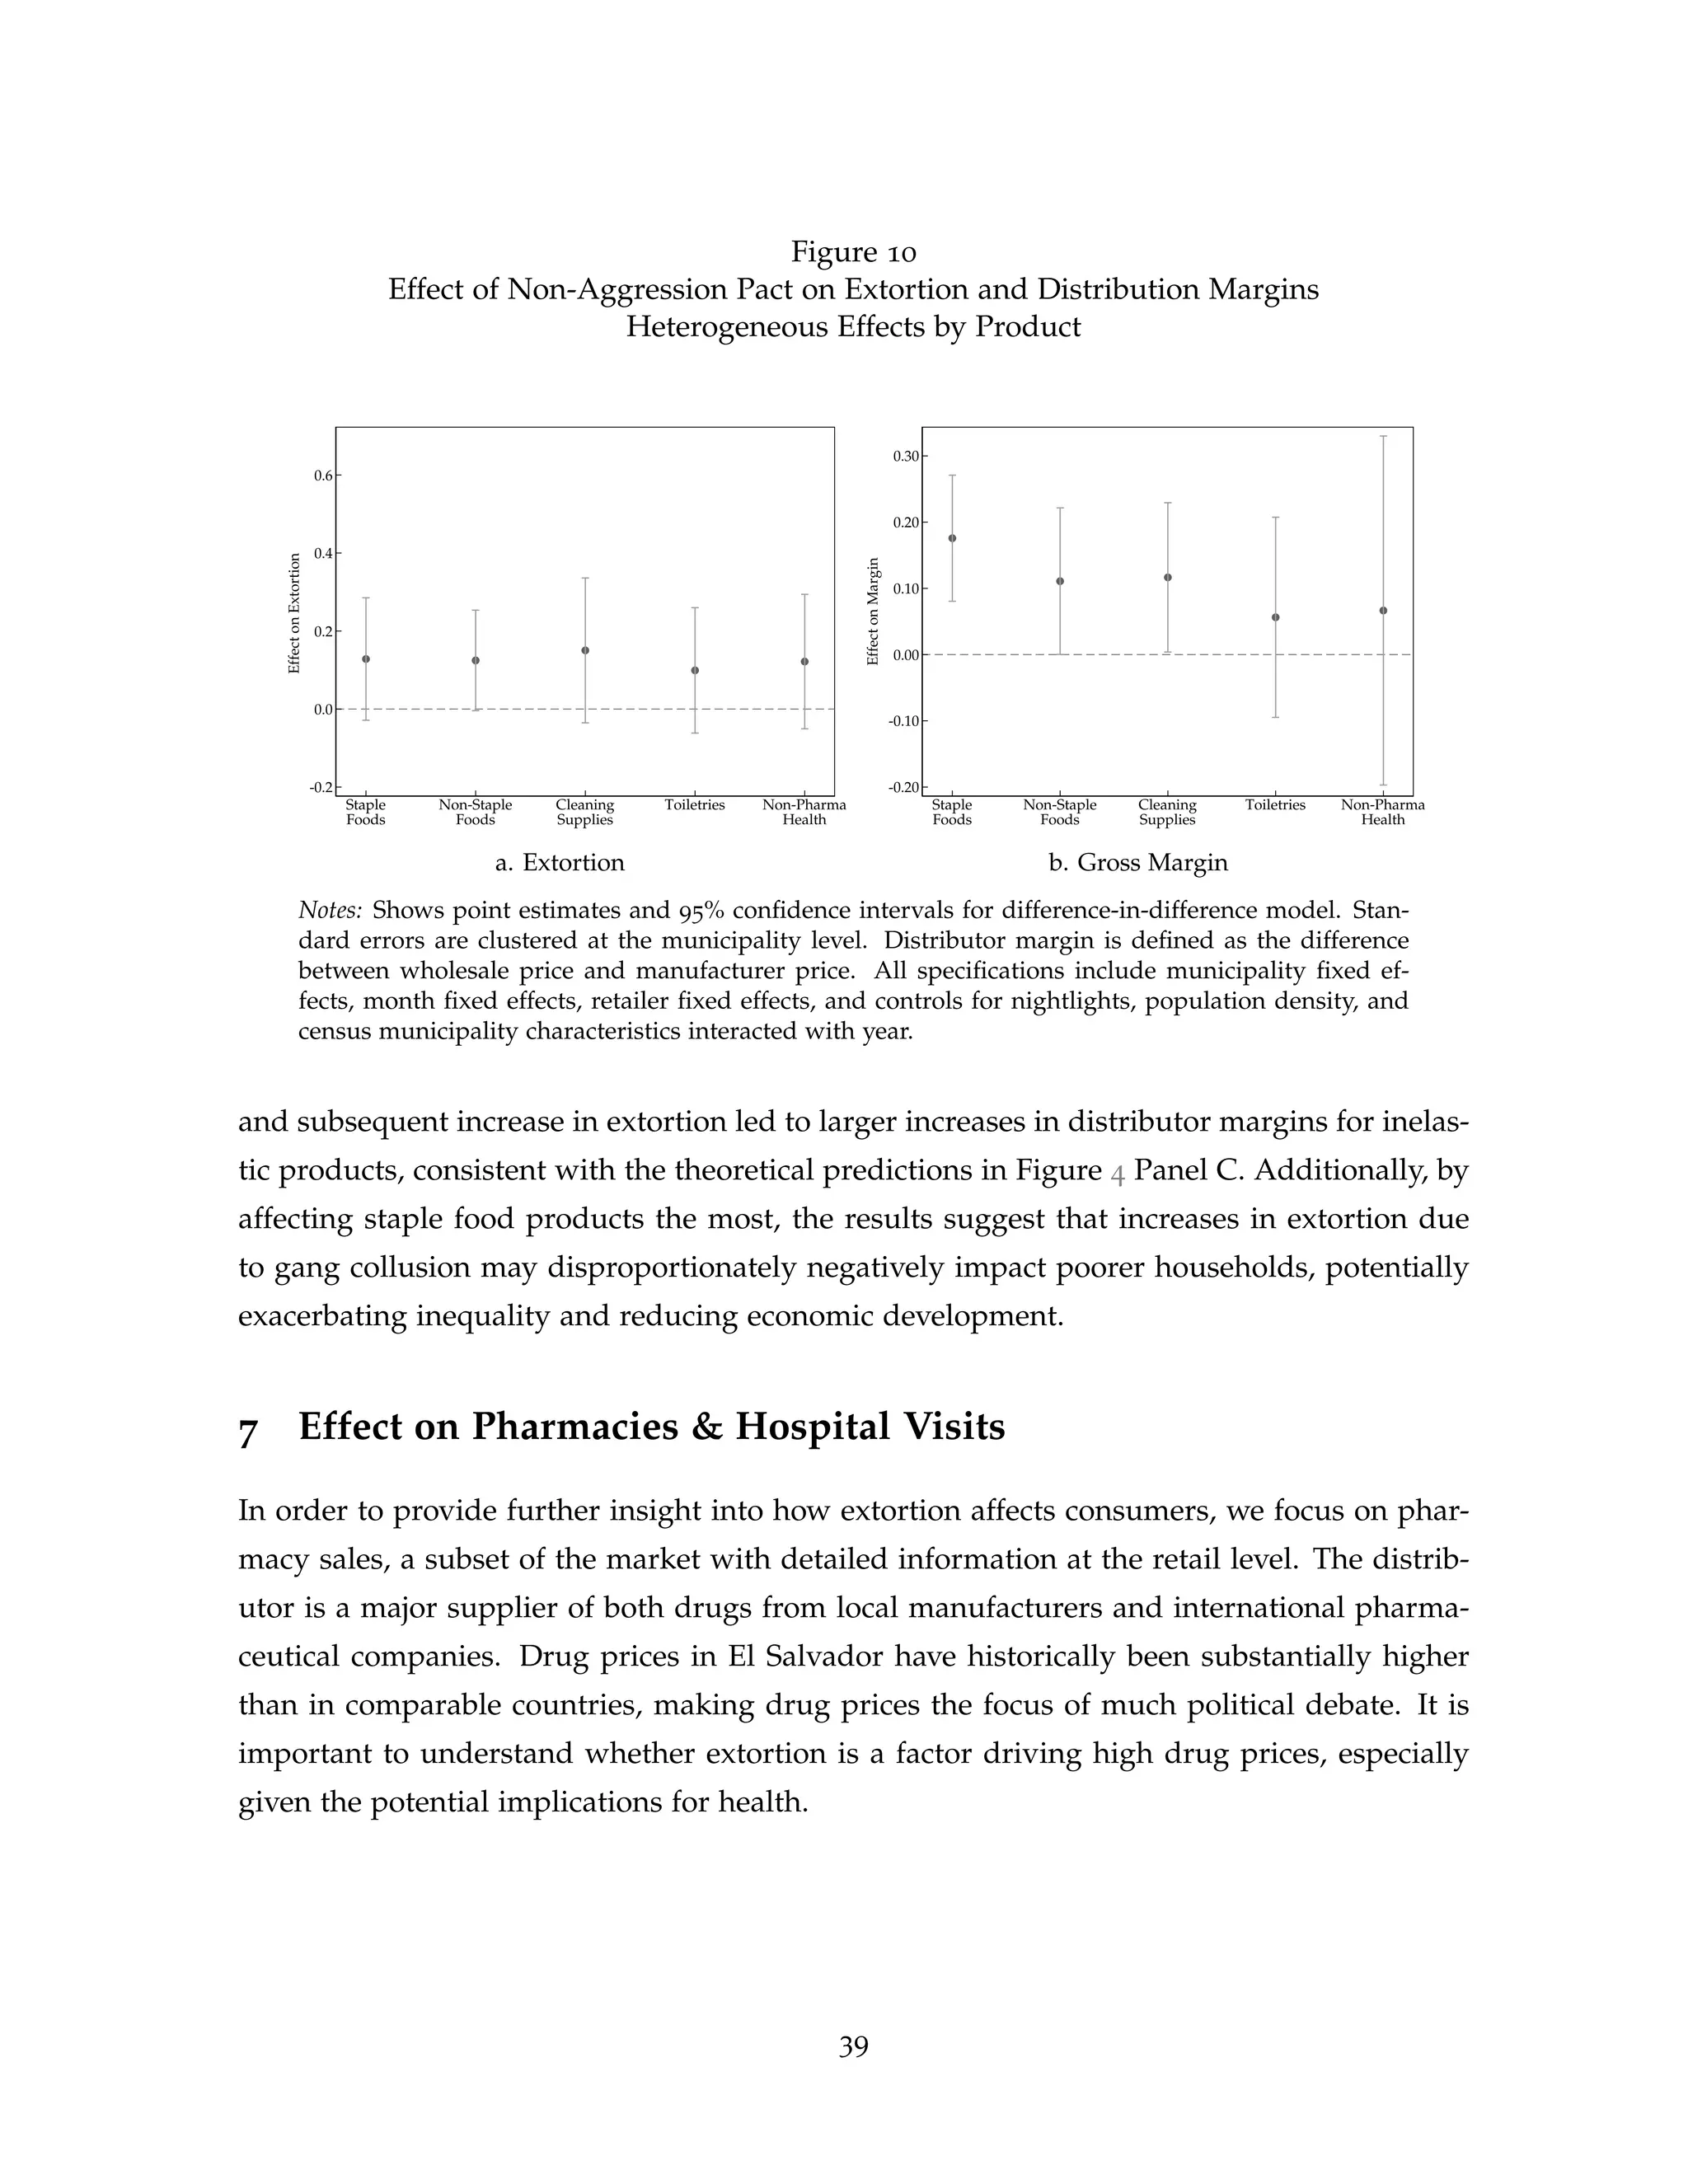
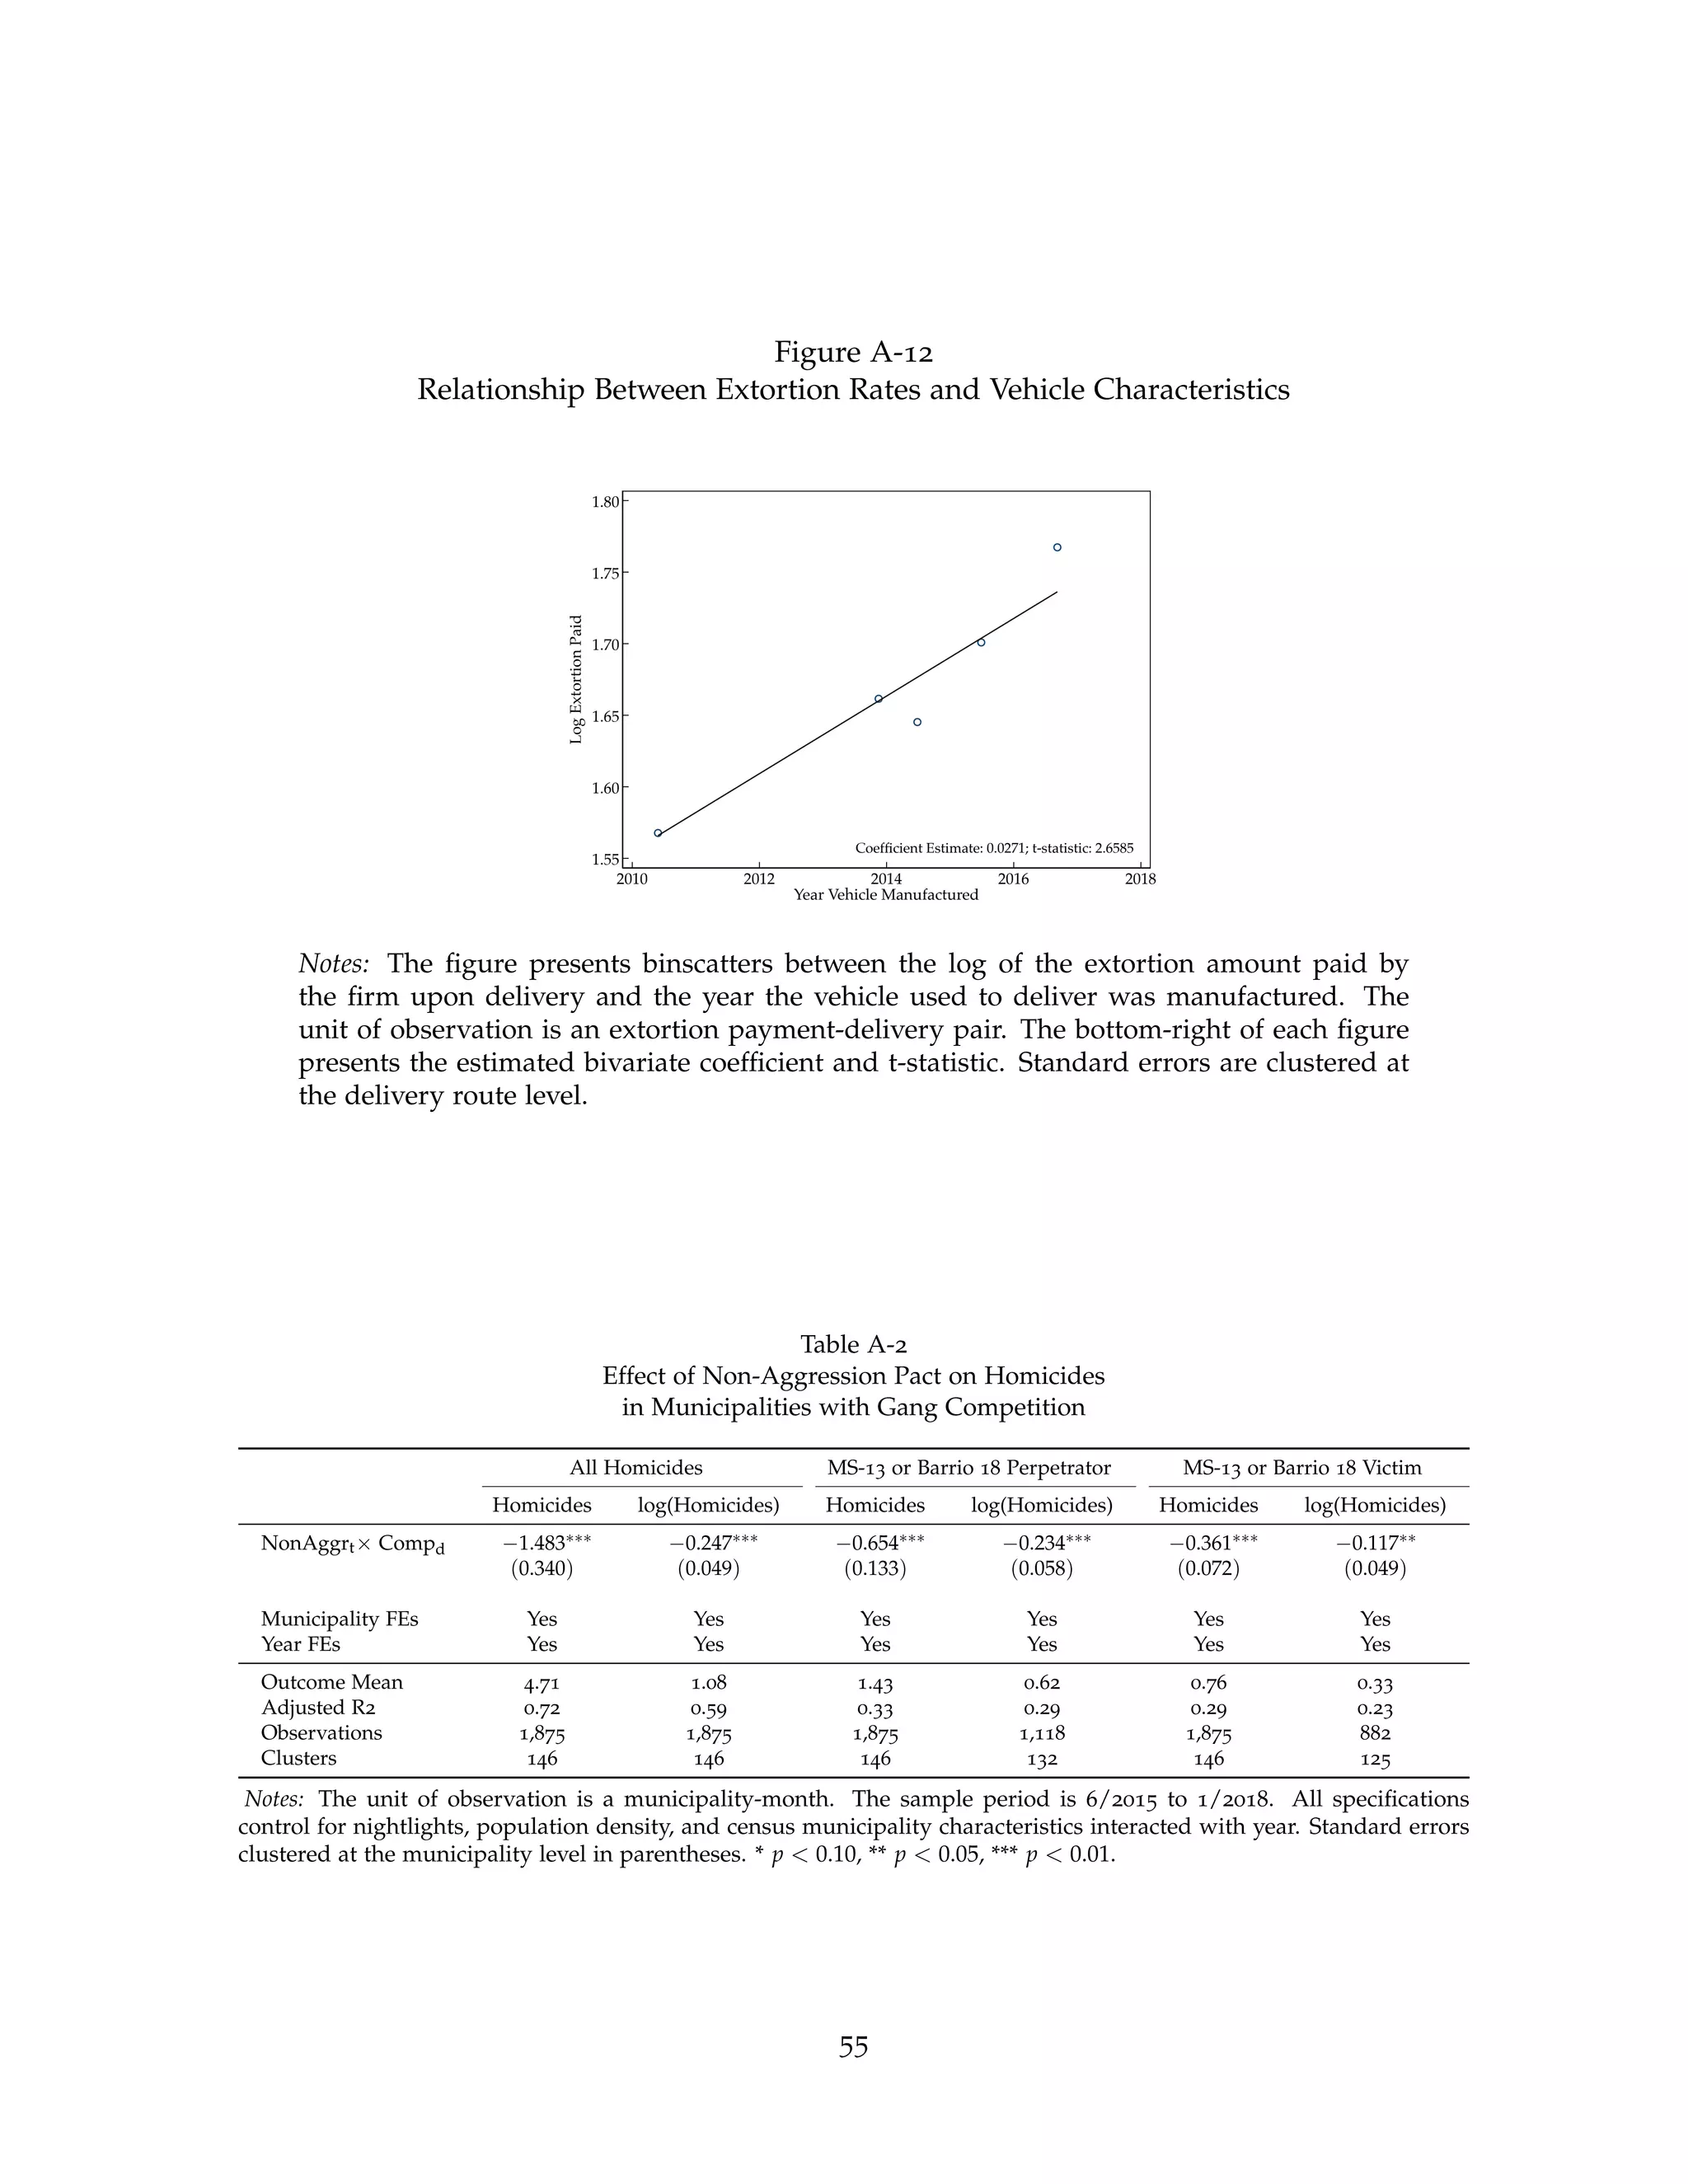

This document investigates the dynamics of extortion payments made to gangs in El Salvador, revealing that collusion among gangs through a non-aggression pact in 2016 increased extortion rates by 15% to 20%, despite a decline in violence. The economic implications include higher prices for pharmaceuticals and increased hospital visits for chronic illnesses, suggesting that reduced competition can adversely affect consumers. Using extensive data on over 50,000 extortion payments and retail sales, the study sheds light on how gang competition and collusion shape extortion practices and their impact on public health and welfare.


