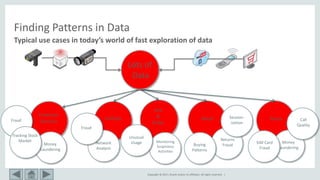
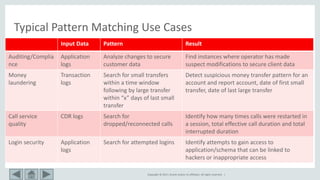
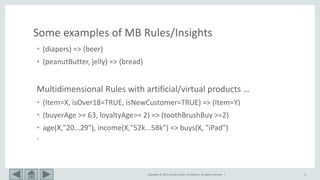
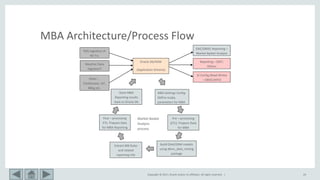
This document provides an overview of market basket analysis and pattern matching. It discusses typical use cases for pattern matching in various industries. It then covers the basics of traditional market basket analysis (MBA) including common metrics like support, confidence and lift. The document proposes ways to revisit MBA, including augmenting transaction data with tags and analyzing rules using additional metrics and sequential patterns. It outlines considerations for the design of an MBA system and the typical architecture/process flow.


![Copyright © 2017, Oracle and/or its affiliates. All rights reserved. | 9
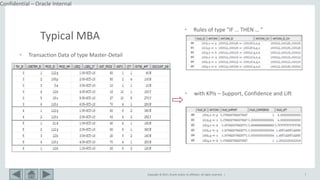
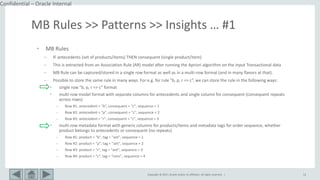
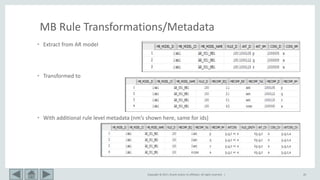
Typical MBA
• MB Rule: A => B [ s, c ]
– Support: denotes the frequency of the rule within transactions. A high value means
that the rule involves a great part of database.
support(A => B [ s, c ]) = p(A U B)
– Confidence: denotes the percentage of transactions containing A which also contain B.
It is an estimation of conditioned probability .
confidence(A => B [ s, c ]) = p(B|A) = sup(A,B)/sup(A)
– Lift: a measure of how much better a rule is at predicting the result than just assuming
the result in the first place.
lift(A => B [ s, c ]) = p(B|A)/p(B) = sup(A,B)/sup(A).sup(B)](https://image.slidesharecdn.com/mbarevisitedsqlpmv2-190529144236/85/Market-Basket-Analysis-Revisited-using-SQL-Pattern-Matching-9-320.jpg)
![Copyright © 2017, Oracle and/or its affiliates. All rights reserved. | 10
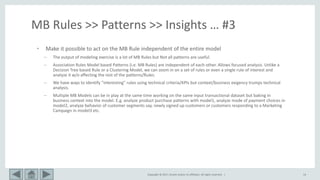
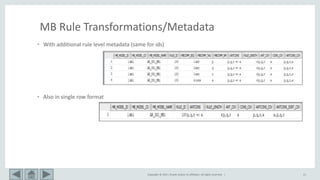
Typical MBA
• MB Rule: A => B [ s, c ]
– Conviction: measure of the number of times the rule would be incorrect if the association
between A and B was purely random chance. Conviction is a measure of the implication and has
value 1 if items are unrelated. Sensitive to the directionality of the rule (unlike lift)
conviction(A => B [ s, c ]) = sup(A).sup( B’)/sup(A,B’)
– Leverage or Piatetsky‐Shapiro: is the proportion of additional elements covered by both A and B
above the expected if independent.
leverage(A => B [ s, c ]) = sup(A,B) - sup(A). sup(B)
– Max Confidence: KPI max_conf is the maximum confidence of the two association rules related
to A and B, namely, “p(A|B)” and “p(B|A)”.
max_conf(A => B [ s, c ]) = max(p(B|A), p(A|B))](https://image.slidesharecdn.com/mbarevisitedsqlpmv2-190529144236/85/Market-Basket-Analysis-Revisited-using-SQL-Pattern-Matching-10-320.jpg)
![Copyright © 2017, Oracle and/or its affiliates. All rights reserved. | 11
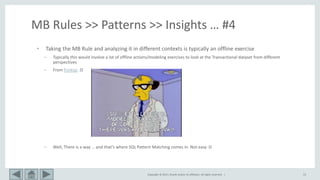
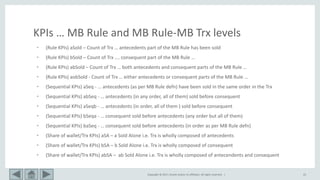
Typical MBA
• MB Rule: A => B [ s, c ]
– All Confidence: Null invariant KPI all_conf is also the minimum confidence of the two association
rules related to A and B, namely, “p(A|B)” and “p(B|A)”.
all_conf(A => B [ s, c ]) = min(p(B|A), p(A|B))
– Cosine: Null invariant KPI cosine measure can be viewed as a harmonized lift measure: The two
formulae are similar except that for cosine, the square root is taken on the product of the
probabilities of A and B.
cosine(A => B [ s, c ]) = sqrt(p(B|A).p(A|B))
– Kulc (Kulczynski) : Null invariant KPI Kulczynski measure with a preference for skewed patterns.
Range: [0; 1].
kulc(A => B [ s, c ]) = (P(A/B) + P(B/A)) / 2 = support(A,B)/2 * (1/support(A) + 1/support(B))
– IR (Imbalance Ratio): Null invariant KPI IR measures the degree of imbalance between two
events that A and B are contained in a transaction. The ratio is close to 0 if the conditional
probabilities are similar (i.e., very balanced) and close to 1 if they are very different. Range: [0; 1]
(0 indicates a balanced rule).
IR(A => B [ s, c ]) = |sup(A) - sup(B)| / (sup(A) + sup(B) - sup(A,B) )](https://image.slidesharecdn.com/mbarevisitedsqlpmv2-190529144236/85/Market-Basket-Analysis-Revisited-using-SQL-Pattern-Matching-11-320.jpg)


![[DSC Europe 25] Paula Garcia Esteban -Building the Future: The Role of Data S...](https://cdn.slidesharecdn.com/ss_thumbnails/9ld1r1bsqpwve8qfvphy-paula-garcia-esteban-building-the-future-260122103838-4171f5cb-thumbnail.jpg?width=640&height=640&fit=bounds)


![[DSC Europe 25] Gordana Milutinovic Dumbelovic - From Insight to Oversight: A...](https://cdn.slidesharecdn.com/ss_thumbnails/t7dkjsfxqwwzceropjv4-gordana-milutinovicdumbelovic-from-insight-to-oversight-ai-driven-power-bi-moni-260119121559-9e0bf11b-thumbnail.jpg?width=640&height=640&fit=bounds)

![[DSC Europe 25] Srdj Stanisic - Local and Private AI in UX.pdf](https://cdn.slidesharecdn.com/ss_thumbnails/vwmetykqmztgmokmmkfa-3-srdjan-stanisic-local-and-small-ai-in-ux-260120105855-55a31869-thumbnail.jpg?width=640&height=640&fit=bounds)
![[DSC Europe 25] Josip Saban - Career building for data professionals.pptx](https://cdn.slidesharecdn.com/ss_thumbnails/zroflcttkm1vmli0txea-josip-saban-career-building-for-data-professionals-260123083019-587cdb8c-thumbnail.jpg?width=640&height=640&fit=bounds)


![[DSC Europe 25] Tamas Srancsik - How To Teach Your AI Football? An Argument f...](https://cdn.slidesharecdn.com/ss_thumbnails/bcjh1m9xtbosv20ucftb-tamas-srancsik-how-to-teach-your-ai-football-260121115910-08b53e9e-thumbnail.jpg?width=640&height=640&fit=bounds)
![[DSC Europe 25] Marcos Heidemann - Beyond the Hype: Making AI Coding Assistan...](https://cdn.slidesharecdn.com/ss_thumbnails/eexkhvldrjsopspdjbur-marcos-heidemann-beyond-the-hype-getting-real-value-out-of-ai-assisted-coding-260121115910-7e9d41ec-thumbnail.jpg?width=640&height=640&fit=bounds)
![[DSC Europe 25] Tali Fulman - Guild Meetings, Then What? Building Data Commun...](https://cdn.slidesharecdn.com/ss_thumbnails/fgohhi33rwmhqdowdj5k-tali-fulman-guild-meetings-then-what-building-data-communities-that-actually-ch-260120105855-528492c3-thumbnail.jpg?width=640&height=640&fit=bounds)


![[DSC Europe 25] Harshvardhan Jain - From Pre-Trained to Purpose-Built: Fine-T...](https://cdn.slidesharecdn.com/ss_thumbnails/zru4zmiseku5tgvu2dgw-harshvardhan-jain-from-pre-trained-to-purpose-built-fine-tuning-llms-for-high-i-260119101520-8335585f-thumbnail.jpg?width=640&height=640&fit=bounds)
