Download to read offline


![Nouveauté ColumnStore
https://mariadb.com/docs/server/whats-new/mariadb-enterprise-columnstore-6/
● Agrégation de résultat de requête sur disque
○ Jeu de données de résultat supérieur à la mémoire disponible (>1TB)
● Augmentation de la précision DÉCIMALE de 18 à 38
● Compression LZ4 et Snappy
● Mise à jour des données transactionnelles à partir des données du ColumnStore
en plus de la jointure Cross Engine
UPDATE innodb_tab i
JOIN columnstore_tab c
ON i.col1 = c.col1
SET i.col2 = c.col2;
[Restricted]](https://image.slidesharecdn.com/roadshowoptimisationdeperformance-230920232341-e29de3df/85/MariaDB-Paris-Workshop-2023-Performance-Optimization-21-320.jpg)

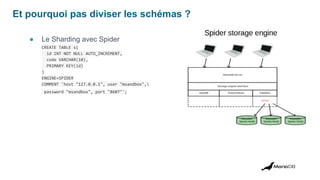
![Et pourquoi pas diviser les schémas ?
● Le Sharding avec MaxScale
[accounts_east]
type=server
address=192.168.56.102
port=3306
[accounts_west]
type=server
address=192.168.122.85
port=3306
[Sharded-Service]
type=service
router=schemarouter
servers=accounts_west,accounts_east
user=sharduser
password=YqztlYGDvZ8tVMe3GUm9XCwQi](https://image.slidesharecdn.com/roadshowoptimisationdeperformance-230920232341-e29de3df/85/MariaDB-Paris-Workshop-2023-Performance-Optimization-26-320.jpg)


MariaDB is an open-source database that is highly tunable and modular. It allows for various storage engines, plugins, and configurations to optimize performance depending on usage. Key aspects that impact performance include memory allocation, disk access, query optimization, and architecture choices like replication, sharding, or using ColumnStore for analytics. Solutions like MyRocks, Spider, MaxScale can improve performance for transactional or large scale workloads by optimizing resources, adding high availability, and distributing load.


![[db tech showcase OSS 2017] A23: Analytics with MariaDB ColumnStore by MariaD...](https://cdn.slidesharecdn.com/ss_thumbnails/mariadbcolumnstore-dbtechshowcasetokyo2017-170628024921-thumbnail.jpg?width=640&height=640&fit=bounds)
![[db tech showcase OSS 2017] A25: Replacing Oracle Database at DBS Bank by Mar...](https://cdn.slidesharecdn.com/ss_thumbnails/mariadbcolumnstore-dbtechshowcasetokyo2017-170628030047-thumbnail.jpg?width=640&height=640&fit=bounds)


![[db tech showcase Tokyo 2017] C37: MariaDB ColumnStore analytics engine : use...](https://cdn.slidesharecdn.com/ss_thumbnails/mariadbcolumnstoreusecases1-170911080447-thumbnail.jpg?width=640&height=640&fit=bounds)