Download to read offline
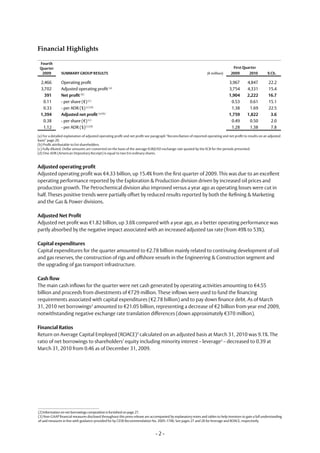
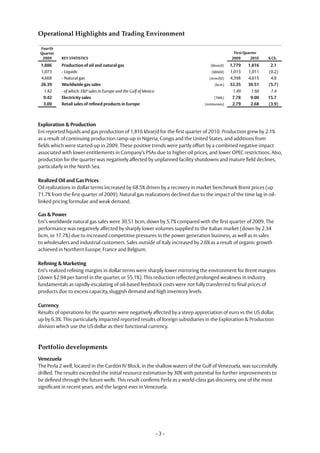
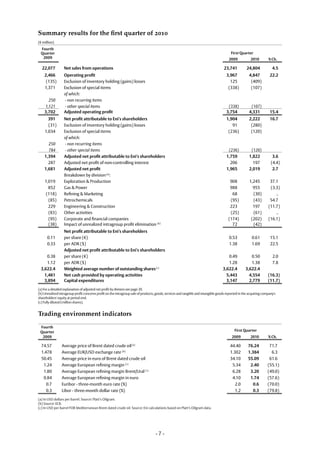
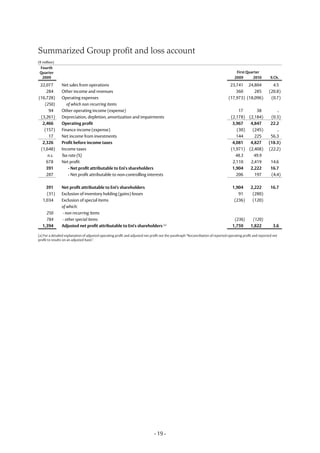
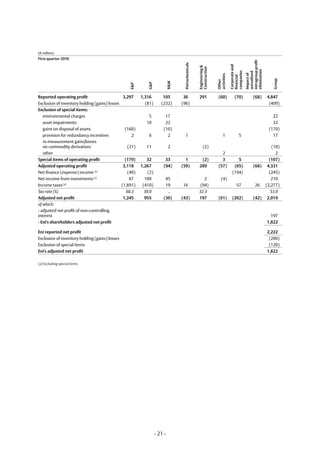
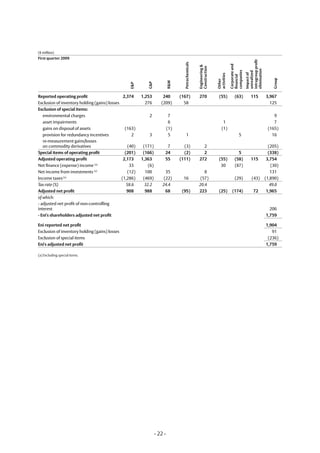
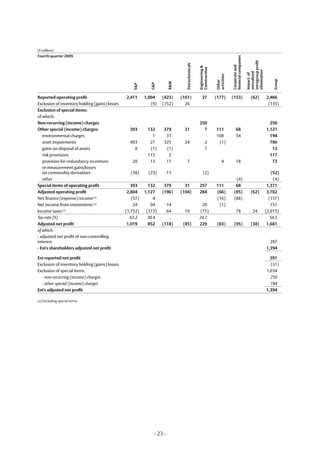
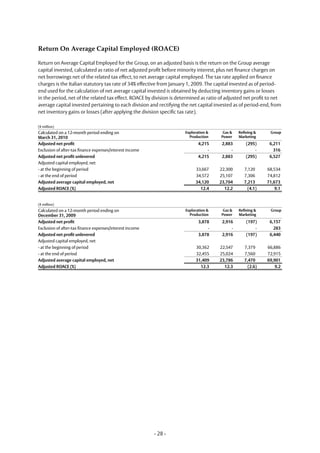
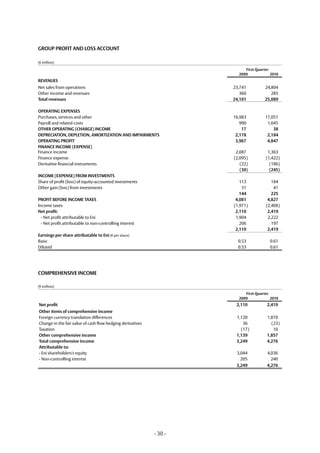
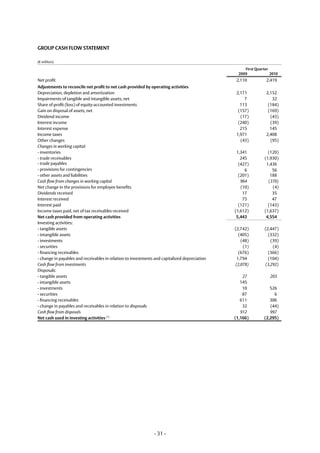
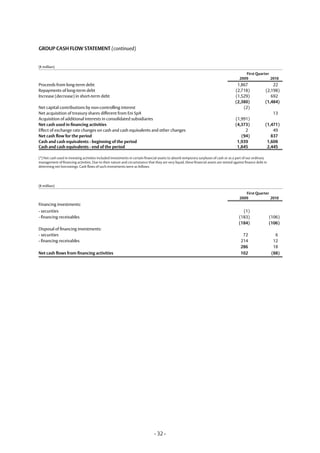
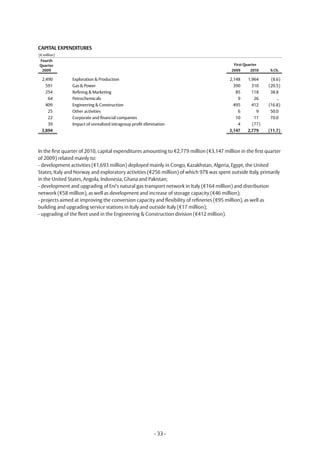
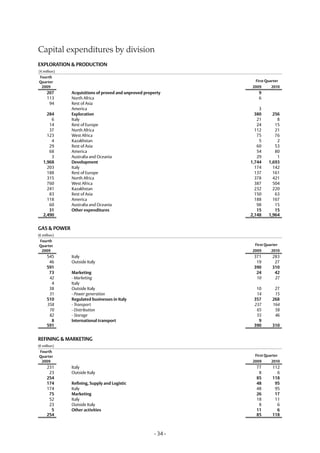
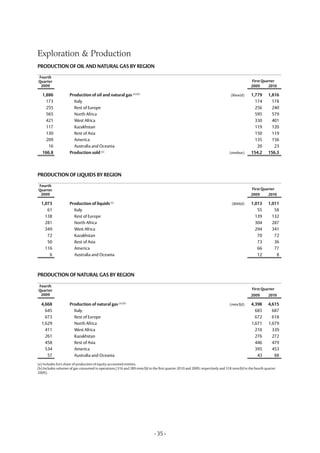

Eni announces its financial results for the first quarter of 2010. Adjusted operating profit was up 15.4% to €4.33 billion due to increased oil production and prices. Adjusted net profit increased 3.6% to €1.82 billion despite a higher tax rate. Capital expenditures for the quarter were €2.78 billion to develop oil and gas reserves. Production of oil and natural gas for the quarter increased 2.1% to 1.816 million barrels per day.


