You’ve set up your new wifi network. Next to optimize it, you want to create a positioning database (PDB)
from the collected sensory data around the whole campus or venue. Use this “how to” to collect data and test a wireless network for Alcatel-Lucent OmniAccess Stellar Location Based Service.
You’ve set up your new wifi network. Next to optimize it, you want to create a positioning database (PDB)
from the collected sensory data around the whole campus or venue. Use this “how to” to collect data and test a wireless network for Alcatel-Lucent OmniAccess Stellar Location Based Service.
Leica Geomos Features One-click Scan Area Definition and a Table ViewCurtis Woodward
Efficient and streamlined #GeoMoSNow now features One-click scan area definition and a table view of results for numeric analysis.
Advanced tables and graph data analysis with automatic and manual outlier detection and tailored table export function. One-click scan area definition provides faster and regular-shaped scan areas for use on large or long objects such as roads, facades and walls delivering simpler and quicker scanning.
By the end of the lesson students should be able to:
-explain how height is shown on maps
-recognise slope types
-some will identify landscape features from looking at contours
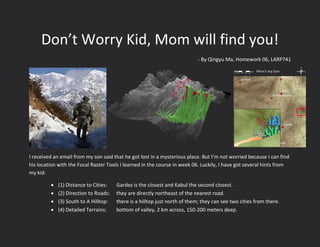
1. Don’t Worry Kid, Mom will find you!
- By Qingyu Ma, Homework 06, LARP741
I received an email from my son said that he got lost in a mysterious place. But I’m not worried because I can find
his location with the Focal Raster Tools I learned in the course in week 06. Luckily, I have got several hints from
my kid:
(1) Distance to Cities: Gardez is the closest and Kabul the second closest.
(2) Direction to Roads: they are directly northeast of the nearest road.
(3) South to A Hilltop: there is a hilltop just north of them; they can see two cities from there.
(4) Detailed Terrains: bottom of valley, 2 km across, 150-200 meters deep.
0 10 20 30 405
Miles
2. Strategy & Tools
Euclidean
Allocation
Euclidean
Direction
Reclassify
(2) Direction to Roads
Focal Statistics
(Mean)
Observer
Points
Euclidean
Direction
Focal Statistics
(range) to get valleys
have 150-200 depth.
Then find the place
containing 10*10
rectangular. (2km
cross)
Raster Calculator
(Smooth 1
-
Smoother 2
>0)
Cities
Cities (without
Gardez)
Roads
Closest
Fragment
2nd
Closest
Fragment
Nearest Roads
Directions
Northeast to
Nearest Roads
(1) Distance to
Cities
Elevation
Smooth 1
Smoother 2
s
Rough
Location
Visible Areas
North to The
Rough
Hills Potential
(3) South to a
Hilltop
Elevation Valley Zone (4) Detailed
Terrains
Raster Calculator
(Smooth 1 –
Smoother 2 < 0)
Hilltop’s South
Direction
Rough
Detailed
3. All Cities
Hint 1 Distance to Cities
Cities Without
Gardez
Run Euclidean
Allocation to
divide the map
into different
regions. Every
cell in a certain
region takes the
city in that
region as
nearest city.
Gardez
Kabul
If a cell is in the green
region, which means its
closest city is Gardez.
But if Gardez is not
there, the cells in the
red region regards Kabul
as their nearest city.
Raster
Calculator
The cells in the blue
region are first nearest to
Gardez City and second
closest to Kabul City.
4. Hint 2 Direction to Roads
Run Euclidean Direction
to get all the directions of
nearest roads.
Hint 1 Result
This is the rough
evaluation where my son
may be located.
5. Hint 3 South to a hilltop
Focal Statistics
(Mean) x 2
Focal Statistics
(Mean)
Topo-elevation
Smoother Elevation
Smooth Elevation
=
Convex and Concave
All Cities Visible areas at
least can be seen by
one city.
Observer Points
Reclassify
Areas in which people can see two
cities at night.
Raster
Calculator
and select
value > 15
as hilltops
Hilltops
6. Hint 3 South to a hilltop
Region Group
Visible hill areas
that are north to
possible areas.
Visible hilltops that
fit the hint 3.
This is a 3D view in ArcScene. From
this picture, we can see the general
terrains nearby our rough location.
As I assumed and concluded in
previous steps, my son locates in one
of the cells in the green region and
the red region contains one of the
hilltops he mentioned in the hints.
7. Hint 4 Detailed Terrains
Convex and Concave
Raster
Calculator
and select
value < 0
as Valleys
Raster
Calculator
Valley Zones *
Elevation,
we can have
valley zones
with real
elevations.
Valley Zones Valleys to be displayed
The 3D picture shows the results with
valleys. It seems that there’s a orange
region that happens to be a valley passing
through our green studying area and
happens to locate south to the hilltops on
which we can see lights from two different
cities at night.
Region Group
Valley Group
Focal Statisticals
(range)
Use 5*5 cells (2km = 10 cells) circle to
calculate cells’ ranges with neighborhood.
Reclassify
and get
ranges from
150 to 200
8. Final Result
Study Area
Hilltops
Valley 150-200 deep
The white parts are the
valley areas with a depth
from 150 to 200. From
the map we can see they
are just south to the
hilltop.
Valley Group
4
60
64
67
70
77
83
85
93
96
97
103
From the left map
we can see that the
white area belongs
to a big valley. And
that valley is
exactly the
suspected valley in
the Hint 4.
My Son!
0 10 20 30 405
Miles
Finally, I succeed to find my son’s yesterday’s location. And
fortunately I even find the valley (The orange part on the map) my
son indicated.