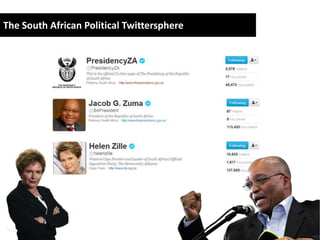
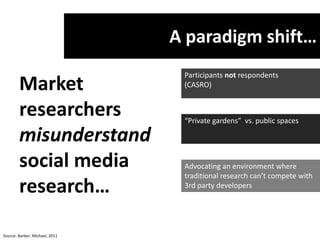
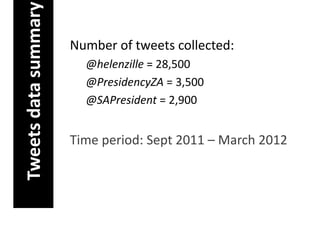
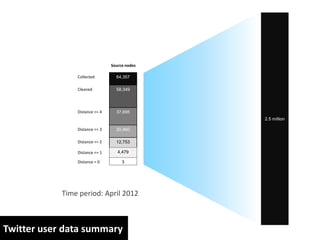
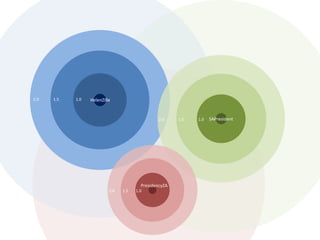
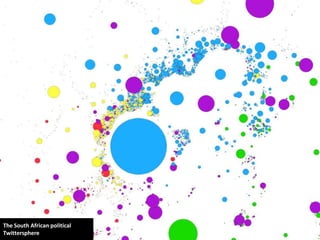
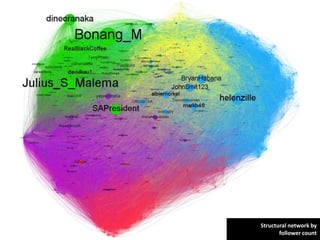
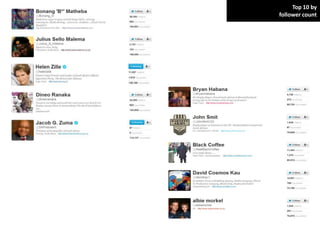
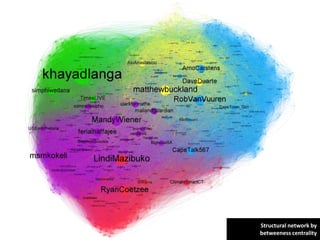
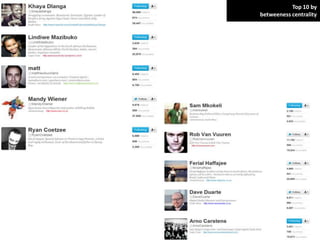
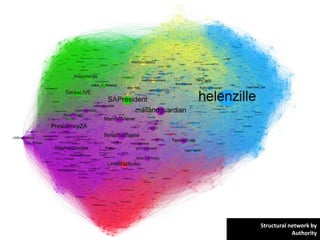
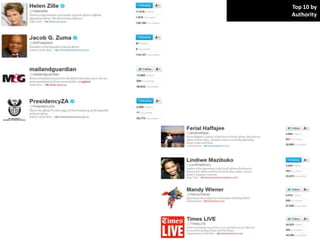
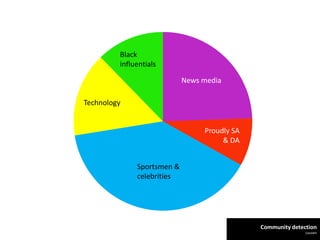
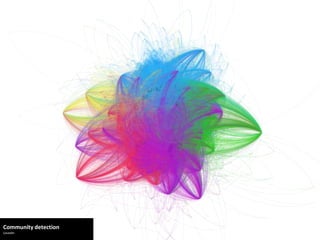
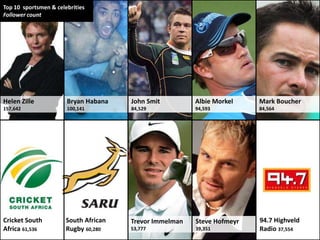
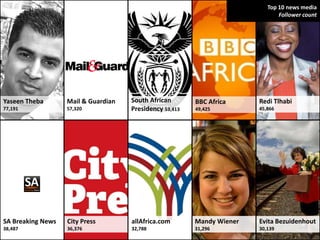
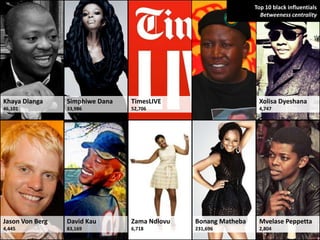
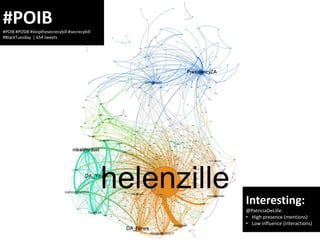
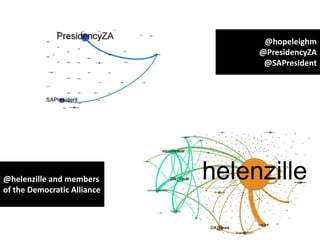
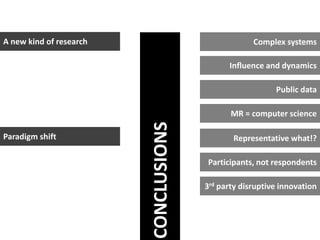
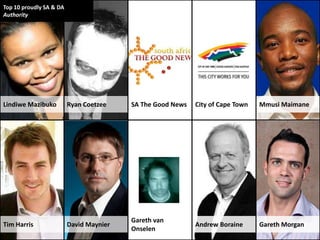
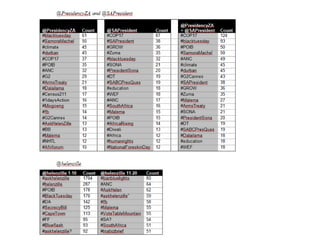
This deck briefly outlines the work we did mapping the South African Twittersphere for the 2012 SAMRA conference, including some analyses we did based on the structure of the network. Specifically, we identified people with the potential for influence based on their betweeness centrality and Authority (HITS). In addition, we also used a modularity algorithm to identify 5 clearly distinct communities within the graph. The results are for interest-sake only and should be interpreted within the limitations of the data."
A deck presented at the MRS 'Maximising the Value of Big Data' conference in London, January 2013.
Presents my view of big data and the potential it gives us for mapping the systems that we deal with on a day-to-day basis. Big data holds the promise of providing us with a meta-view of the systems that we all think we are so familiar with. I think we will find that the woods look nothing like the trees.
Using network science to understand elections: the South African 2014 nationa...Socialphysicist
This presentation describes our research into the roughly one million tweets that we collected in the run-up to the 2014 national elections in South Africa. It uses a mixture of network theory and data science to unpack the main communities and topics of conversation. The paper won the Gold Award for Best Paper at the 2015 SAMRA conference.
International Customer Experience World PresentationChantel Botha
Design tips for brands who want to be loved in social media
In this mobilized, socialized world it becomes more and more important for brands to understand the consumer’s always changing expectations. I now expect my grocer to tweet back in 10 minutes because my bank does it and I expect my favourite neighbourhood coffee shop to give me discounts when I check in on Foursquare because Starbucks does it.
The experience designer is faced with challenges that the always on-net and social consumer creates through their reasonable and sometimes unreasonable expectations. Word of mouth has turned into word of the ever mighty thumb and in his mobile world, all I have to do is tweet a brand about how angry they make me and instantly I can influence the purchasing behaviour or my and their followers.
This presentation will share insights of how to design experiences for the traditional and now social channels with the aim to be transparent, consistent, authentic and true to the brand’s essence.
A network based model for predicting a hashtag break out in twitter Sultan Alzahrani
Online information propagates differently on the web, some
of which can be viral. In this paper, first we introduce a simple standard deviation sigma levels based Tweet volume breakout definition, then we proceed to determine patterns of re-tweet network measures to predict whether a hashtag volume will breakout or not. We also developed a visualization tool to help trace the evolution of hashtag volumes, their underlying networks and both local and global network measures. We trained a random forest tree classifier to identify effective network measures for predicting hashtag volume breakouts. Our experiments showed that “local” network features, based on a fixed-sized sliding window, have an overall predictive accuracy of 76 %, where as, when we incorporate “global” features that utilize all interactions up to the current period, then the overall predictive accuracy of a sliding window based breakout predictor jumps to 83 %.
Network centrality measures and their effectivenessemapesce
Often centrality measures are used in social network analysis. The goal of this presentation is to explain how different centrality works and how they can be compared.
Centrality measures covered: degree, closeness, harmonic, Lin's index, betweenness, eigenvector, seeley's index, pagerank, hits, SALSA
Social Network Analysis: applications for education researchChristian Bokhove
What is your talk about?
This seminar will illustrate various social network analysis (SNA) techniques and measures and their applications to research problems in education. These applications will be illustrated from our own research utilising a range of SNA techniques.
What are the key messages of your talk?
We will cover some of the ways in which network data can be collected and utilised with other research data to examine the relationships between network measures and other attributes of individuals and organisations, and how it can be linked to other approaches in multiple methods studies.
What are the implications for practice or research from your talk?
SNA is an approach that draws from theories of social capital to study the relational ties that exist between actors or institutions in a specific context. Such ties might include learning exchanges or advice-seeking interactions. SNA techniques allow researchers to incorporate the interdependence of participants within their research questions, whereas many traditional techniques assume our participants, and their responses to our questions, are independent of one another.
Social Media as a Relationship Management ToolMaureen Kuether
This presentation will define the public relations theory of relationship management and identify how it can be utilized through social media by examining social analytics applications. Moving away from traditional measurements focused on quantity, organizations should measure their success based on the quality of the relationship between an organization and its publics and can do so using social analytics.
Unlocking the True Value of Social Media Holly Ross
Everywhere you turn there are tons of great stories about organizations doing wonderful things online to build communities and engage their supporters through Social Media. But what is it all for? We’ve all heard the sayings “If you build it, it will come”, “the value of Social CRM”, other concepts around understanding what is the value of Social Media. In this session, we’ll explore the notion that the real value of Social Media is not only in the experience of the community itself, but also in having a greater understanding of how your supporters are engaging with your online communities. This information can be invaluable to both marketers and fundraisers as they attempt to communicate to these engaged members of their community.
Presentation by Neville Hobson and Shel Holtz at Ragan Communications Social Media/Public Relations conference at ING House in Amsterdam, The Netherlands, on April 12, 2012.
24 settembre 2015, Centro Svizzero. Dodicesimo appuntamento di Exhibitionist, ciclo di incontri tra innovatori di fiere ed eventi. Protagonista Simon Burton, Agent provocateur in PR, events, social media and entrepreneurship.
My presentation to the SBTDC training group on the basics of social media including basic goal setting, understanding some of the basic tools including Twitter, Facebook, Foursquare, Google+, and analytics.
Presentation to Conservation Communications Forum in NairobiSochin Limited
We spoke at the inaugural Conservation Communications Forum which investigated the communication strategy that conservancies ought to undertake to better connect with audiences and push a refreshed conservation narrative.
Australian Political Parties and social media: uses and attitudesStephen Dann
Australian Political Parties and social media talks about how the Twitter accounts of political candidates from the W.A. senate re-election fared under analysis from the Twitter Content Classification framework (Plus a brief overview of Day 1 of the #cmpm2014 conference)
An introduction to the value of social media in the world of aquatics programming. This presentation and information will be useful for people starting in social media for work - the information is high level and provides a start for further exploration.
This deck summarises some of our research into the "shape" of conversation maps (i.e. interaction networks) on Twitter. We find that the shape, or pattern, of brand and campaign conversations tend to sit on a continuum from centralisation to decentralisation. The shapes often evolve along this continuum as brands adopt more organic, two-way conversation patterns rather than the one-directional broadcasting techniques so common in traditional channels such as television and radio.
This presentation is based on a paper that won the Best Methodological Paper award at the 2015 ESOMAR Congress conference. You can access the paper here: https://www.esomar.org/web/research_papers/Innovation_2714_The-Shape-of-Conversations.php
This presentation looks at how gamification taps into how our brains work. It focus on the role of reward schedules and uncertainty in creating engagement. It also briefly discusses whether or not the term 'gamification' itself is a fad or not.
NOTE: Apologies for the low image quality of the slides. The only way I was able to upload the deck without producing visual artifacts during the SlideShare conversion process was to upload each slide as an image :(
Beneath the Surface: The Hidden World of Individual Buying DynamicsSocialphysicist
This deck describes how people actually buy brands based on an analysis of several million purchase events over a period of 5 years across three different categories in the United Kingdom.
It was presented at the ESOMAR Congress 2012 conference in Atlanta, USA in September 2012.
I'm particularly proud of the illustrations in the presentation... although the fundamental nature of the research is pretty cool too :)
We presented this deck at the ESOMAR Congress 2011 conference in Amsterdam where it was nominated for "Best Methodological Paper".
The meat of this deck is a collection of case studies showing the efficacy of gamification in various BUSINESS contexts. It took us ages to contact and collate these various examples, so hopefully having them all in one place will save you time.
A big thank you very much to the various folks who helped us put this piece of research together!
If you have any questions, comments, requests, or are interested in the original paper that this deck is based on, please feel free to drop us a line :)
This presentation reviews how attention works in our brains. It answers questions like:
1) How do we process our environment?
2) What is the path that stimuli go through?
3) What are the factors that capture our attention?
4) What about stimuli that we don’t consciously process?
5) And more...
This is my second presentation from the SAMRA 2011 conference. The first presentation on "gamification" can be found here: http://www.slideshare.net/ervler/gamification-future-or-fail
This deck is based on a paper we wrote for the SAMRA 2011 conference. It's a short introduction to some of the ideas underlying the concept of "gamification".
It also details the results from a simple experiment we conducted to measure the effectiveness of gamifying an online community. We were restricted by a tight deadline and the existing capabilities of the online platform we partnered with, but the results are still pretty clear (although small base sizes makes it difficult to draw solid conclusions). To follow up these tantalising results, we are writing another paper for ESOMAR Congress that collects more numbers describing the effectivness of gamification.
I had a lot of fun illustrating the deck. Hope you enjoy reading it.
Negative Publicity: How People Process It and How Brands Should Respond to It...Socialphysicist
This deck presents case studies and a review of the cognitive theories behind how people process negative information about a brand, and suggests factors that a brand should consider before responding to a scandal.
PLEASE NOTE:
1. See speaker notes for more info on each slide
2. Drop me an e-mail if you would like a copy (e-mail address on front slide).
3. Link to full paper - it's behind a paywall unfortunately :(
http://www.esomar.org/web/publication/paper.php?id=2171
This presentation outlines how market share forms from a network perspective.
It is based on an oldish paper I wrote for the 2009 Southern African Marketing Research Association (SAMRA) Conference. It subsequently won the WPP Atticus "Research in Practice" award.
Please drop me an e-mail if you have any questions, comments or would like a copy of the deck.
Note that the SlideShare conversion process has corrupted some of the slides (e.g. slides 20, 26)
Branding in the nth Dimension (Systems Theory in Branded Markets)Socialphysicist
The purpose of this presentation was to introduce market researchers to nonlinear systems theory in the context of branded markets by helping them to visualise the systems they work in every day.
NOTE: Read the notes along with each slide to get the maximum out of this deck.
NOTE: SlideShare screwed up some of the formatting on certain slides (word bubbles, font size, squashed images, etc.). Bad SlideShare :(
An introduction to power law distributions, with a focus on branded markets.
Somewhat text-heavy by today's standards, but presentation was created in late 2007.
Pushing the limits of ePRTC: 100ns holdover for 100 daysAdtran
At WSTS 2024, Alon Stern explored the topic of parametric holdover and explained how recent research findings can be implemented in real-world PNT networks to achieve 100 nanoseconds of accuracy for up to 100 days.
GraphSummit Singapore | The Future of Agility: Supercharging Digital Transfor...Neo4j
Leonard Jayamohan, Partner & Generative AI Lead, Deloitte
This keynote will reveal how Deloitte leverages Neo4j’s graph power for groundbreaking digital twin solutions, achieving a staggering 100x performance boost. Discover the essential role knowledge graphs play in successful generative AI implementations. Plus, get an exclusive look at an innovative Neo4j + Generative AI solution Deloitte is developing in-house.
LF Energy Webinar: Electrical Grid Modelling and Simulation Through PowSyBl -...DanBrown980551
Do you want to learn how to model and simulate an electrical network from scratch in under an hour?
Then welcome to this PowSyBl workshop, hosted by Rte, the French Transmission System Operator (TSO)!
During the webinar, you will discover the PowSyBl ecosystem as well as handle and study an electrical network through an interactive Python notebook.
PowSyBl is an open source project hosted by LF Energy, which offers a comprehensive set of features for electrical grid modelling and simulation. Among other advanced features, PowSyBl provides:
- A fully editable and extendable library for grid component modelling;
- Visualization tools to display your network;
- Grid simulation tools, such as power flows, security analyses (with or without remedial actions) and sensitivity analyses;
The framework is mostly written in Java, with a Python binding so that Python developers can access PowSyBl functionalities as well.
What you will learn during the webinar:
- For beginners: discover PowSyBl's functionalities through a quick general presentation and the notebook, without needing any expert coding skills;
- For advanced developers: master the skills to efficiently apply PowSyBl functionalities to your real-world scenarios.
Essentials of Automations: The Art of Triggers and Actions in FMESafe Software
In this second installment of our Essentials of Automations webinar series, we’ll explore the landscape of triggers and actions, guiding you through the nuances of authoring and adapting workspaces for seamless automations. Gain an understanding of the full spectrum of triggers and actions available in FME, empowering you to enhance your workspaces for efficient automation.
We’ll kick things off by showcasing the most commonly used event-based triggers, introducing you to various automation workflows like manual triggers, schedules, directory watchers, and more. Plus, see how these elements play out in real scenarios.
Whether you’re tweaking your current setup or building from the ground up, this session will arm you with the tools and insights needed to transform your FME usage into a powerhouse of productivity. Join us to discover effective strategies that simplify complex processes, enhancing your productivity and transforming your data management practices with FME. Let’s turn complexity into clarity and make your workspaces work wonders!
Alt. GDG Cloud Southlake #33: Boule & Rebala: Effective AppSec in SDLC using ...James Anderson
Effective Application Security in Software Delivery lifecycle using Deployment Firewall and DBOM
The modern software delivery process (or the CI/CD process) includes many tools, distributed teams, open-source code, and cloud platforms. Constant focus on speed to release software to market, along with the traditional slow and manual security checks has caused gaps in continuous security as an important piece in the software supply chain. Today organizations feel more susceptible to external and internal cyber threats due to the vast attack surface in their applications supply chain and the lack of end-to-end governance and risk management.
The software team must secure its software delivery process to avoid vulnerability and security breaches. This needs to be achieved with existing tool chains and without extensive rework of the delivery processes. This talk will present strategies and techniques for providing visibility into the true risk of the existing vulnerabilities, preventing the introduction of security issues in the software, resolving vulnerabilities in production environments quickly, and capturing the deployment bill of materials (DBOM).
Speakers:
Bob Boule
Robert Boule is a technology enthusiast with PASSION for technology and making things work along with a knack for helping others understand how things work. He comes with around 20 years of solution engineering experience in application security, software continuous delivery, and SaaS platforms. He is known for his dynamic presentations in CI/CD and application security integrated in software delivery lifecycle.
Gopinath Rebala
Gopinath Rebala is the CTO of OpsMx, where he has overall responsibility for the machine learning and data processing architectures for Secure Software Delivery. Gopi also has a strong connection with our customers, leading design and architecture for strategic implementations. Gopi is a frequent speaker and well-known leader in continuous delivery and integrating security into software delivery.
GDG Cloud Southlake #33: Boule & Rebala: Effective AppSec in SDLC using Deplo...James Anderson
Effective Application Security in Software Delivery lifecycle using Deployment Firewall and DBOM
The modern software delivery process (or the CI/CD process) includes many tools, distributed teams, open-source code, and cloud platforms. Constant focus on speed to release software to market, along with the traditional slow and manual security checks has caused gaps in continuous security as an important piece in the software supply chain. Today organizations feel more susceptible to external and internal cyber threats due to the vast attack surface in their applications supply chain and the lack of end-to-end governance and risk management.
The software team must secure its software delivery process to avoid vulnerability and security breaches. This needs to be achieved with existing tool chains and without extensive rework of the delivery processes. This talk will present strategies and techniques for providing visibility into the true risk of the existing vulnerabilities, preventing the introduction of security issues in the software, resolving vulnerabilities in production environments quickly, and capturing the deployment bill of materials (DBOM).
Speakers:
Bob Boule
Robert Boule is a technology enthusiast with PASSION for technology and making things work along with a knack for helping others understand how things work. He comes with around 20 years of solution engineering experience in application security, software continuous delivery, and SaaS platforms. He is known for his dynamic presentations in CI/CD and application security integrated in software delivery lifecycle.
Gopinath Rebala
Gopinath Rebala is the CTO of OpsMx, where he has overall responsibility for the machine learning and data processing architectures for Secure Software Delivery. Gopi also has a strong connection with our customers, leading design and architecture for strategic implementations. Gopi is a frequent speaker and well-known leader in continuous delivery and integrating security into software delivery.
Encryption in Microsoft 365 - ExpertsLive Netherlands 2024Albert Hoitingh
In this session I delve into the encryption technology used in Microsoft 365 and Microsoft Purview. Including the concepts of Customer Key and Double Key Encryption.
The Art of the Pitch: WordPress Relationships and SalesLaura Byrne
Clients don’t know what they don’t know. What web solutions are right for them? How does WordPress come into the picture? How do you make sure you understand scope and timeline? What do you do if sometime changes?
All these questions and more will be explored as we talk about matching clients’ needs with what your agency offers without pulling teeth or pulling your hair out. Practical tips, and strategies for successful relationship building that leads to closing the deal.
Climate Impact of Software Testing at Nordic Testing DaysKari Kakkonen
My slides at Nordic Testing Days 6.6.2024
Climate impact / sustainability of software testing discussed on the talk. ICT and testing must carry their part of global responsibility to help with the climat warming. We can minimize the carbon footprint but we can also have a carbon handprint, a positive impact on the climate. Quality characteristics can be added with sustainability, and then measured continuously. Test environments can be used less, and in smaller scale and on demand. Test techniques can be used in optimizing or minimizing number of tests. Test automation can be used to speed up testing.
Dr. Sean Tan, Head of Data Science, Changi Airport Group
Discover how Changi Airport Group (CAG) leverages graph technologies and generative AI to revolutionize their search capabilities. This session delves into the unique search needs of CAG’s diverse passengers and customers, showcasing how graph data structures enhance the accuracy and relevance of AI-generated search results, mitigating the risk of “hallucinations” and improving the overall customer journey.
Securing your Kubernetes cluster_ a step-by-step guide to success !KatiaHIMEUR1
Today, after several years of existence, an extremely active community and an ultra-dynamic ecosystem, Kubernetes has established itself as the de facto standard in container orchestration. Thanks to a wide range of managed services, it has never been so easy to set up a ready-to-use Kubernetes cluster.
However, this ease of use means that the subject of security in Kubernetes is often left for later, or even neglected. This exposes companies to significant risks.
In this talk, I'll show you step-by-step how to secure your Kubernetes cluster for greater peace of mind and reliability.
Removing Uninteresting Bytes in Software FuzzingAftab Hussain
Imagine a world where software fuzzing, the process of mutating bytes in test seeds to uncover hidden and erroneous program behaviors, becomes faster and more effective. A lot depends on the initial seeds, which can significantly dictate the trajectory of a fuzzing campaign, particularly in terms of how long it takes to uncover interesting behaviour in your code. We introduce DIAR, a technique designed to speedup fuzzing campaigns by pinpointing and eliminating those uninteresting bytes in the seeds. Picture this: instead of wasting valuable resources on meaningless mutations in large, bloated seeds, DIAR removes the unnecessary bytes, streamlining the entire process.
In this work, we equipped AFL, a popular fuzzer, with DIAR and examined two critical Linux libraries -- Libxml's xmllint, a tool for parsing xml documents, and Binutil's readelf, an essential debugging and security analysis command-line tool used to display detailed information about ELF (Executable and Linkable Format). Our preliminary results show that AFL+DIAR does not only discover new paths more quickly but also achieves higher coverage overall. This work thus showcases how starting with lean and optimized seeds can lead to faster, more comprehensive fuzzing campaigns -- and DIAR helps you find such seeds.
- These are slides of the talk given at IEEE International Conference on Software Testing Verification and Validation Workshop, ICSTW 2022.
Smart TV Buyer Insights Survey 2024 by 91mobiles.pdf91mobiles
91mobiles recently conducted a Smart TV Buyer Insights Survey in which we asked over 3,000 respondents about the TV they own, aspects they look at on a new TV, and their TV buying preferences.
PHP Frameworks: I want to break free (IPC Berlin 2024)Ralf Eggert
In this presentation, we examine the challenges and limitations of relying too heavily on PHP frameworks in web development. We discuss the history of PHP and its frameworks to understand how this dependence has evolved. The focus will be on providing concrete tips and strategies to reduce reliance on these frameworks, based on real-world examples and practical considerations. The goal is to equip developers with the skills and knowledge to create more flexible and future-proof web applications. We'll explore the importance of maintaining autonomy in a rapidly changing tech landscape and how to make informed decisions in PHP development.
This talk is aimed at encouraging a more independent approach to using PHP frameworks, moving towards a more flexible and future-proof approach to PHP development.
Epistemic Interaction - tuning interfaces to provide information for AI supportAlan Dix
Paper presented at SYNERGY workshop at AVI 2024, Genoa, Italy. 3rd June 2024
https://alandix.com/academic/papers/synergy2024-epistemic/
As machine learning integrates deeper into human-computer interactions, the concept of epistemic interaction emerges, aiming to refine these interactions to enhance system adaptability. This approach encourages minor, intentional adjustments in user behaviour to enrich the data available for system learning. This paper introduces epistemic interaction within the context of human-system communication, illustrating how deliberate interaction design can improve system understanding and adaptation. Through concrete examples, we demonstrate the potential of epistemic interaction to significantly advance human-computer interaction by leveraging intuitive human communication strategies to inform system design and functionality, offering a novel pathway for enriching user-system engagements.
3. Who are the popular Who is influencing What is the nature What sub-
and/or influential whom within a of their influence i.e. communities exist
individuals in my specific topic of how are they within my online
network?
interest to me? influencing people? community?
What topics are What are people saying What do these sub- Who is sharing
about my brand, communities believe
people talking political party, charity, and how do they relate my content
about? music, etc.? to my brand/ online?
organisation/etc?
What are the Are they saying How far is word of How is my
emerging topics mostly positive or my brand or messaging being
and trends? negative things? negative publicity shared online?
being spread?
Relevance?
5. A paradigm shift…
Participants not respondents
Market (CASRO)
researchers “Private gardens” vs. public spaces
misunderstand
social media Advocating an environment where
traditional research can’t compete with
research… 3rd party developers
Source: Barber, Michael, 2011
11. Topic modelling
Hashtags
Types of analyses
Structural network
Betweeness centrality
Authority (HITS)
Community detection
Influence networks
Image sources: Knowledge Matters. http://www.durantlaw.info/category/miscellaneous/strategy
Gutiérrez-Pérez, JA, et al. 2011. Application of graph-spectral methods in the vulnerability assessment of water supply networks
25. Top 10 sportsmen & celebrities
Follower count
Helen Zille Bryan Habana John Smit Albie Morkel Mark Boucher
157,642 100,141 84,529 94,593 84,564
Cricket South South African Trevor Immelman Steve Hofmeyr 94.7 Highveld
Africa 61,536 Rugby 60,280 53,777 39,351 Radio 37,554
26. Top 10 sportsmen & celebrities
Betweeness centrality
Rob van Vuuren Arno Carstens Cape Talk 567 Alex van Tonder Sam Wilson
16,610 11,562 11,685 10,065 6,756
Karen Zoid Lead SA Jeannie D Creative Cape The Foodie (David)
14,410 18,786 38,858 Town 6,259 5,219
27. Top 10 news media
Follower count
Yaseen Theba Mail & Guardian South African BBC Africa Redi Tlhabi
77,191 57,320 Presidency 53,413 49,425 45,866
SA Breaking News City Press allAfrica.com Mandy Wiener Evita Bezuidenhout
38,487 36,376 32,788 31,296 30,139
28. Top 10 news media
Betweeness centrality
Mandy Wiener Sam Mkokeli Ferial Haffajee Mail & Guardian Robyn Clark
31,296 3,033 29,530 57,320 1,598
Sipho Hlongwane US South African Verashni Pillay The Big Issue Stephen Grootes
9,093 Embassy 17,803 8,304 4,363 19,708
29. Top 10 technology
Follower count
Aki Anastasiou Jaco van Wyk Simon Dingle Dave Duarte Toby Shapshak
28,063 20,087 15,386 9,563 9,073
Finance24 Mxit Matthew Buckland Pieter Uys Duncan McLeod
8,184 7,651 7,033 6,654 6,194
30. Top 10 technology
Betweeness centrality
Matthew Buckland Dave Duarte Aki Anastasiou Raoul de Jongh Toby Shapshak
7,033 9,563 28,063 4,133 9,073
Saul Kropman Mike Sharman Uno de Waal Pete Flynn Cathryn Reece
2,530 4,680 2,469 1,008 2,302
31. Top 10 black influentials
Follower count
Bonang Matheba Julius Malema Dineo Ranaka Jacob Zuma Black Coffee
231,696 (unconfirmed) 192,482 142,745 136,403 97,302
David Kau Terry Pheto Pabi Moloi Claire Mawisa Kuli Roberts
83,169 64,117 66,841 54,562 57,352
32. Top 10 black influentials
Betweeness centrality
Khaya Dlanga Simphiwe Dana TimesLIVE Julius Malema Xolisa Dyeshana
46,101 33,986 52,706 (unconfirmed) 192,482 4,747
Jason Von Berg David Kau Zama Ndlovu Bonang Matheba Mvelase Peppetta
4,445 83,169 6,718 231,696 2,804
33. Top 10 proudly SA & DA
Follower count
Lindiwe Mazibuko SA The Good News Brand South Africa SouthAfrica.info City of Cape Town
30,460 12,483 8,549 8,575 7,725
Ryan Coetzee Mmusi Maimane Tim Harris DA Youth Andrew Boraine
3,528 4,917 2,792 3,239 2,214
34. Top 10 proudly SA & DA
Betweeness centrality
Lindiwe Mazibuko Ryan Coetzee Climate Smart Tim Harris Mmusi Maimane
30,460 3,528 Cape Town 867 2,792 4,917
Solly Malatsi Gareth van Mbali Ntuli Cape Town Phumzile Van
853 Onselen 2,085 1,903 Green Map 1,408 Damme 1,588
39. @hopeleighm
@PresidencyZA
@SAPresident
@helenzille and members
of the Democratic Alliance
40. A new kind of research Complex systems
Influence and dynamics
Public data
MR = computer science
CONCLUSIONS
Paradigm shift Representative what!?
Participants, not respondents
3rd party disruptive innovation
43. Top 10 sportsmen & celebrities
Authority
Helen Zille Rob van Vuuren John Smit Arno Carstens Cape Talk 567
Bryan Habana Alex van Tonder Sam Wilson Karen Zoid Vanessa Raphaely
44. Top 10 news media
Authority
South African
Mail & Guardian Ferial Haffajee Mandy Wiener Stephen Grootes
Presidency
Evita Bezuidenhout Redi Tlhabi Zapiro Max du Preez Philip de Wet
45. Top 10 technology
Authority
Aki Anastasiou Matthew Buckland Toby Shapshak Dave Duarte Simon Dingle
Duncan McLeod Memeburn Cherryflava Media Pieter Uys Mike Sharman
46. Top 10 black influentials
Authority
Julius Malema
Jacob Zuma TimesLIVE Khaya Dlanga Leanne Manas
(unconfirmed)
Riaad Moosa Zakes Mda David Kau Simphiwe Dana Pabi Moloi
47. Top 10 proudly SA & DA
Authority
Lindiwe Mazibuko Ryan Coetzee SA The Good News City of Cape Town Mmusi Maimane
Gareth van
Tim Harris David Maynier Andrew Boraine Gareth Morgan
Onselen