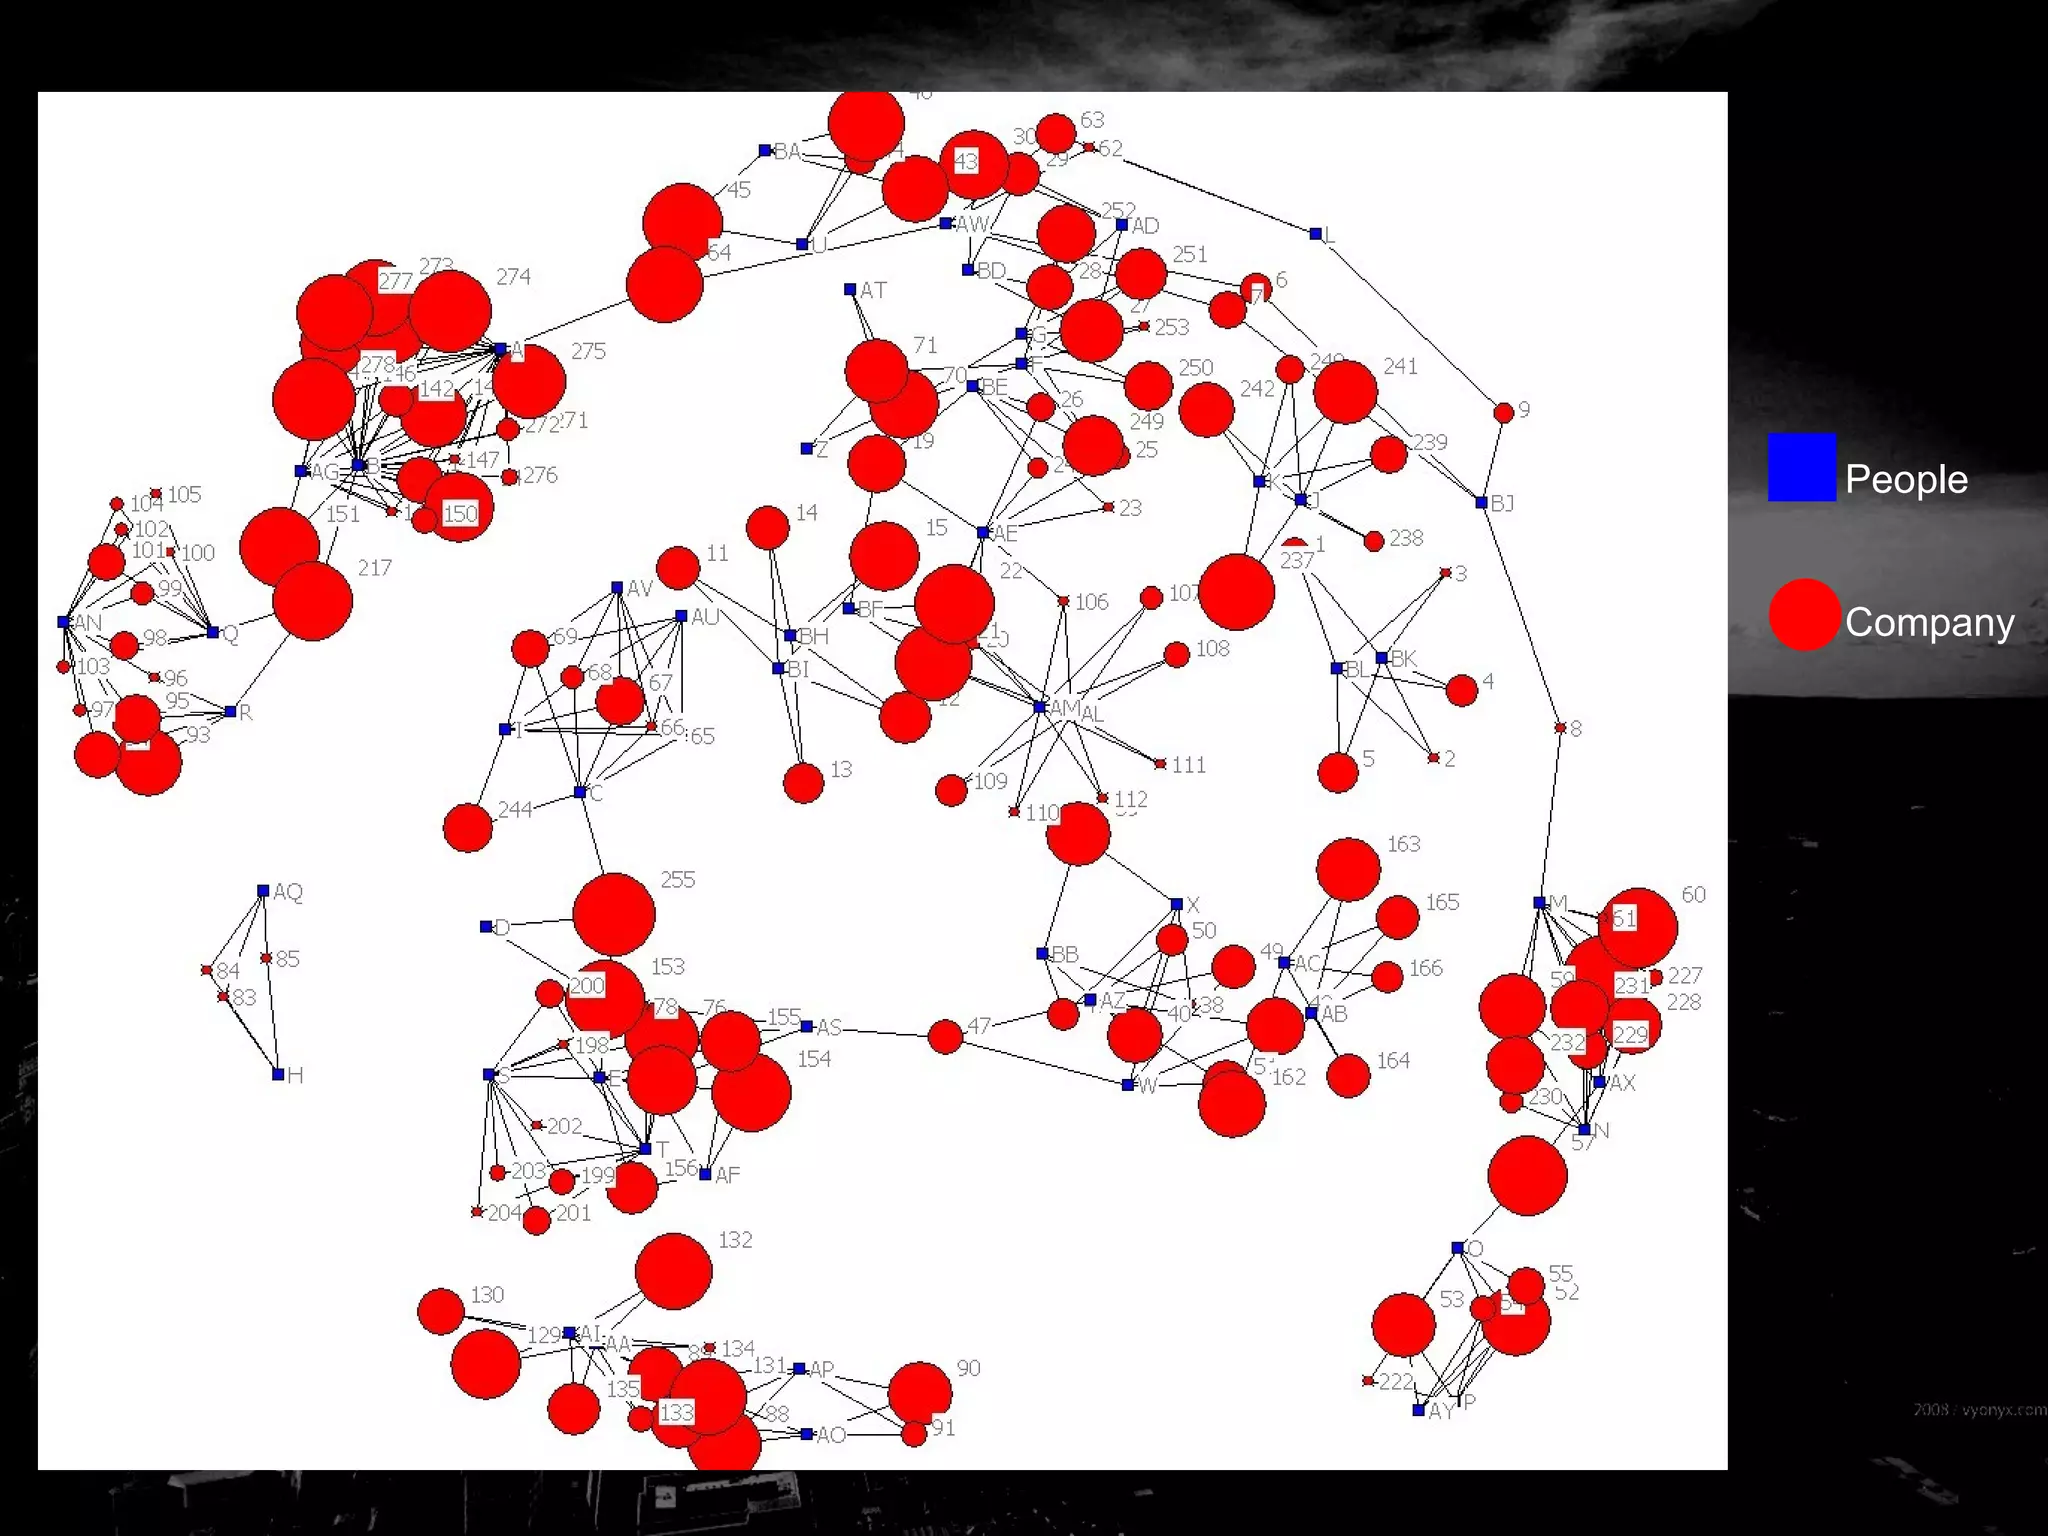
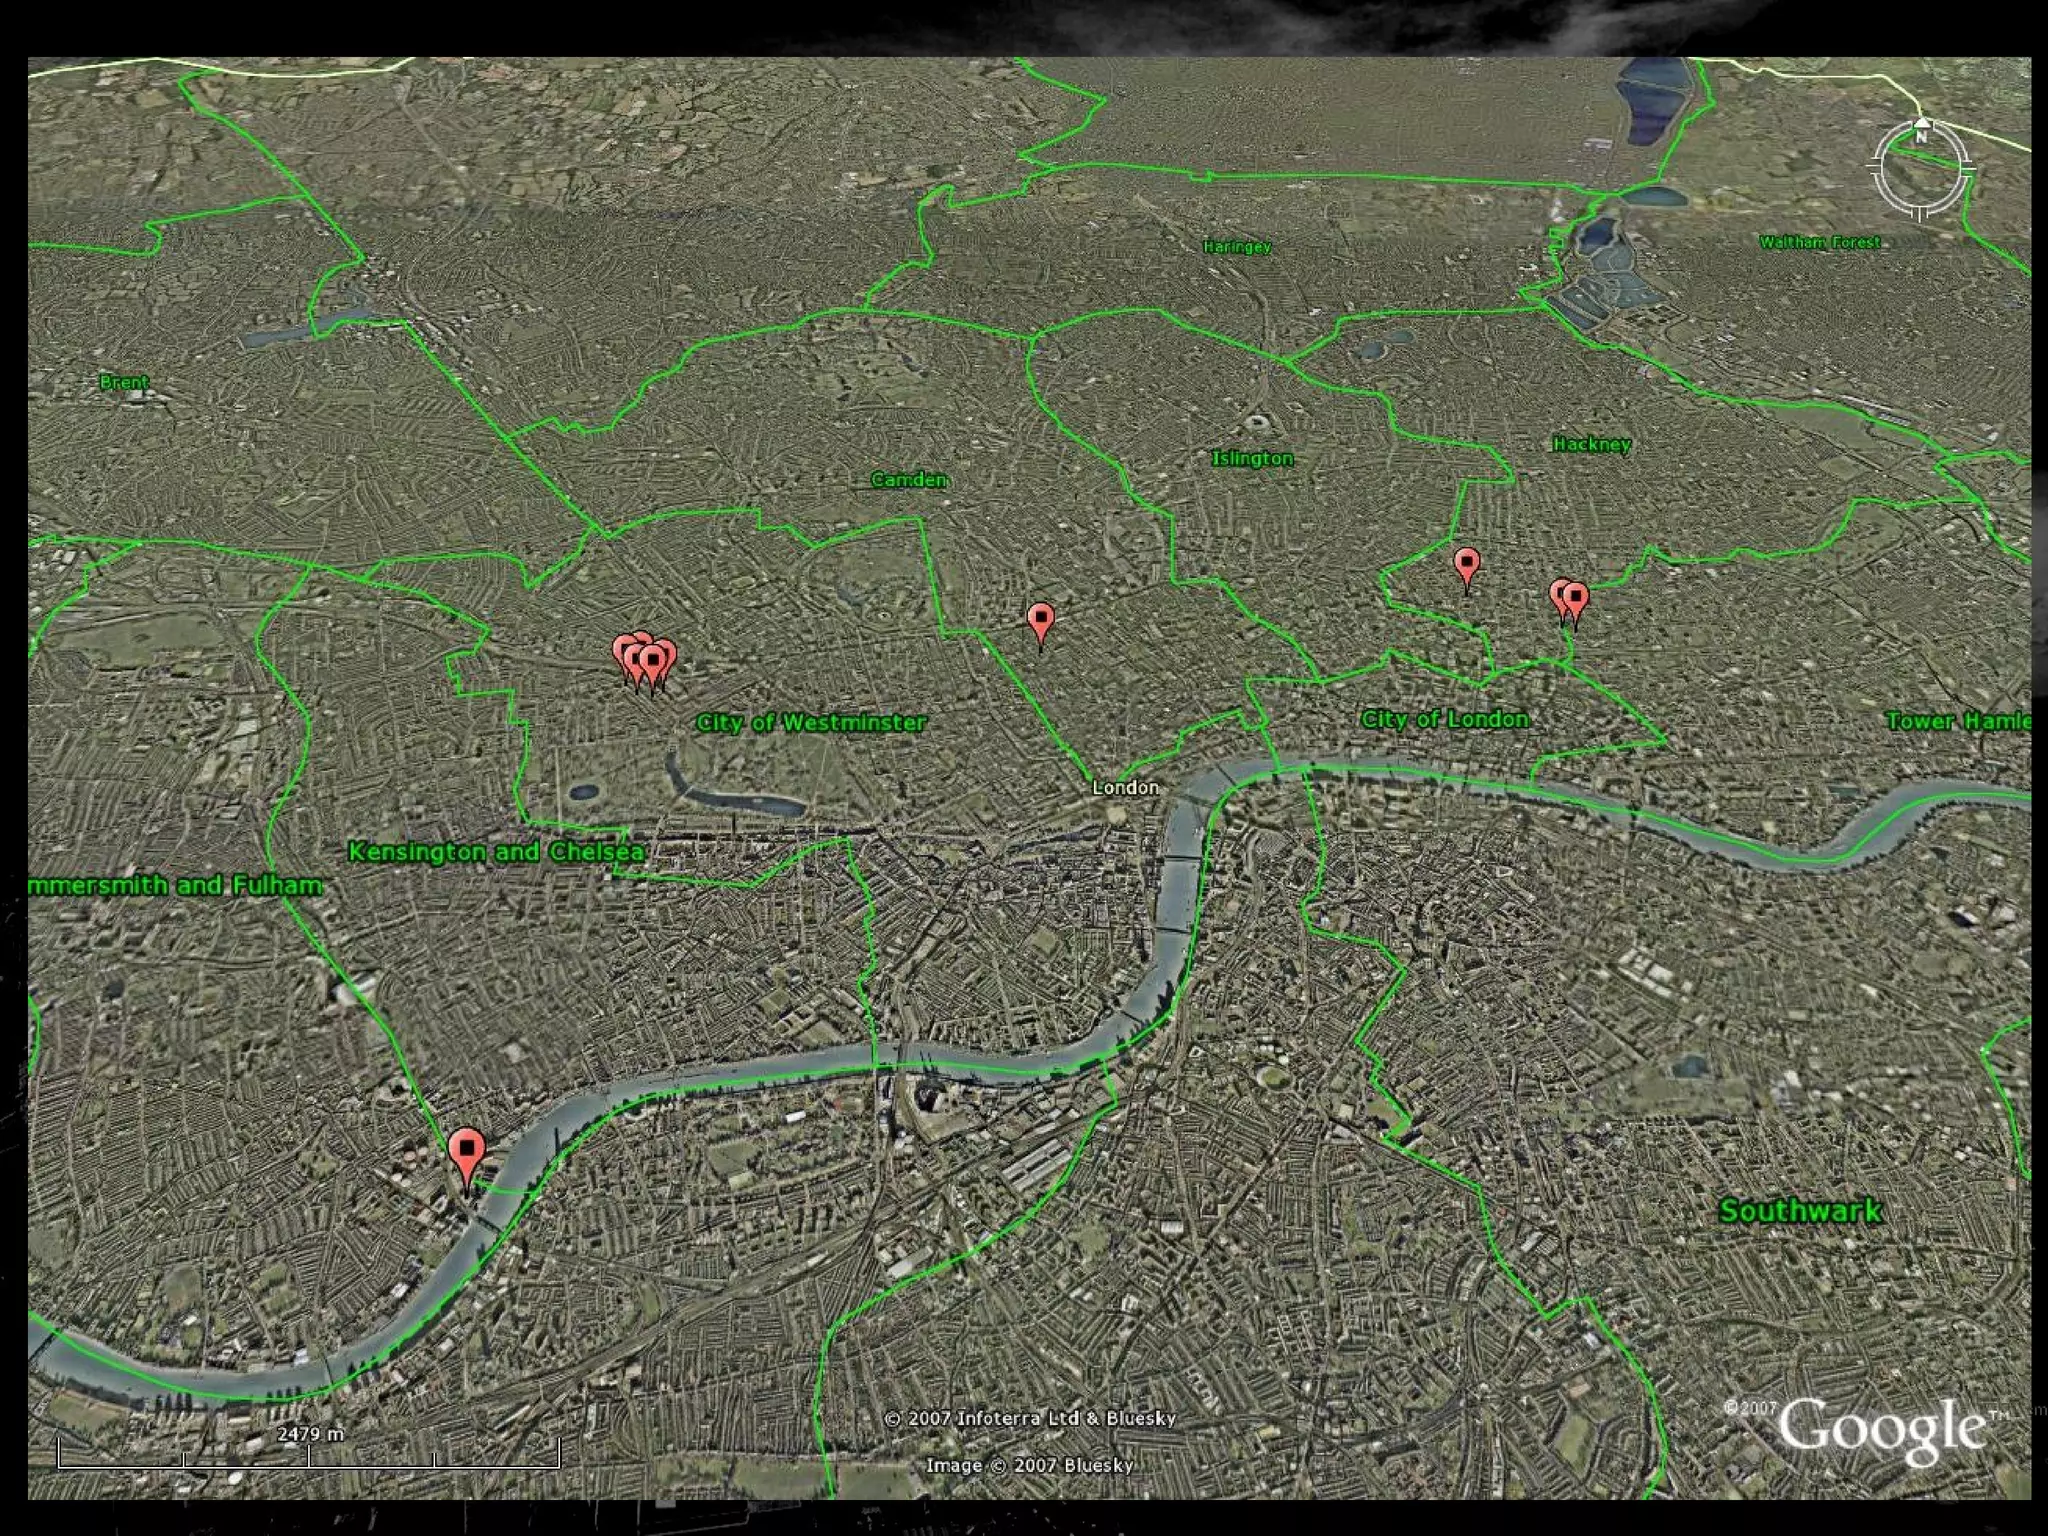
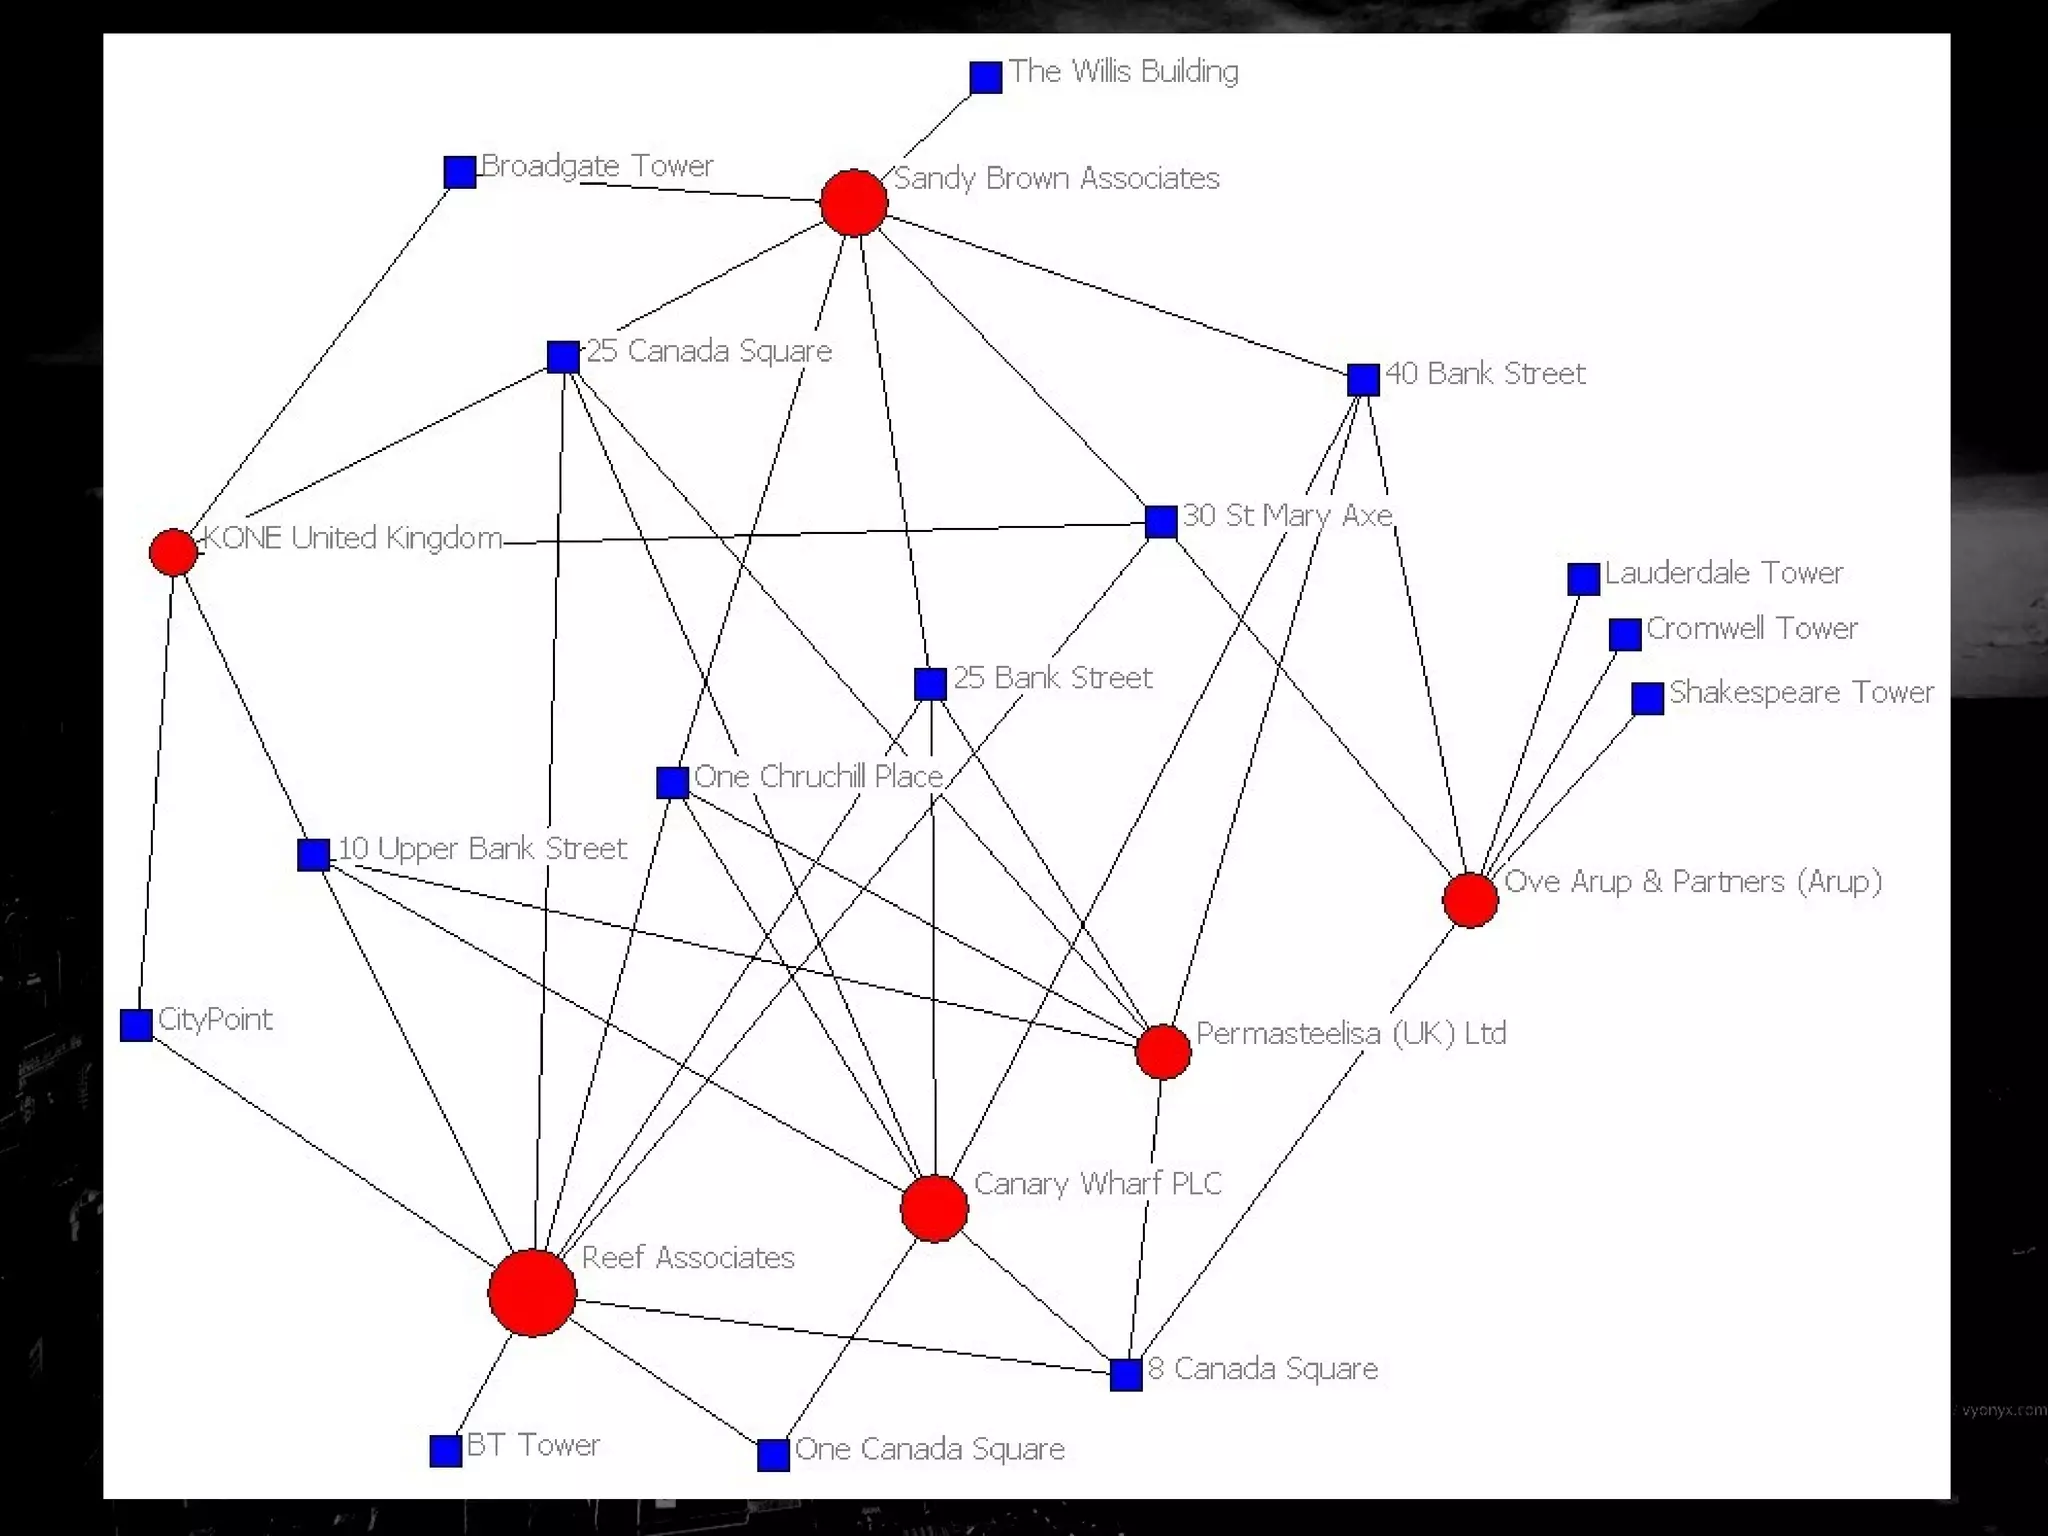
Mapping London’s skyline The project-based networks of London’s buildings
 
 
Outline Background Literature Economic Geography Project-led economies Creative Industries World Cities Examples of methodology Mapping London’s Project Skyline Architecture Social Network Analysis Geographical spread Closing remarks
Economic Geography ‘ New Economy’/’Relational turn’ (Yeung, 2005; Jones, 2008) Regionalism/pro-scale debates countered by practice-based ontologies Focused on the activities of multi-nationals (.e.g law firms, financial institusions) Inter- and intra-firm networking Quantitative and qualitative techniques
Economic Geography II Major characteristic of the new economy is project-based work (Christopherson, 2004, 2006; Grabher, 2004) Employment centred around the completion of a particular project (film, album, advert, building) Work is often short-term, part-time, contract-based and freelance
Economic Geography III Project-based work prevalent in the creative industries and wider cultural economy (Pratt, 2008) 13 subsectors, but overlaps, spillover and intermixing creates a ‘messy’ definition (Christophers, 2007) City-based, with over-whelming majority of creative industry activity based in London
World Cities World Cities Sir Peter Hall (1966) John Friedmann (1986) ‘meta-narrative for world city research’ Sassen (1991) London, New York and Tokyo Based on APS data Other themes of connectivity include airline numbers and telecommunications
World Cities II Sassen (1991) Intra-City/Inter-firm Taylor (2004) Inter-City/Intra-firm
World Cities III So which one is right? Is power  in  a city (Sassen) or  between  cities (Taylor)? Maybe power is moving away from the city? (Kotkin, 2005) I would argue, both
Example: London’s Advertising Industry Social Network Analysis Company data downloaded from a companies house population and then cleaned SIC code(s) and address were used to identify relevant companies and then each entry was tested for relevance Resulting data was filtered to remove those companies with less than 4 people on the board – which means the networks that are produced have certain characteristics: People-centric: Selects people on many boards rather than boards of directors that have many people. This was done as the advertising industry (and wider creative industries) tend to be ‘fluid’ (in other words, high degree of freelancing, sub-contracting etc) so the individual is important Top-heavy: Selects those people who sit on the board of larger companies (i.e. with more board members)
People Company
People Company
 
 
Example of SNA methodology for highlighting (and measuring) intra-city networks (and clustering) of a particular industry, but not projects World city network analysis also provides a quantitative method
Example: Sydney’s Film Industry City locations of Sydney’s top ten TV production firms
Example: Sydney’s Film Industry Number of TV co-productions between Sydney firms and  firms in other cities 2000–2005
Example: Sydney’s Film Industry City abbreviations:  AD Adelaide; AK Auckland; BR  Bristol; DB Dublin; DL Delhi; JK Jakarta; LA Los Angeles; LN London; MB Mumbai; MT Montreal; NY New York; OT Ottawa; PS Paris; SH Shanghai; SN Singapore; SY Sydney; VC Vancouver; WS Washington
Project:  Mary Bryant London-Sydney co-production Screentime in Sydney and Granada in London Interviews and site-visits (quasi-ethnographic) methodology adds data on the  practices  of city networks
Qualitative methodological techniques used to complement quantitative ‘range-finding’ techniques
Architecture 1 of the 13 subsectors of the creative industries Highly project-based (Grabher, 2004) Economically and infrastructurally, heavily linked to design
David Walker (1995)
Architecture Highly reagulated and supported; RIBA, Design Council, Architectural Association  Large amounts of data (project-based) Norman Foster Ave Arup SkyscraperPage.com Emporis.com
 
Top 20 Tallest Buildings in London 2008 122 m Pan Peninsula West Tower 20 1973 123 m Cromwell Tower 19 1974 123 m Lauderdale Tower 18 1976 123 m Shakespeare Tower 17 1970 124 m (Euston Tower) 16 2007 125 m The Willis Building 15 1967 127 m City Point 14 1974 143 m (Guy's Tower) 13 2008 147 m Pan Peninsula East Tower 12 2003 151 m 10 Upper Bank Street 11 2003 153 m 40 Bank Street 10 2003 153 m 25 Bank Street 9 2004 156 m One Churchill Place 8 2008 161 m Broadgate Tower 7 2003 180 m 30 St Mary Axe 6 1980 183 m Tower 42 5 1964 191 m BT Tower 4 2001 200 m 25 Canada Square 3 2002 200 m 8 Canada Square 2 1991 235 m One Canada Square 1 Year Built Height Building Rank


Going Forward…? Mapping projects quantitatively gives an insight, a framework Further qualitative research can add the ‘practice-based’ approach to project-based work Comparing projects between cities can show the international reach of certain firms/individuals Also, the global nature (carbon footprint?) of construction locales

Mapping London's Skyline

  • 1.
    Mapping London’s skylineThe project-based networks of London’s buildings
  • 2.
  • 3.
  • 4.
    Outline Background LiteratureEconomic Geography Project-led economies Creative Industries World Cities Examples of methodology Mapping London’s Project Skyline Architecture Social Network Analysis Geographical spread Closing remarks
  • 5.
    Economic Geography ‘New Economy’/’Relational turn’ (Yeung, 2005; Jones, 2008) Regionalism/pro-scale debates countered by practice-based ontologies Focused on the activities of multi-nationals (.e.g law firms, financial institusions) Inter- and intra-firm networking Quantitative and qualitative techniques
  • 6.
    Economic Geography IIMajor characteristic of the new economy is project-based work (Christopherson, 2004, 2006; Grabher, 2004) Employment centred around the completion of a particular project (film, album, advert, building) Work is often short-term, part-time, contract-based and freelance
  • 7.
    Economic Geography IIIProject-based work prevalent in the creative industries and wider cultural economy (Pratt, 2008) 13 subsectors, but overlaps, spillover and intermixing creates a ‘messy’ definition (Christophers, 2007) City-based, with over-whelming majority of creative industry activity based in London
  • 8.
    World Cities WorldCities Sir Peter Hall (1966) John Friedmann (1986) ‘meta-narrative for world city research’ Sassen (1991) London, New York and Tokyo Based on APS data Other themes of connectivity include airline numbers and telecommunications
  • 9.
    World Cities IISassen (1991) Intra-City/Inter-firm Taylor (2004) Inter-City/Intra-firm
  • 10.
    World Cities IIISo which one is right? Is power in a city (Sassen) or between cities (Taylor)? Maybe power is moving away from the city? (Kotkin, 2005) I would argue, both
  • 11.
    Example: London’s AdvertisingIndustry Social Network Analysis Company data downloaded from a companies house population and then cleaned SIC code(s) and address were used to identify relevant companies and then each entry was tested for relevance Resulting data was filtered to remove those companies with less than 4 people on the board – which means the networks that are produced have certain characteristics: People-centric: Selects people on many boards rather than boards of directors that have many people. This was done as the advertising industry (and wider creative industries) tend to be ‘fluid’ (in other words, high degree of freelancing, sub-contracting etc) so the individual is important Top-heavy: Selects those people who sit on the board of larger companies (i.e. with more board members)
  • 12.
  • 13.
  • 14.
  • 15.
  • 16.
    Example of SNAmethodology for highlighting (and measuring) intra-city networks (and clustering) of a particular industry, but not projects World city network analysis also provides a quantitative method
  • 17.
    Example: Sydney’s FilmIndustry City locations of Sydney’s top ten TV production firms
  • 18.
    Example: Sydney’s FilmIndustry Number of TV co-productions between Sydney firms and firms in other cities 2000–2005
  • 19.
    Example: Sydney’s FilmIndustry City abbreviations: AD Adelaide; AK Auckland; BR Bristol; DB Dublin; DL Delhi; JK Jakarta; LA Los Angeles; LN London; MB Mumbai; MT Montreal; NY New York; OT Ottawa; PS Paris; SH Shanghai; SN Singapore; SY Sydney; VC Vancouver; WS Washington
  • 20.
    Project: MaryBryant London-Sydney co-production Screentime in Sydney and Granada in London Interviews and site-visits (quasi-ethnographic) methodology adds data on the practices of city networks
  • 21.
    Qualitative methodological techniquesused to complement quantitative ‘range-finding’ techniques
  • 22.
    Architecture 1 ofthe 13 subsectors of the creative industries Highly project-based (Grabher, 2004) Economically and infrastructurally, heavily linked to design
  • 23.
  • 24.
    Architecture Highly reagulatedand supported; RIBA, Design Council, Architectural Association Large amounts of data (project-based) Norman Foster Ave Arup SkyscraperPage.com Emporis.com
  • 25.
  • 26.
    Top 20 TallestBuildings in London 2008 122 m Pan Peninsula West Tower 20 1973 123 m Cromwell Tower 19 1974 123 m Lauderdale Tower 18 1976 123 m Shakespeare Tower 17 1970 124 m (Euston Tower) 16 2007 125 m The Willis Building 15 1967 127 m City Point 14 1974 143 m (Guy's Tower) 13 2008 147 m Pan Peninsula East Tower 12 2003 151 m 10 Upper Bank Street 11 2003 153 m 40 Bank Street 10 2003 153 m 25 Bank Street 9 2004 156 m One Churchill Place 8 2008 161 m Broadgate Tower 7 2003 180 m 30 St Mary Axe 6 1980 183 m Tower 42 5 1964 191 m BT Tower 4 2001 200 m 25 Canada Square 3 2002 200 m 8 Canada Square 2 1991 235 m One Canada Square 1 Year Built Height Building Rank
  • 27.
  • 28.
  • 29.
  • 30.
  • 31.
    Going Forward…? Mappingprojects quantitatively gives an insight, a framework Further qualitative research can add the ‘practice-based’ approach to project-based work Comparing projects between cities can show the international reach of certain firms/individuals Also, the global nature (carbon footprint?) of construction locales