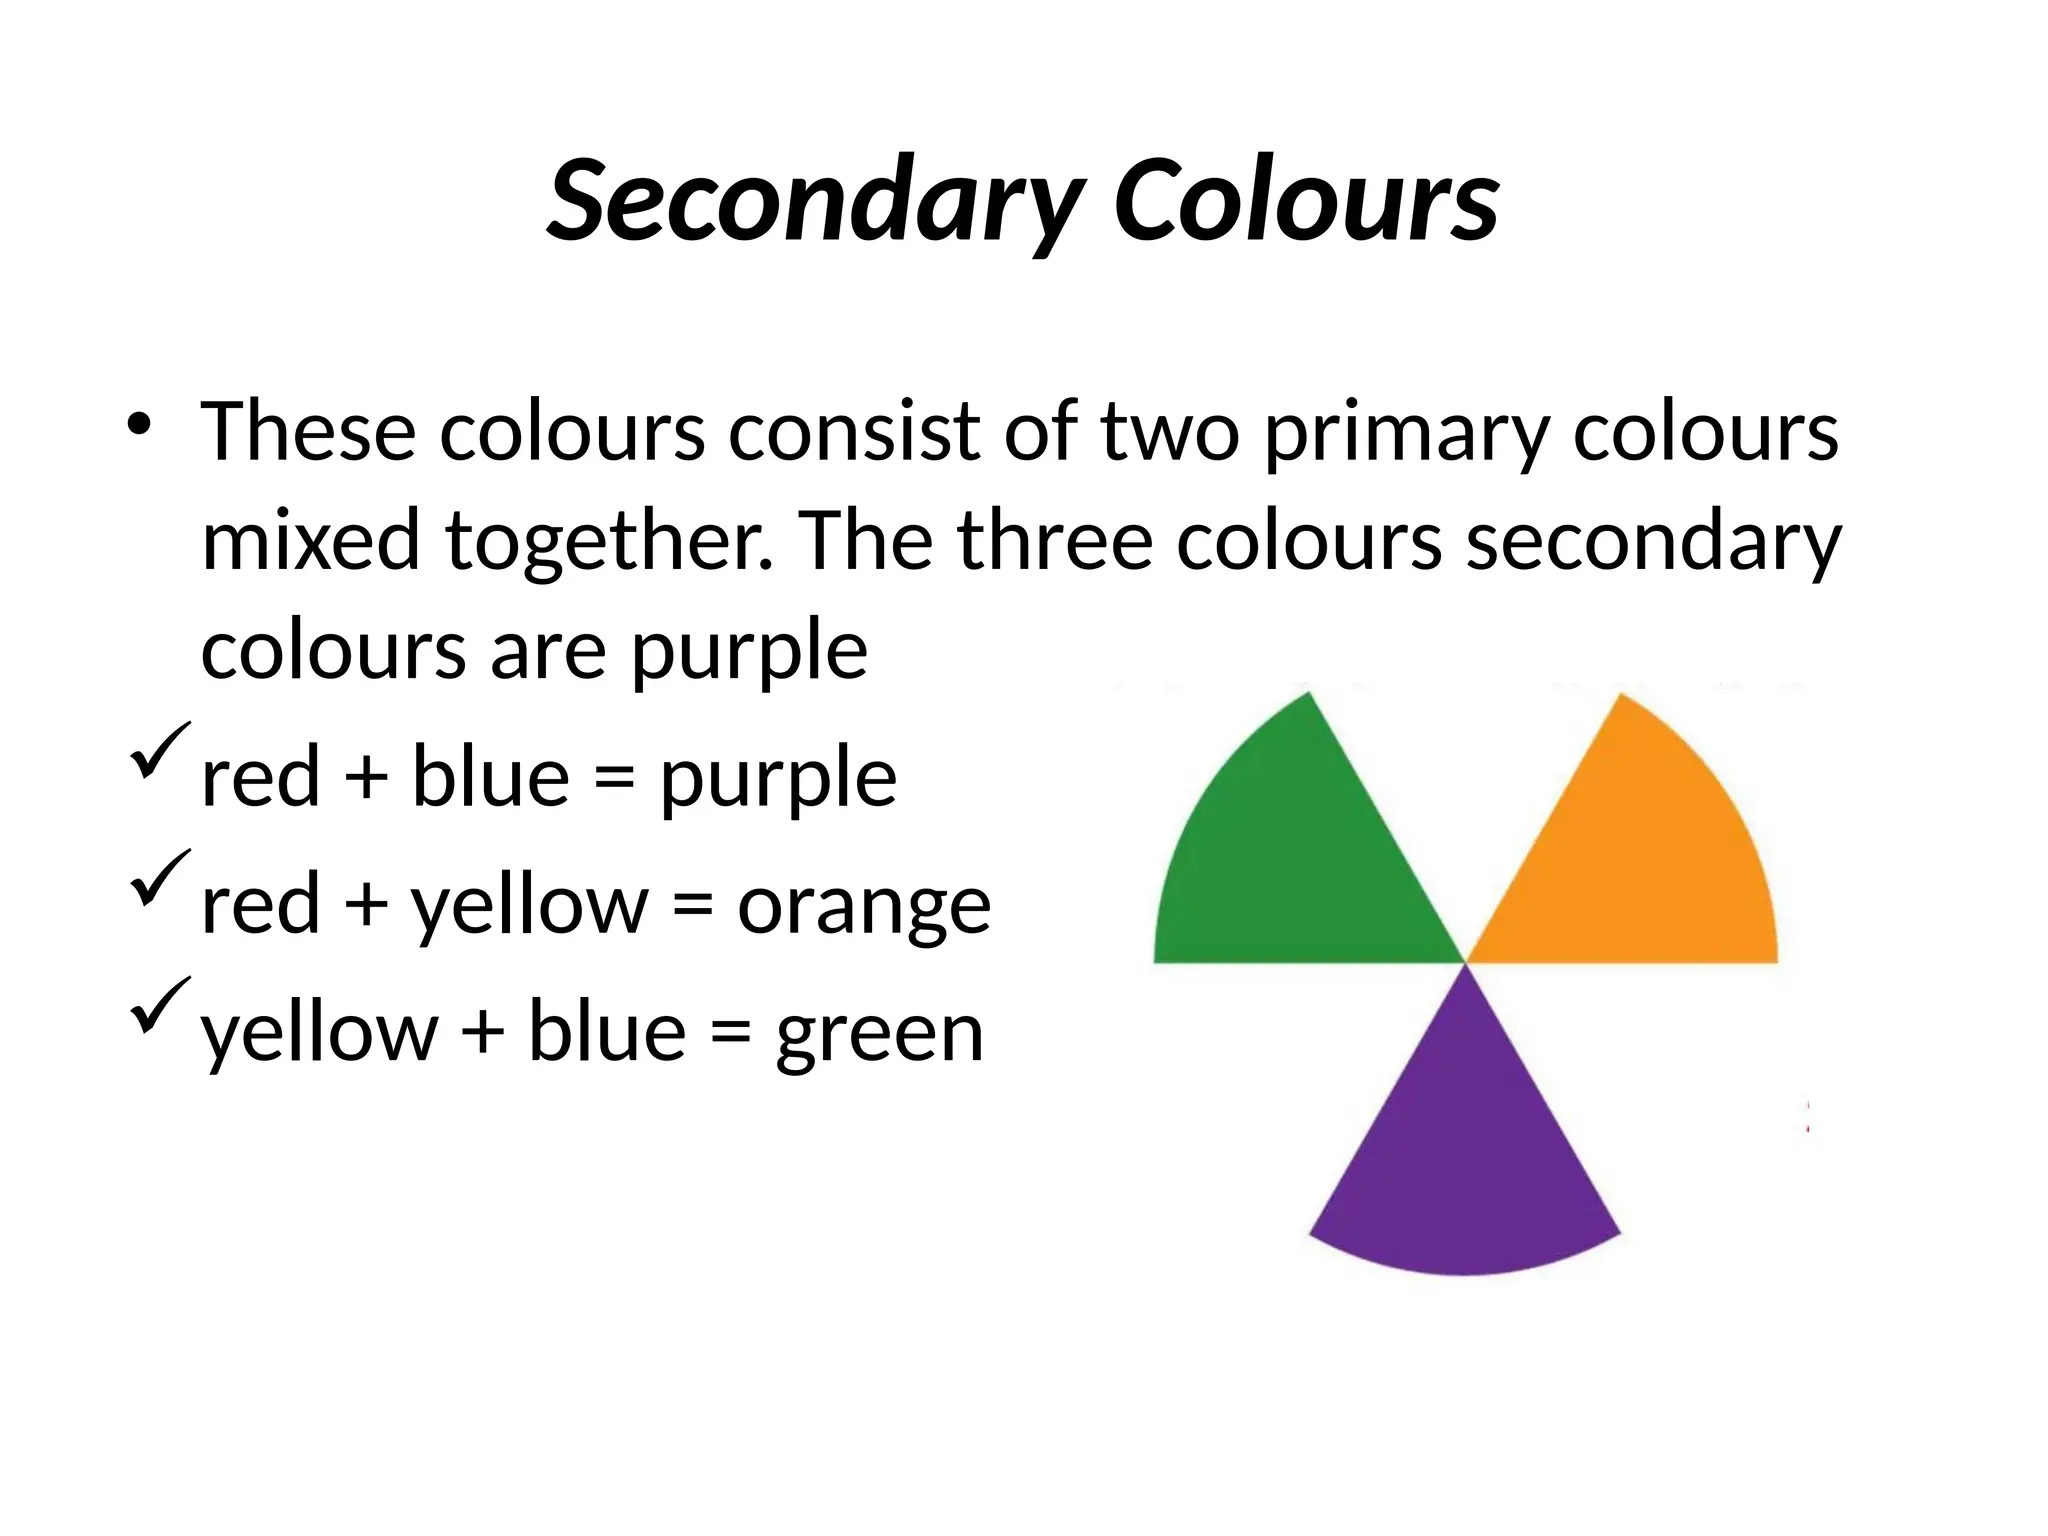
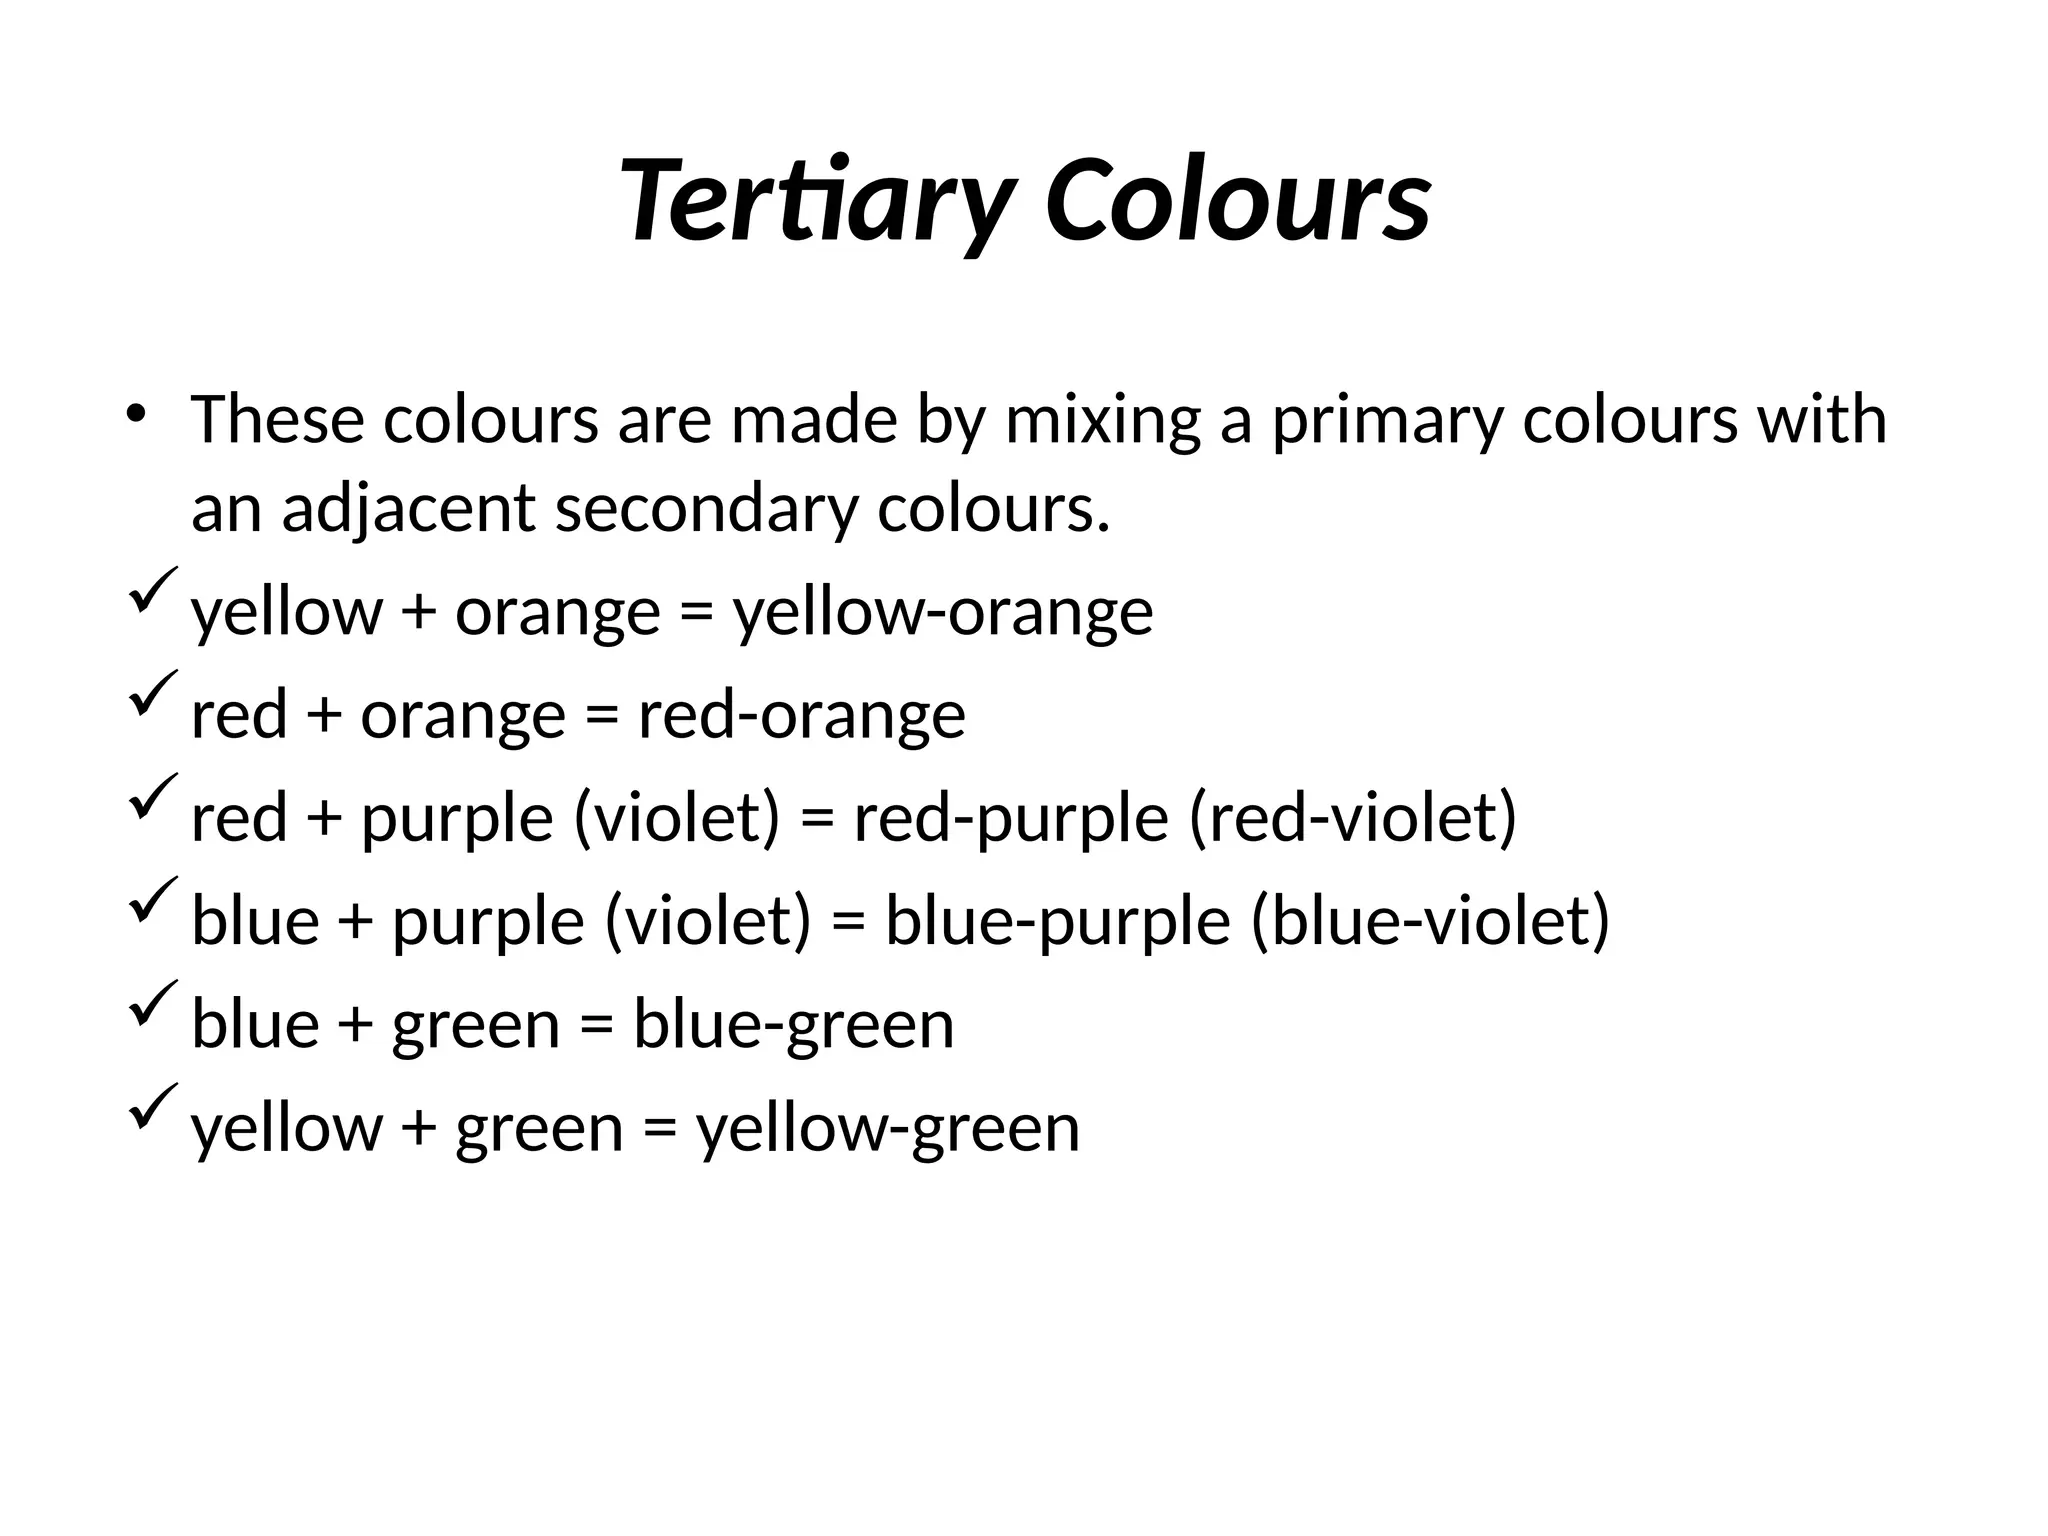
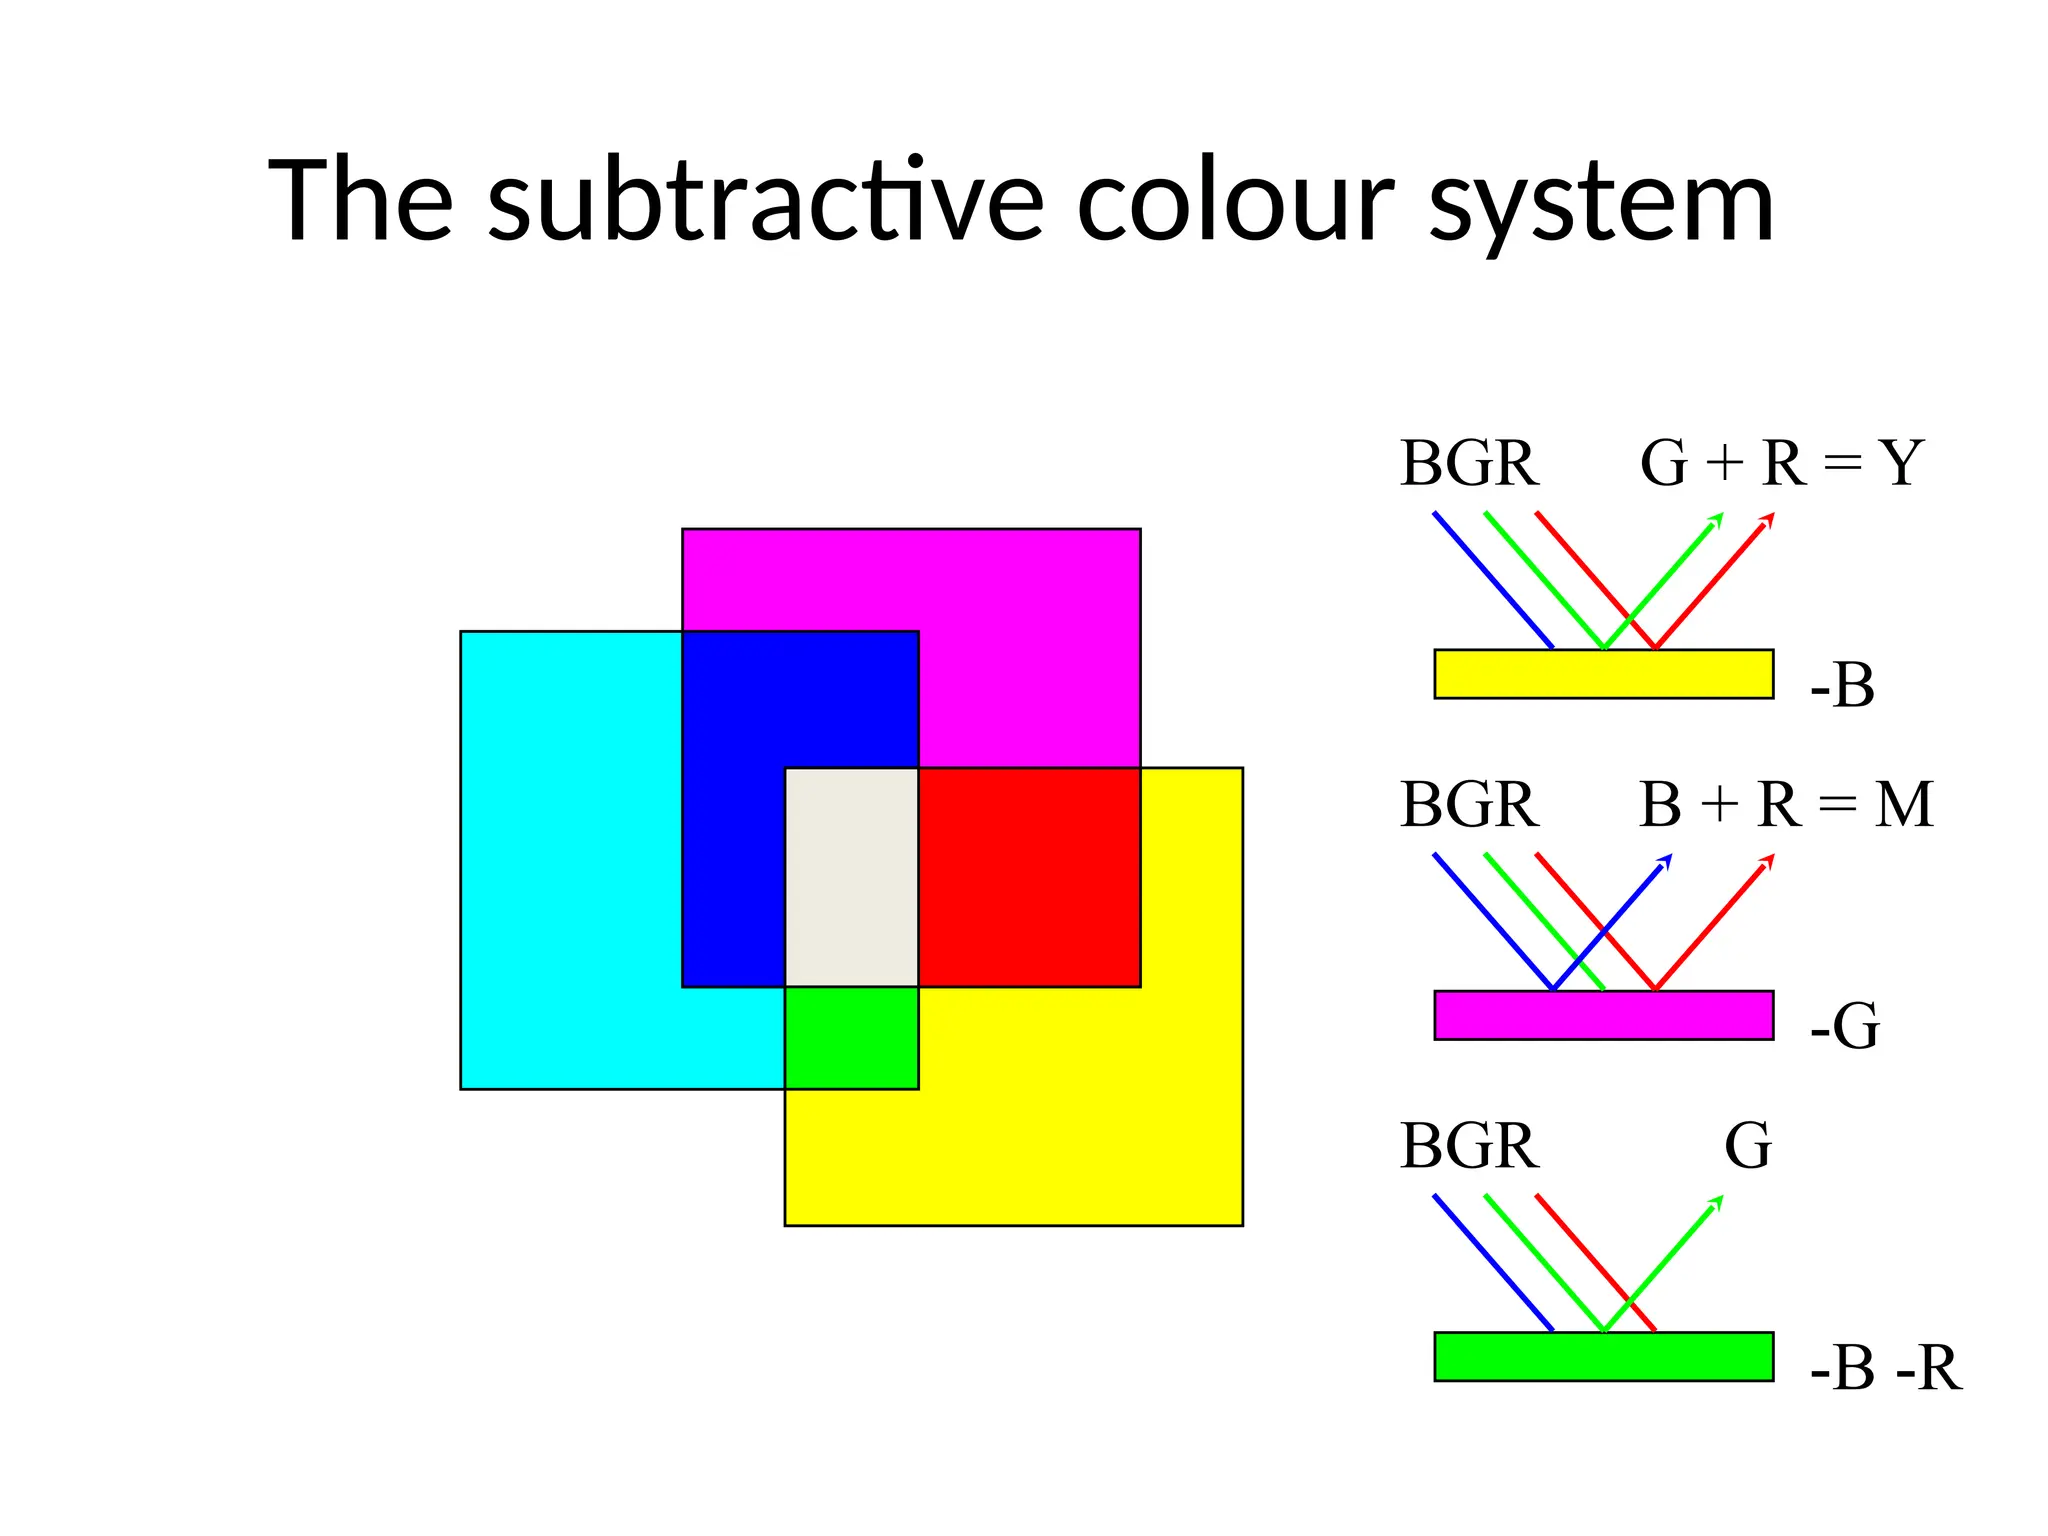
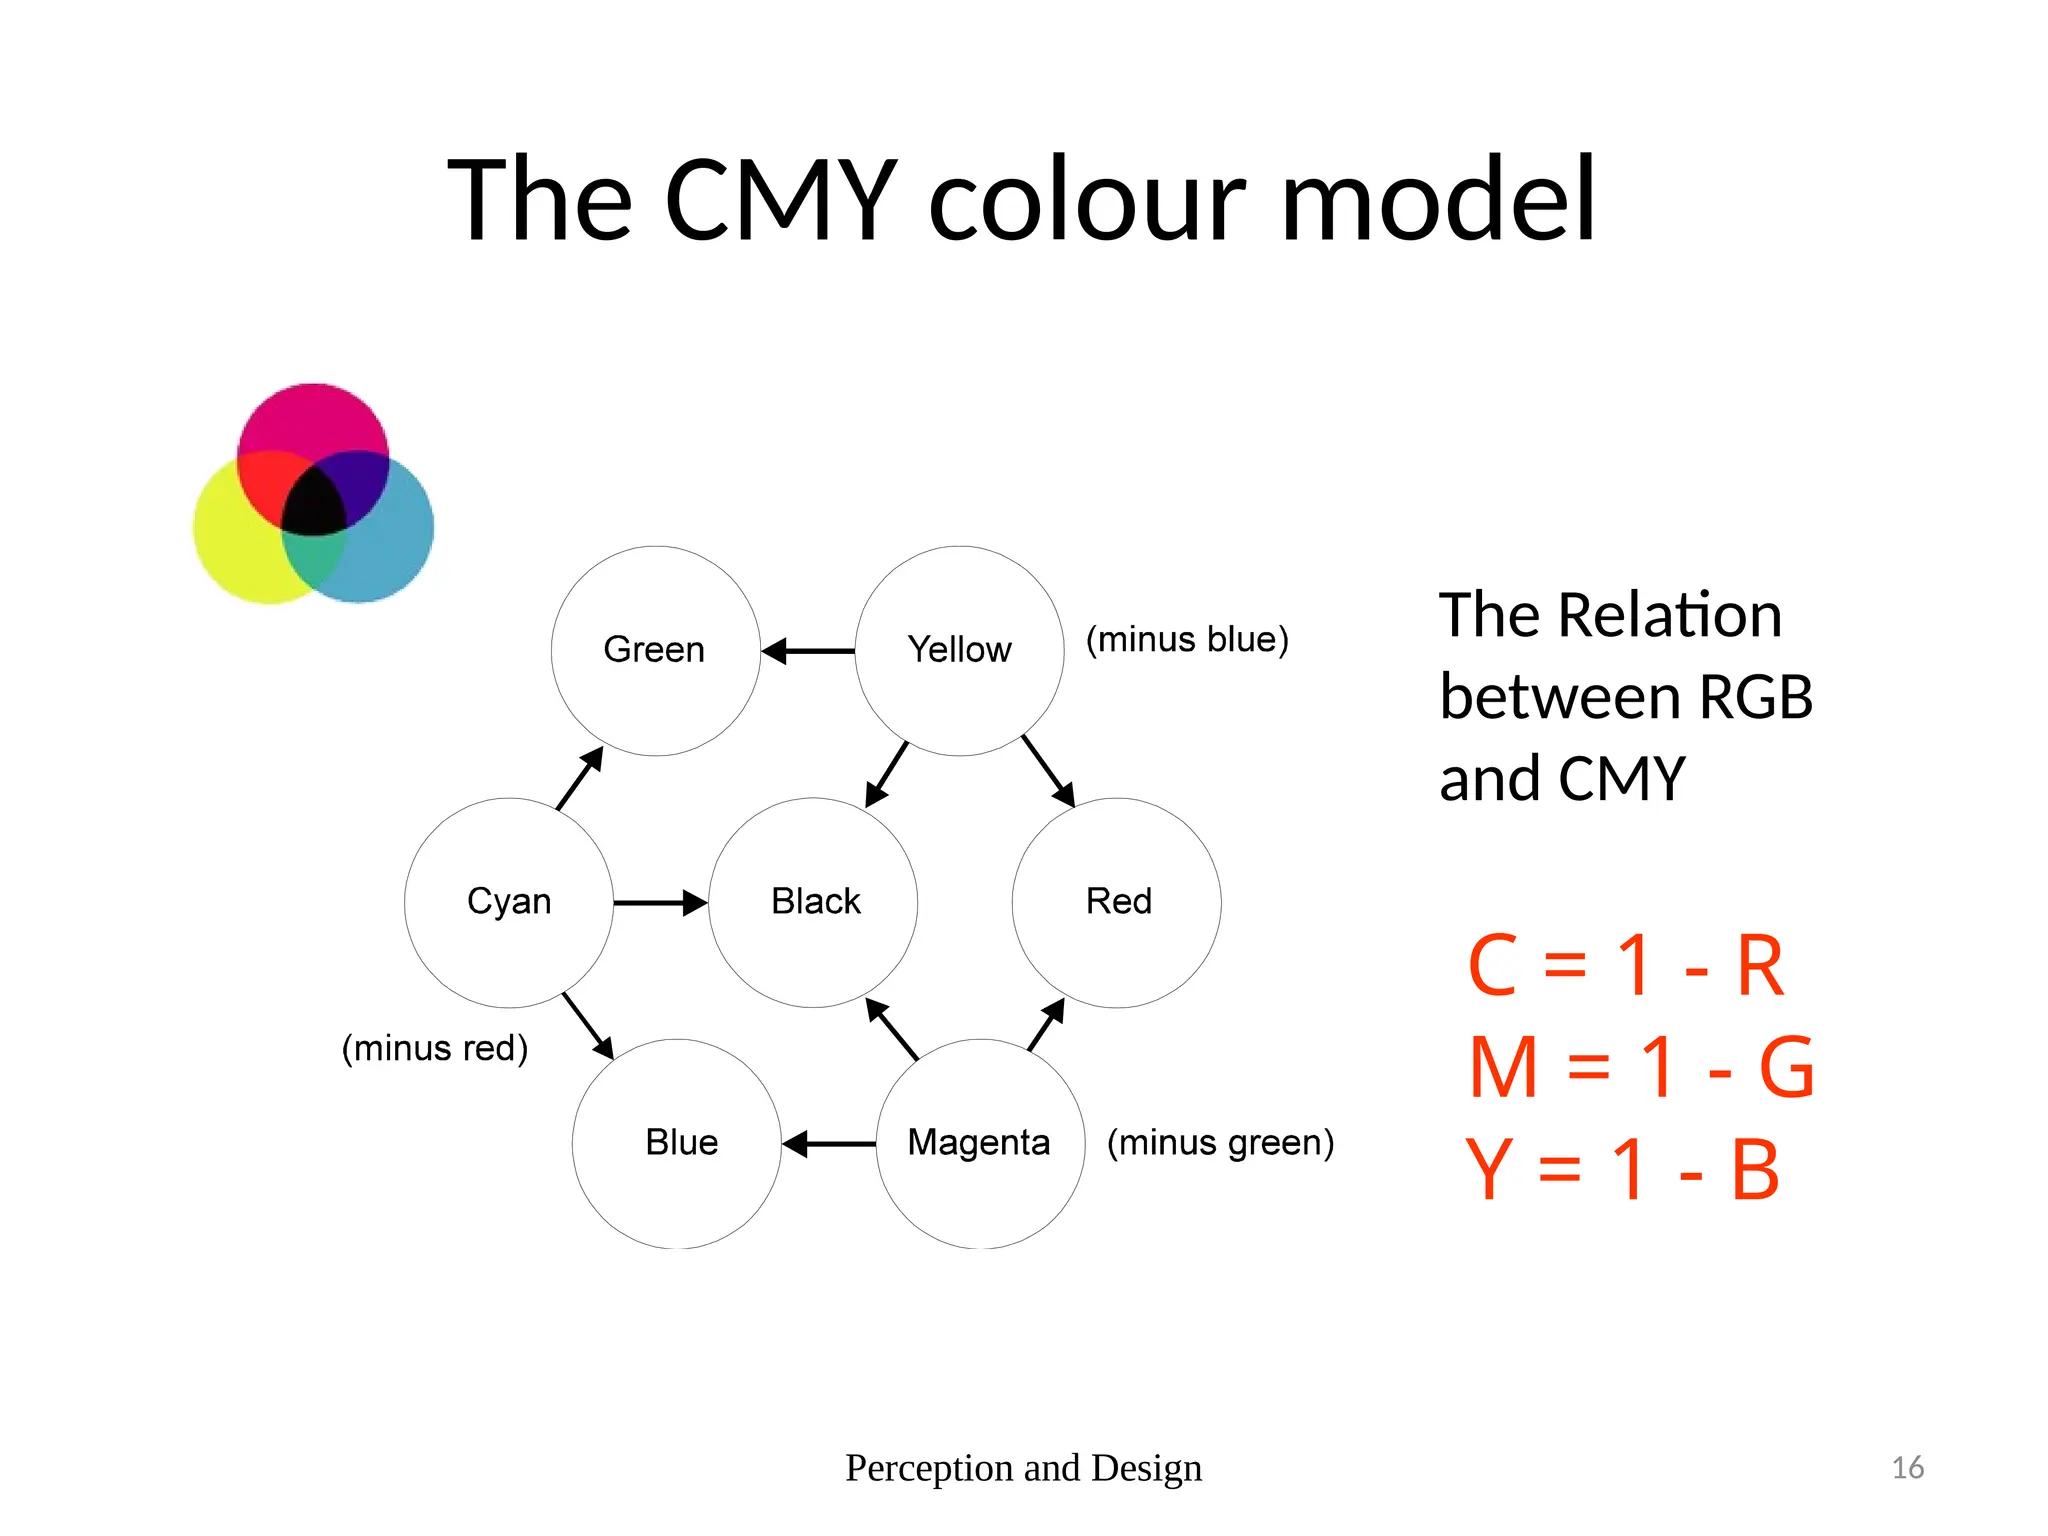
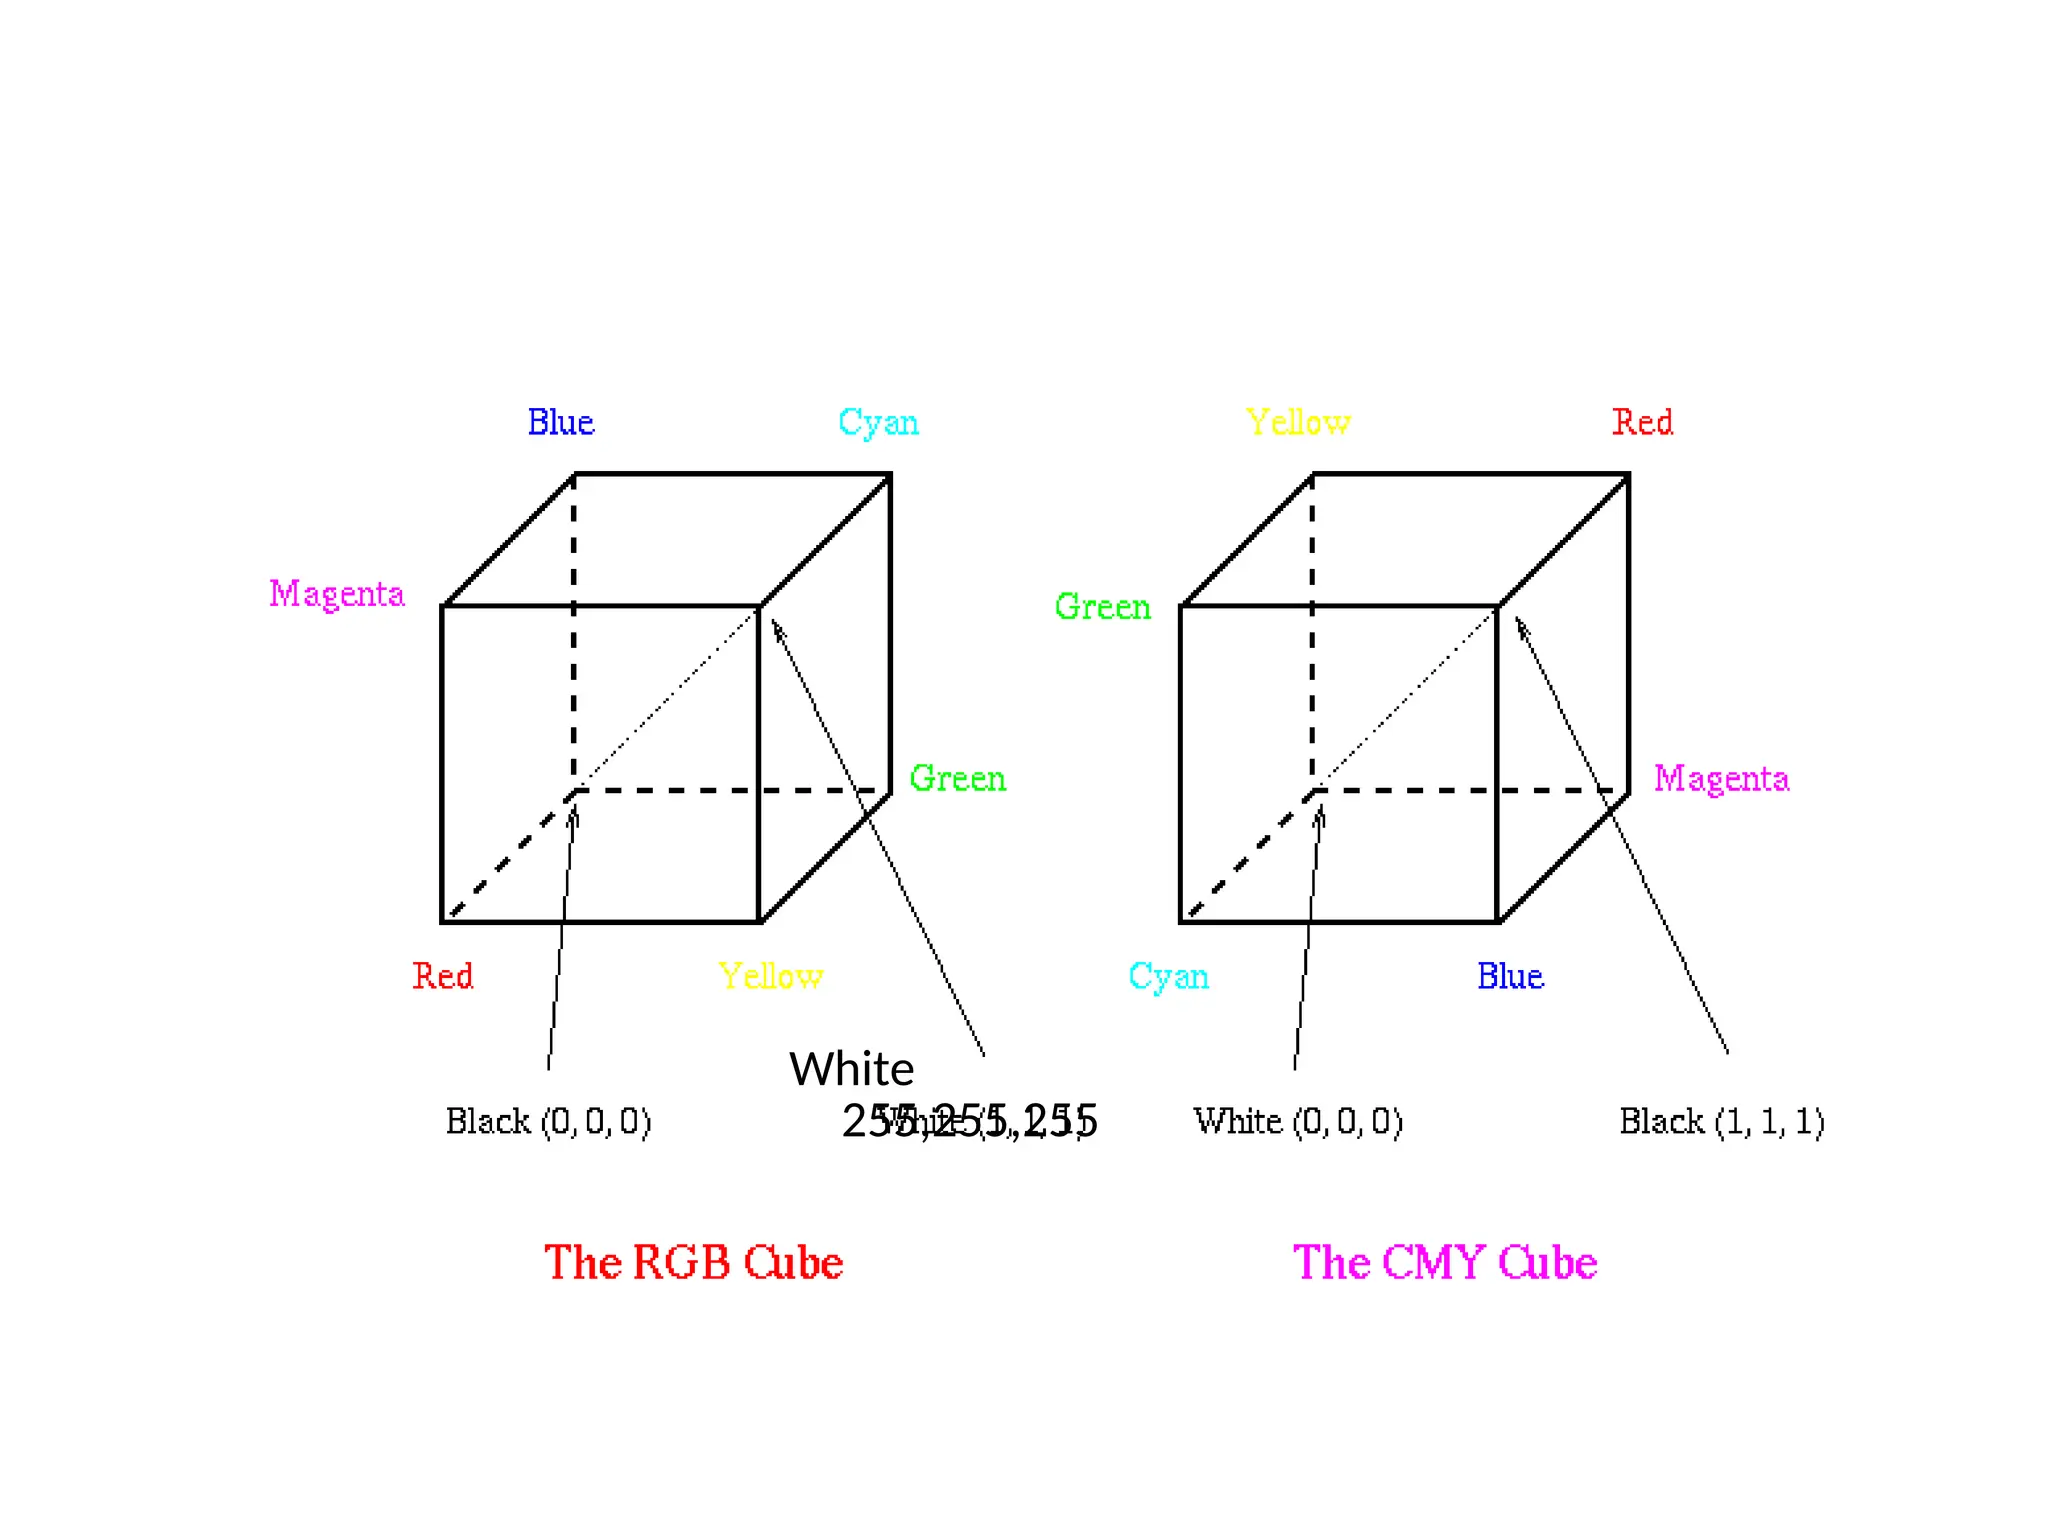
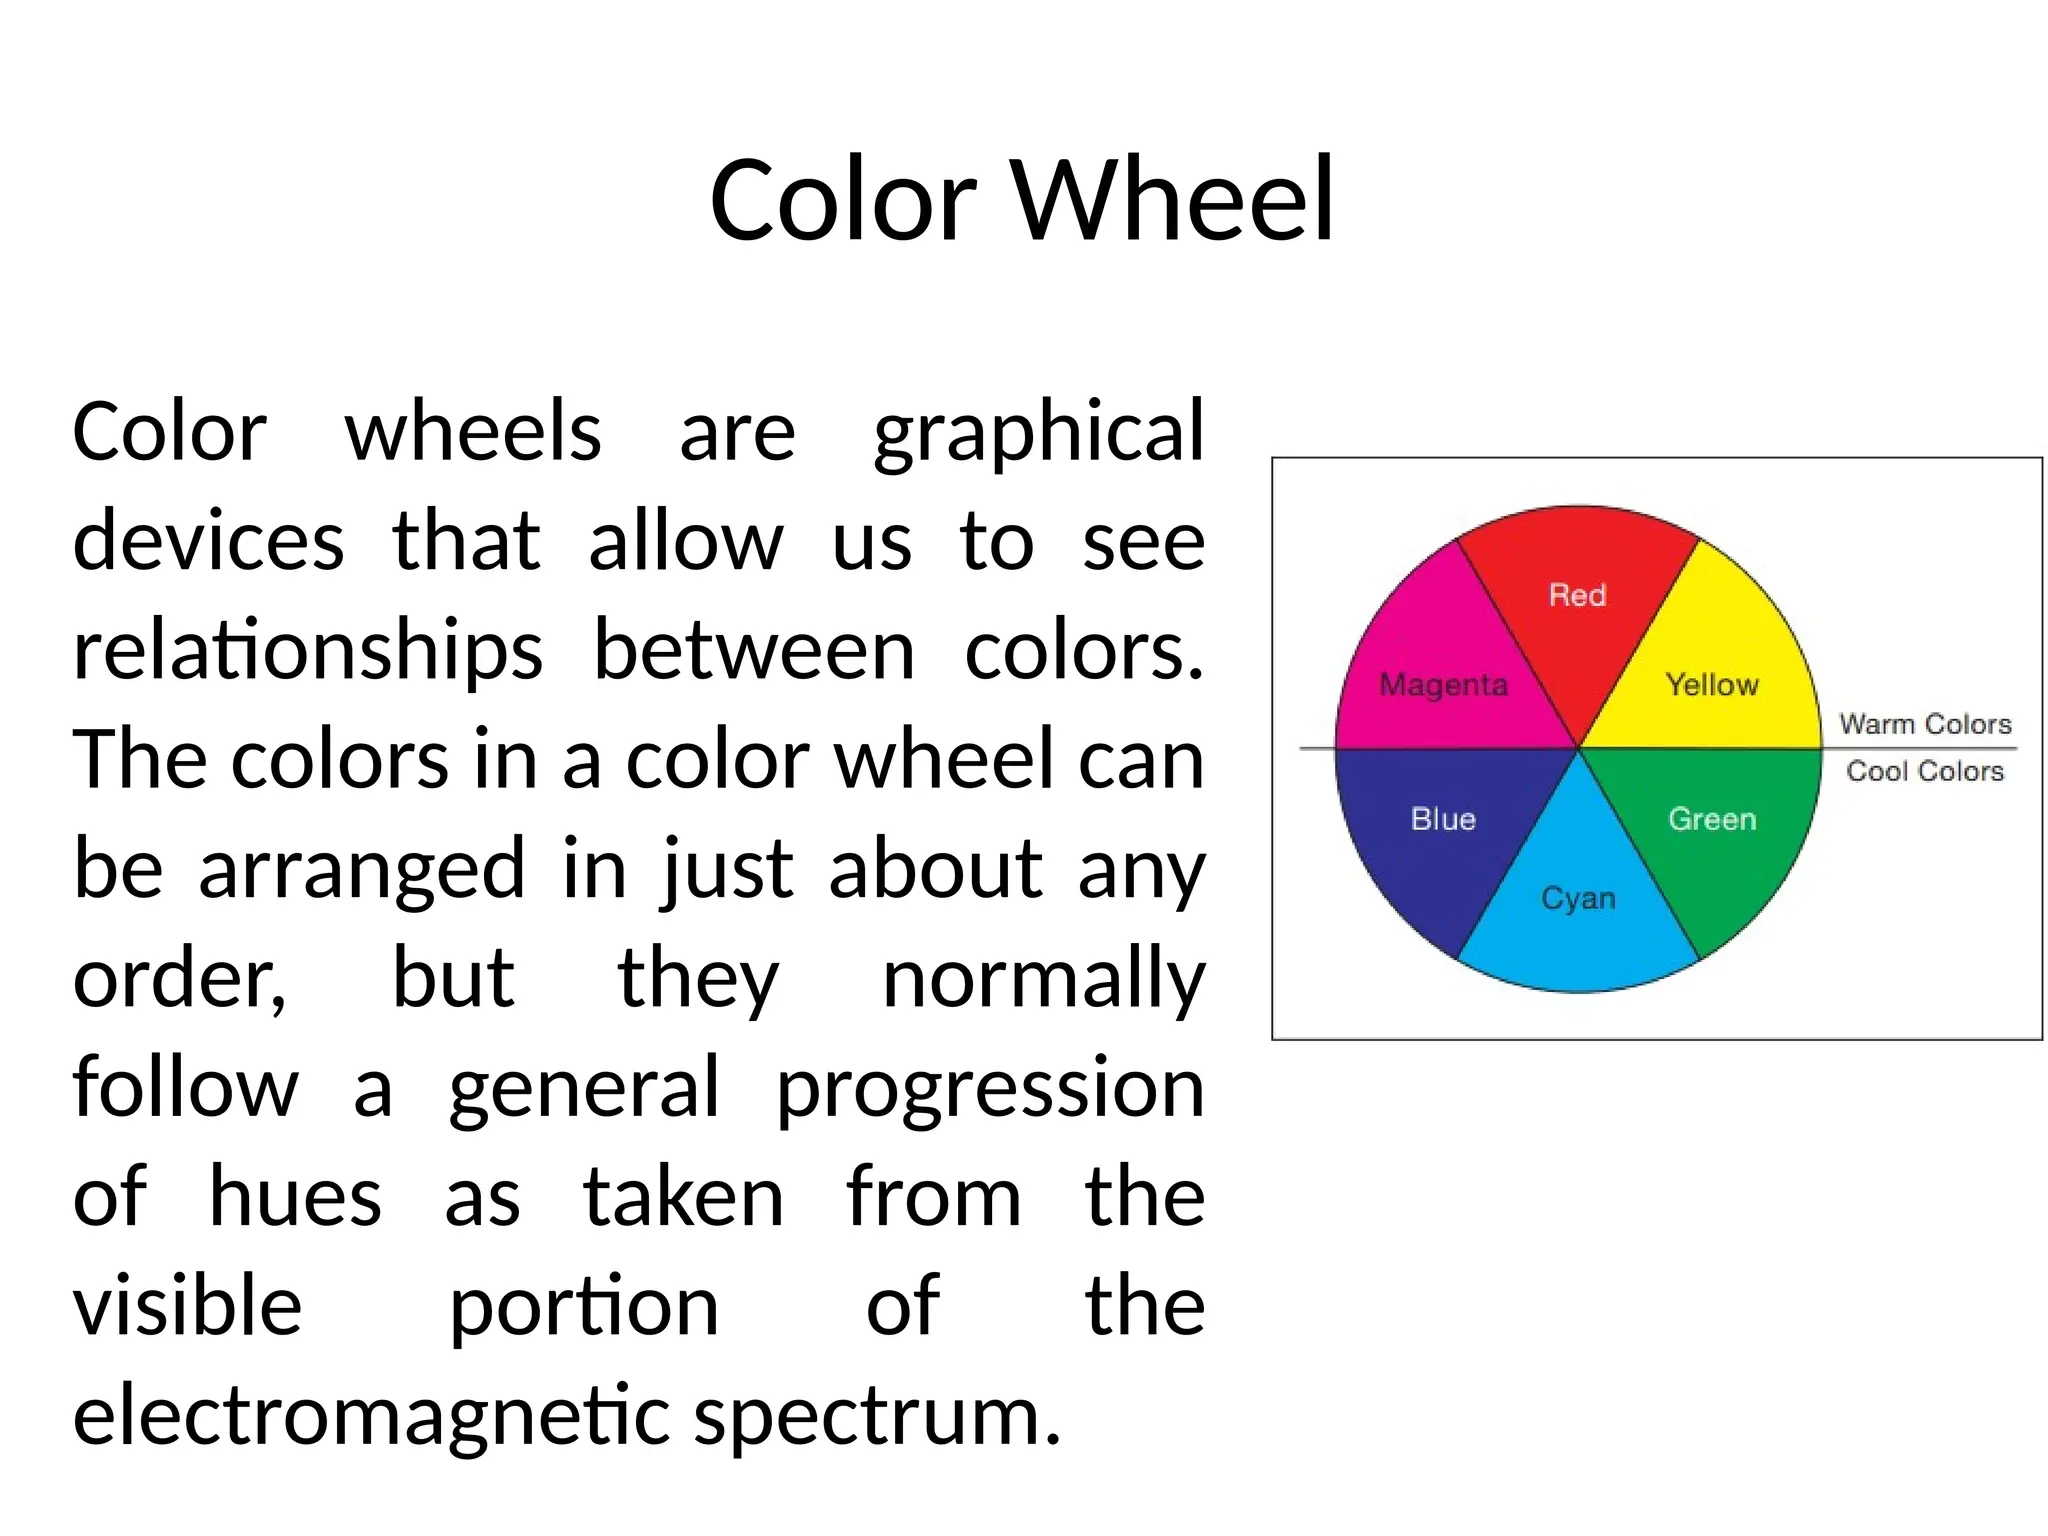
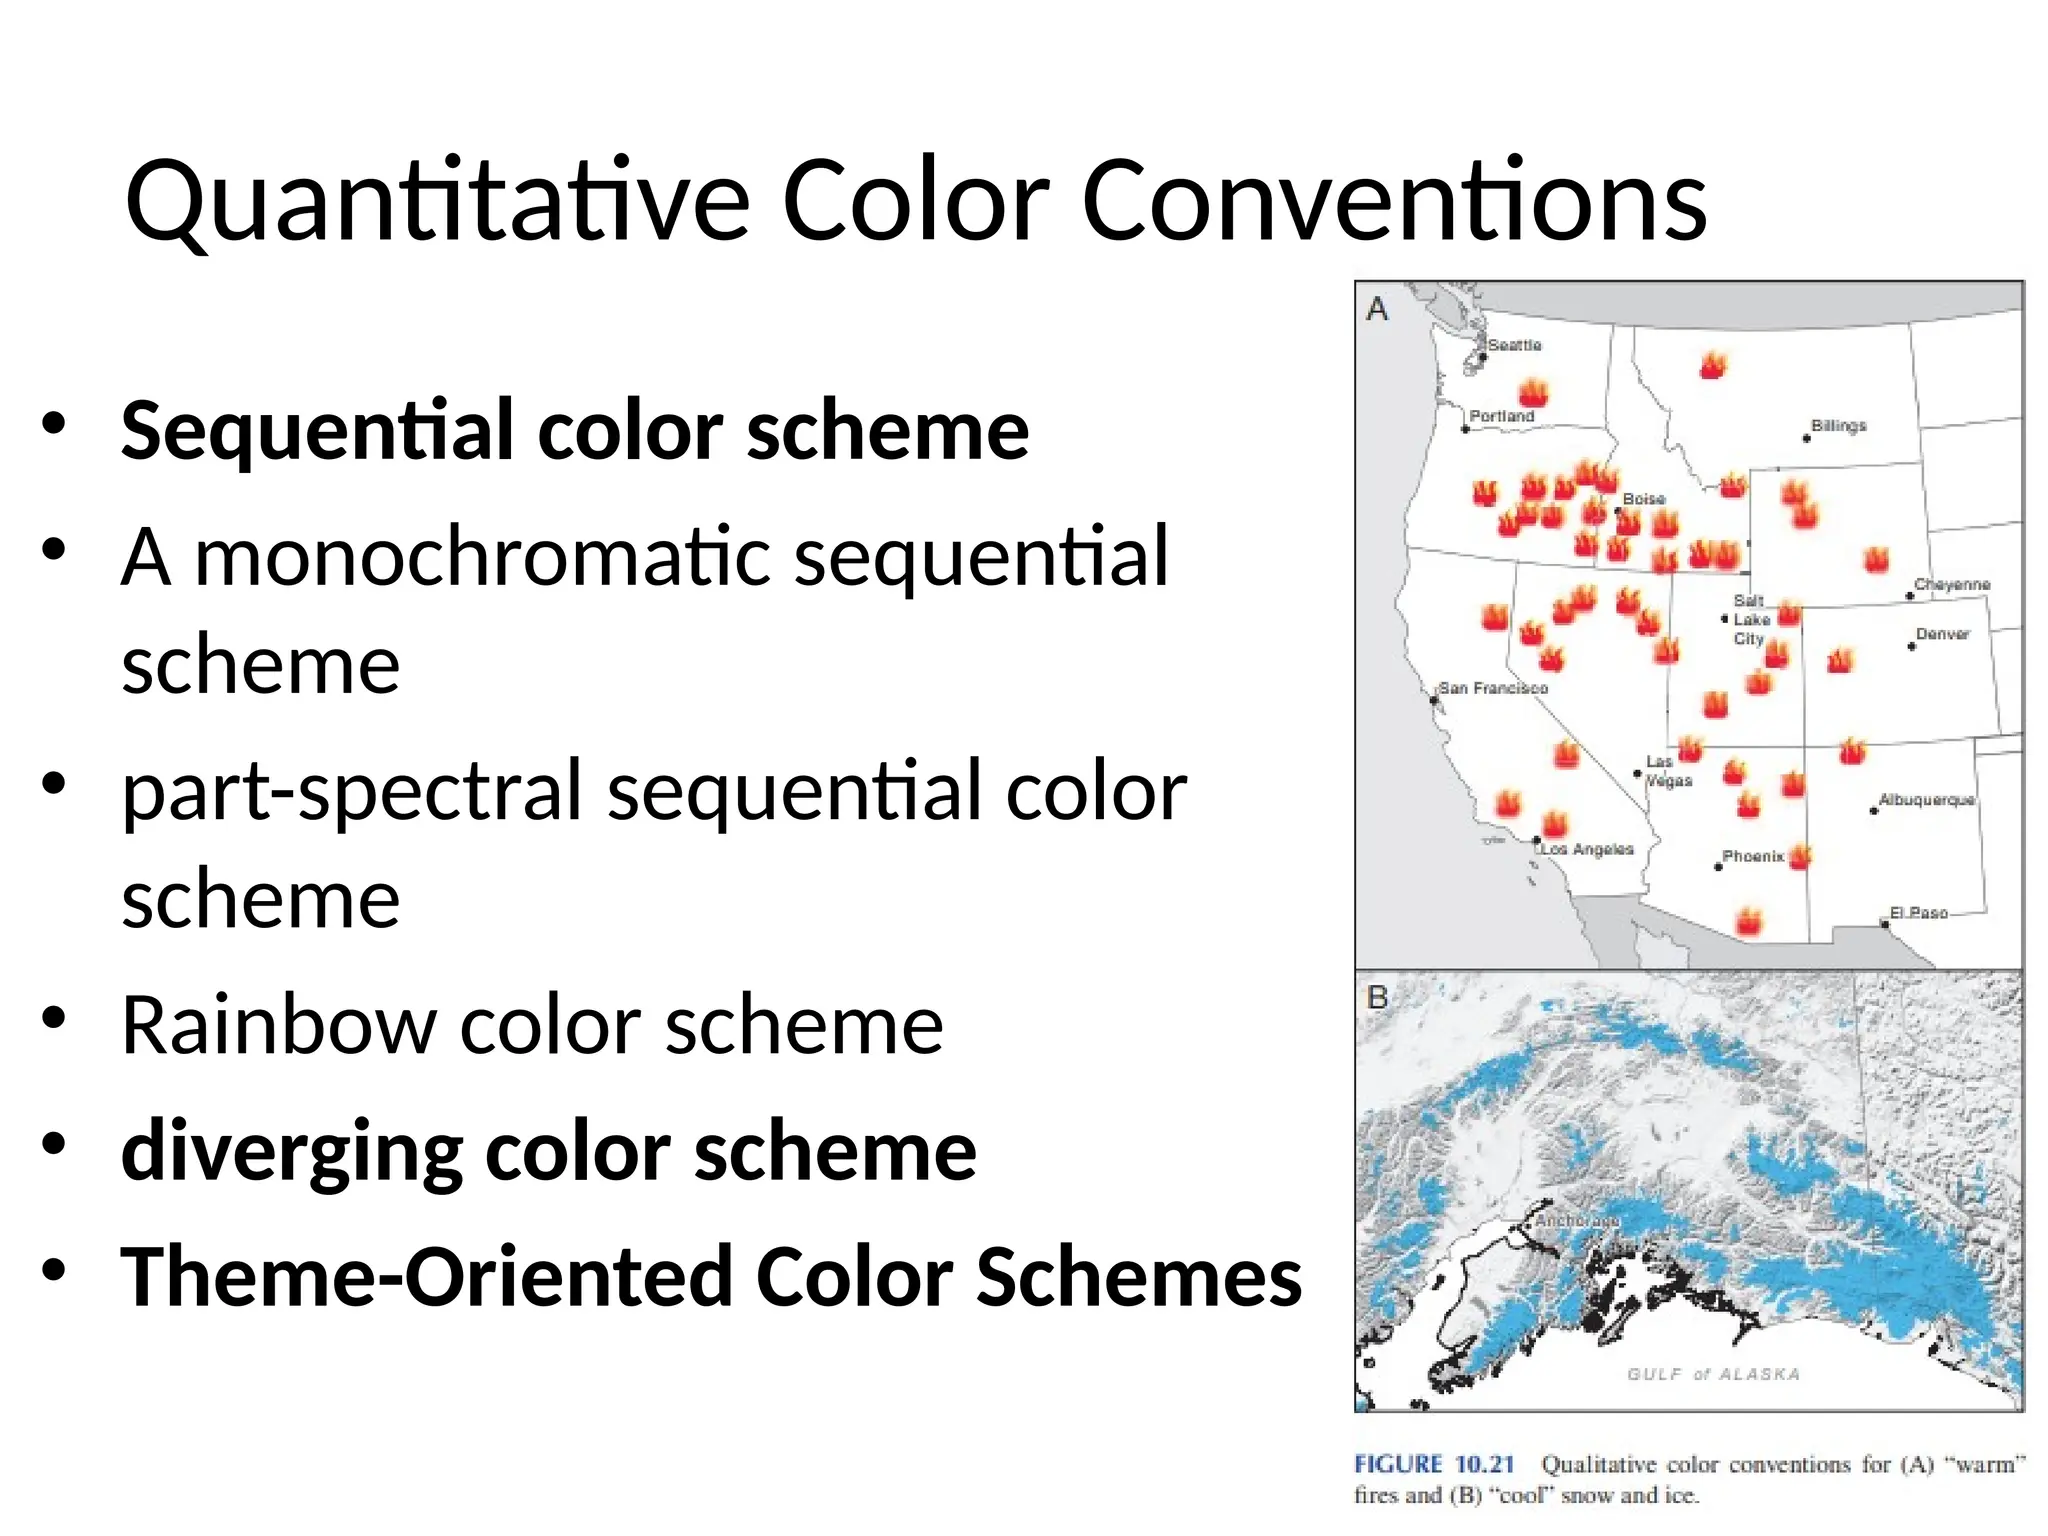
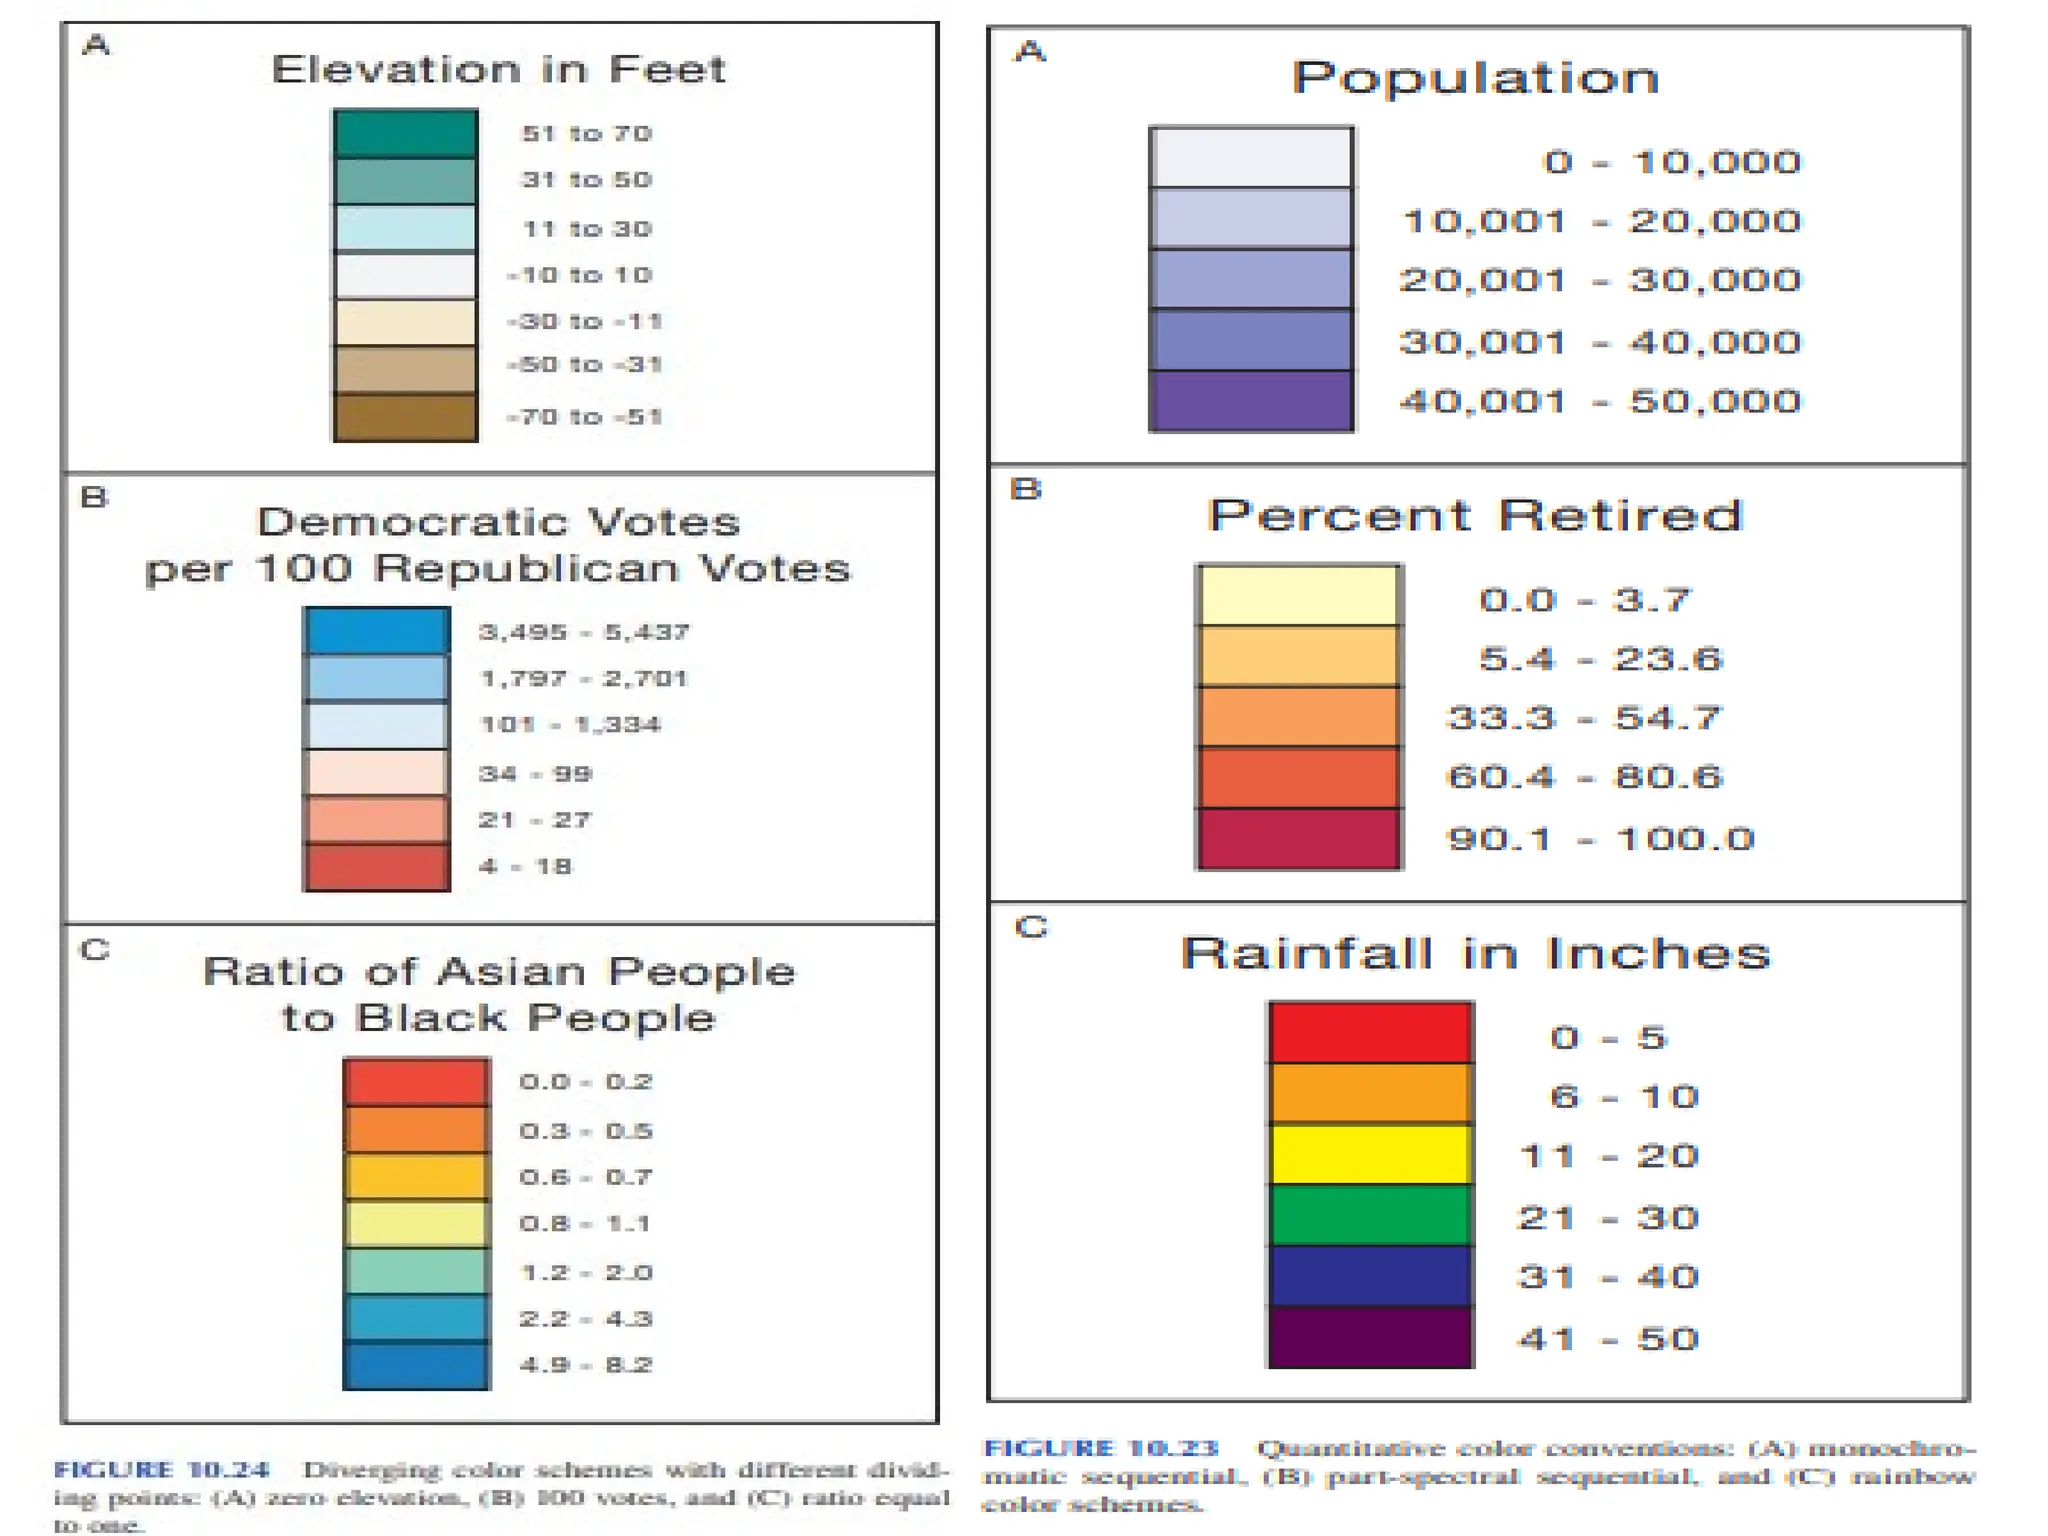
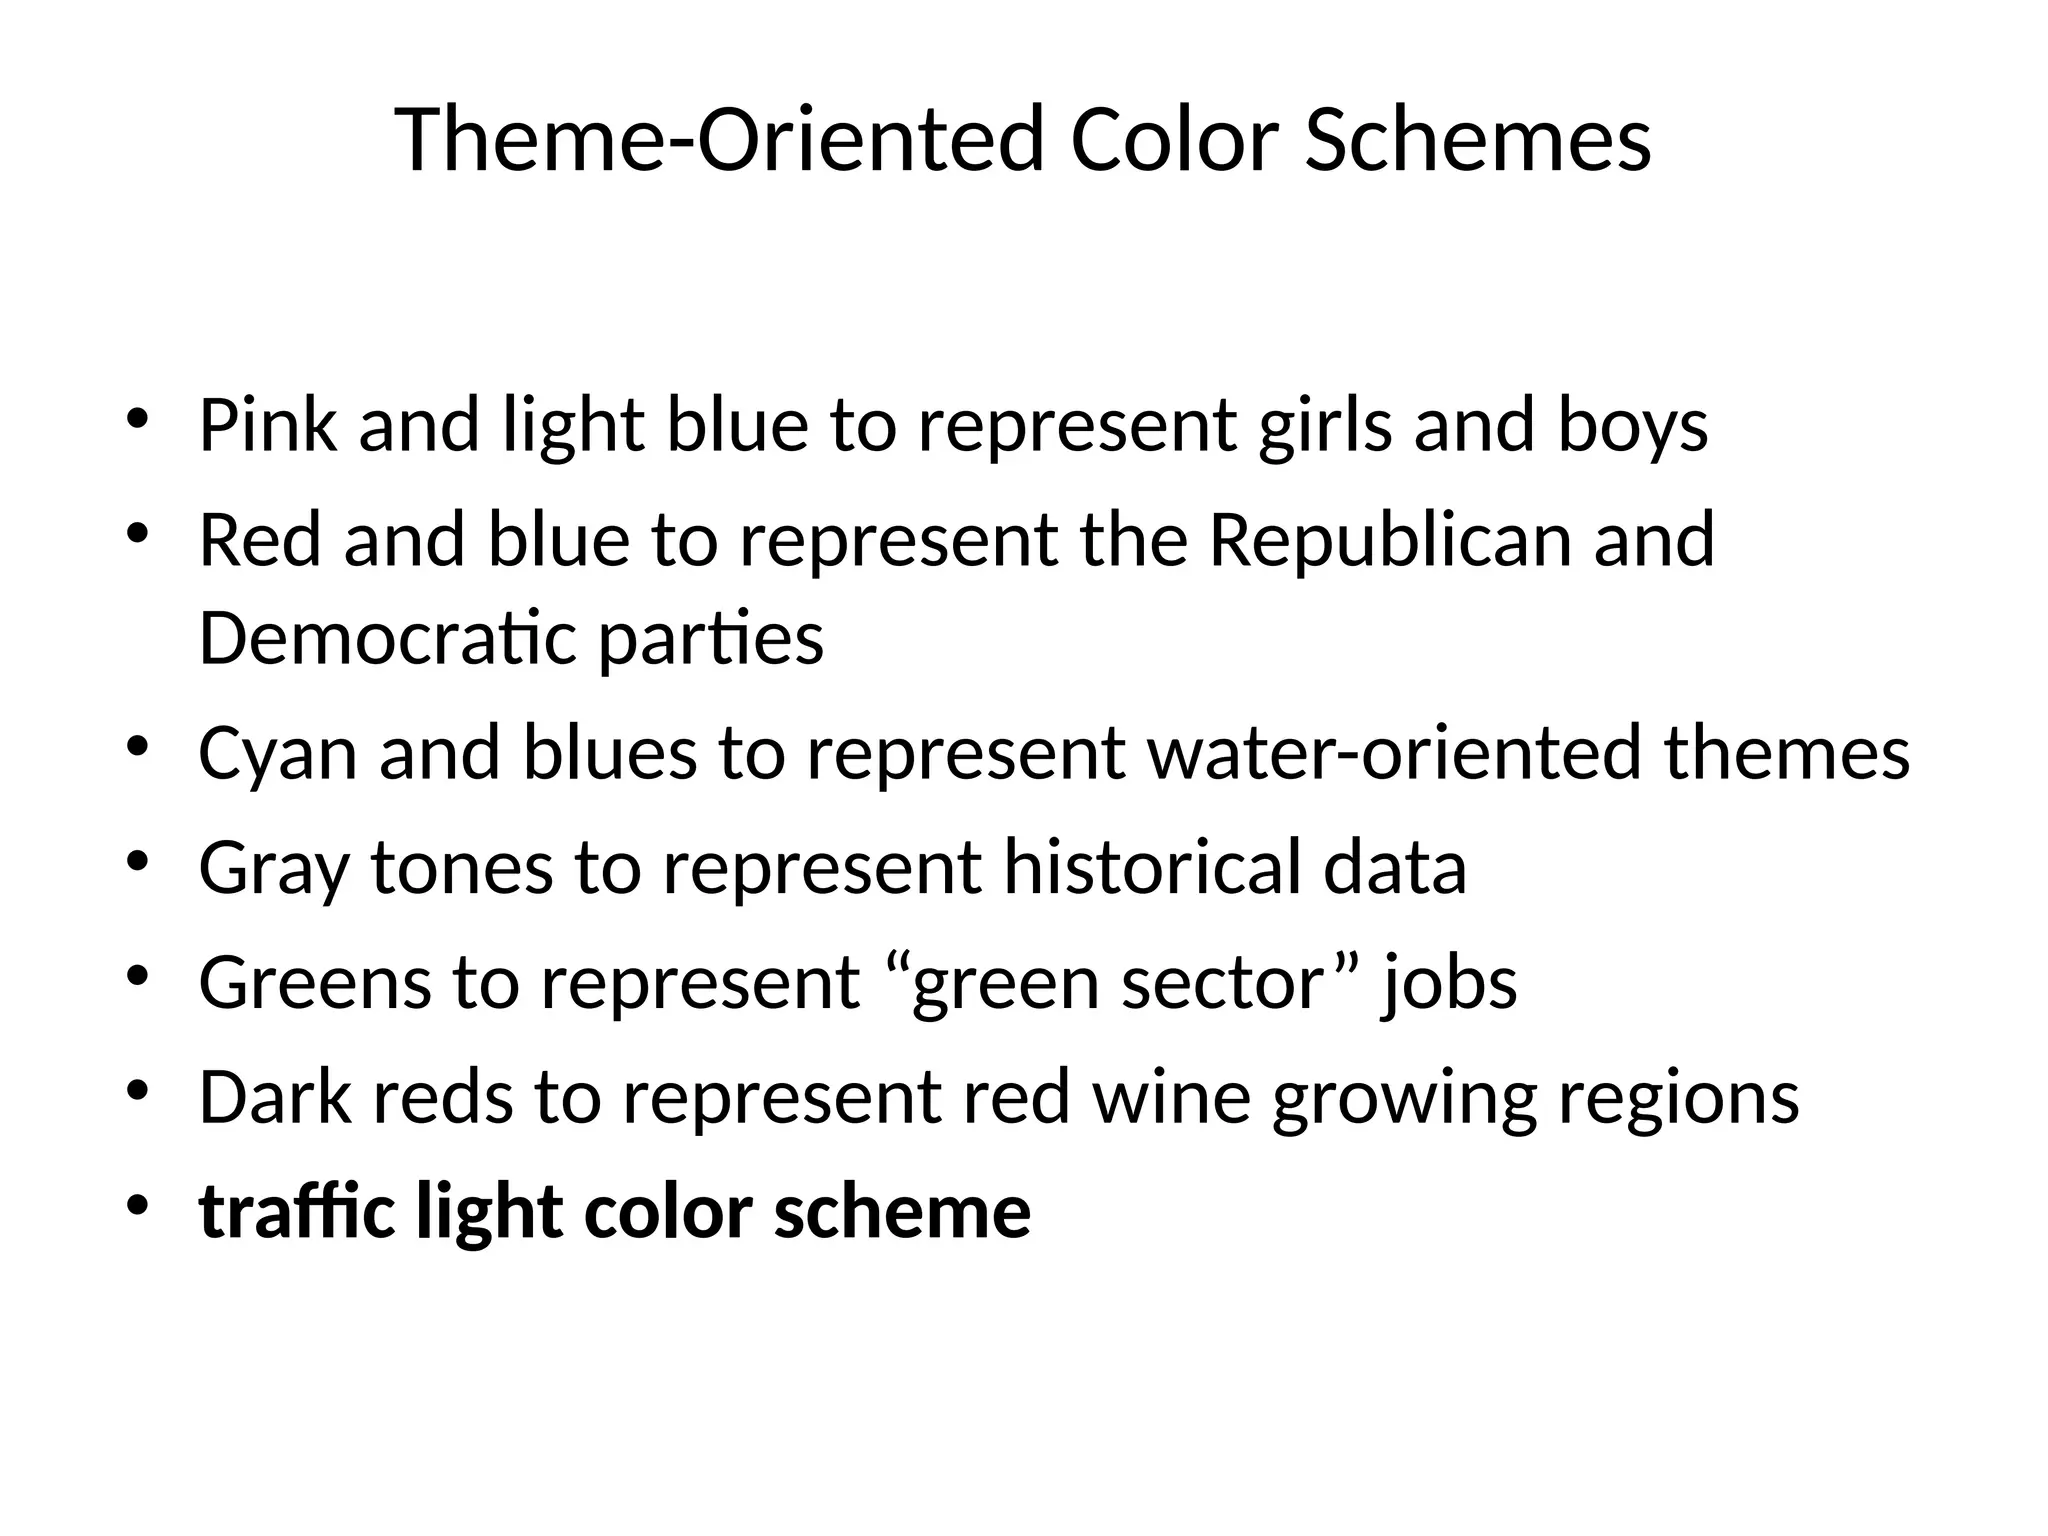
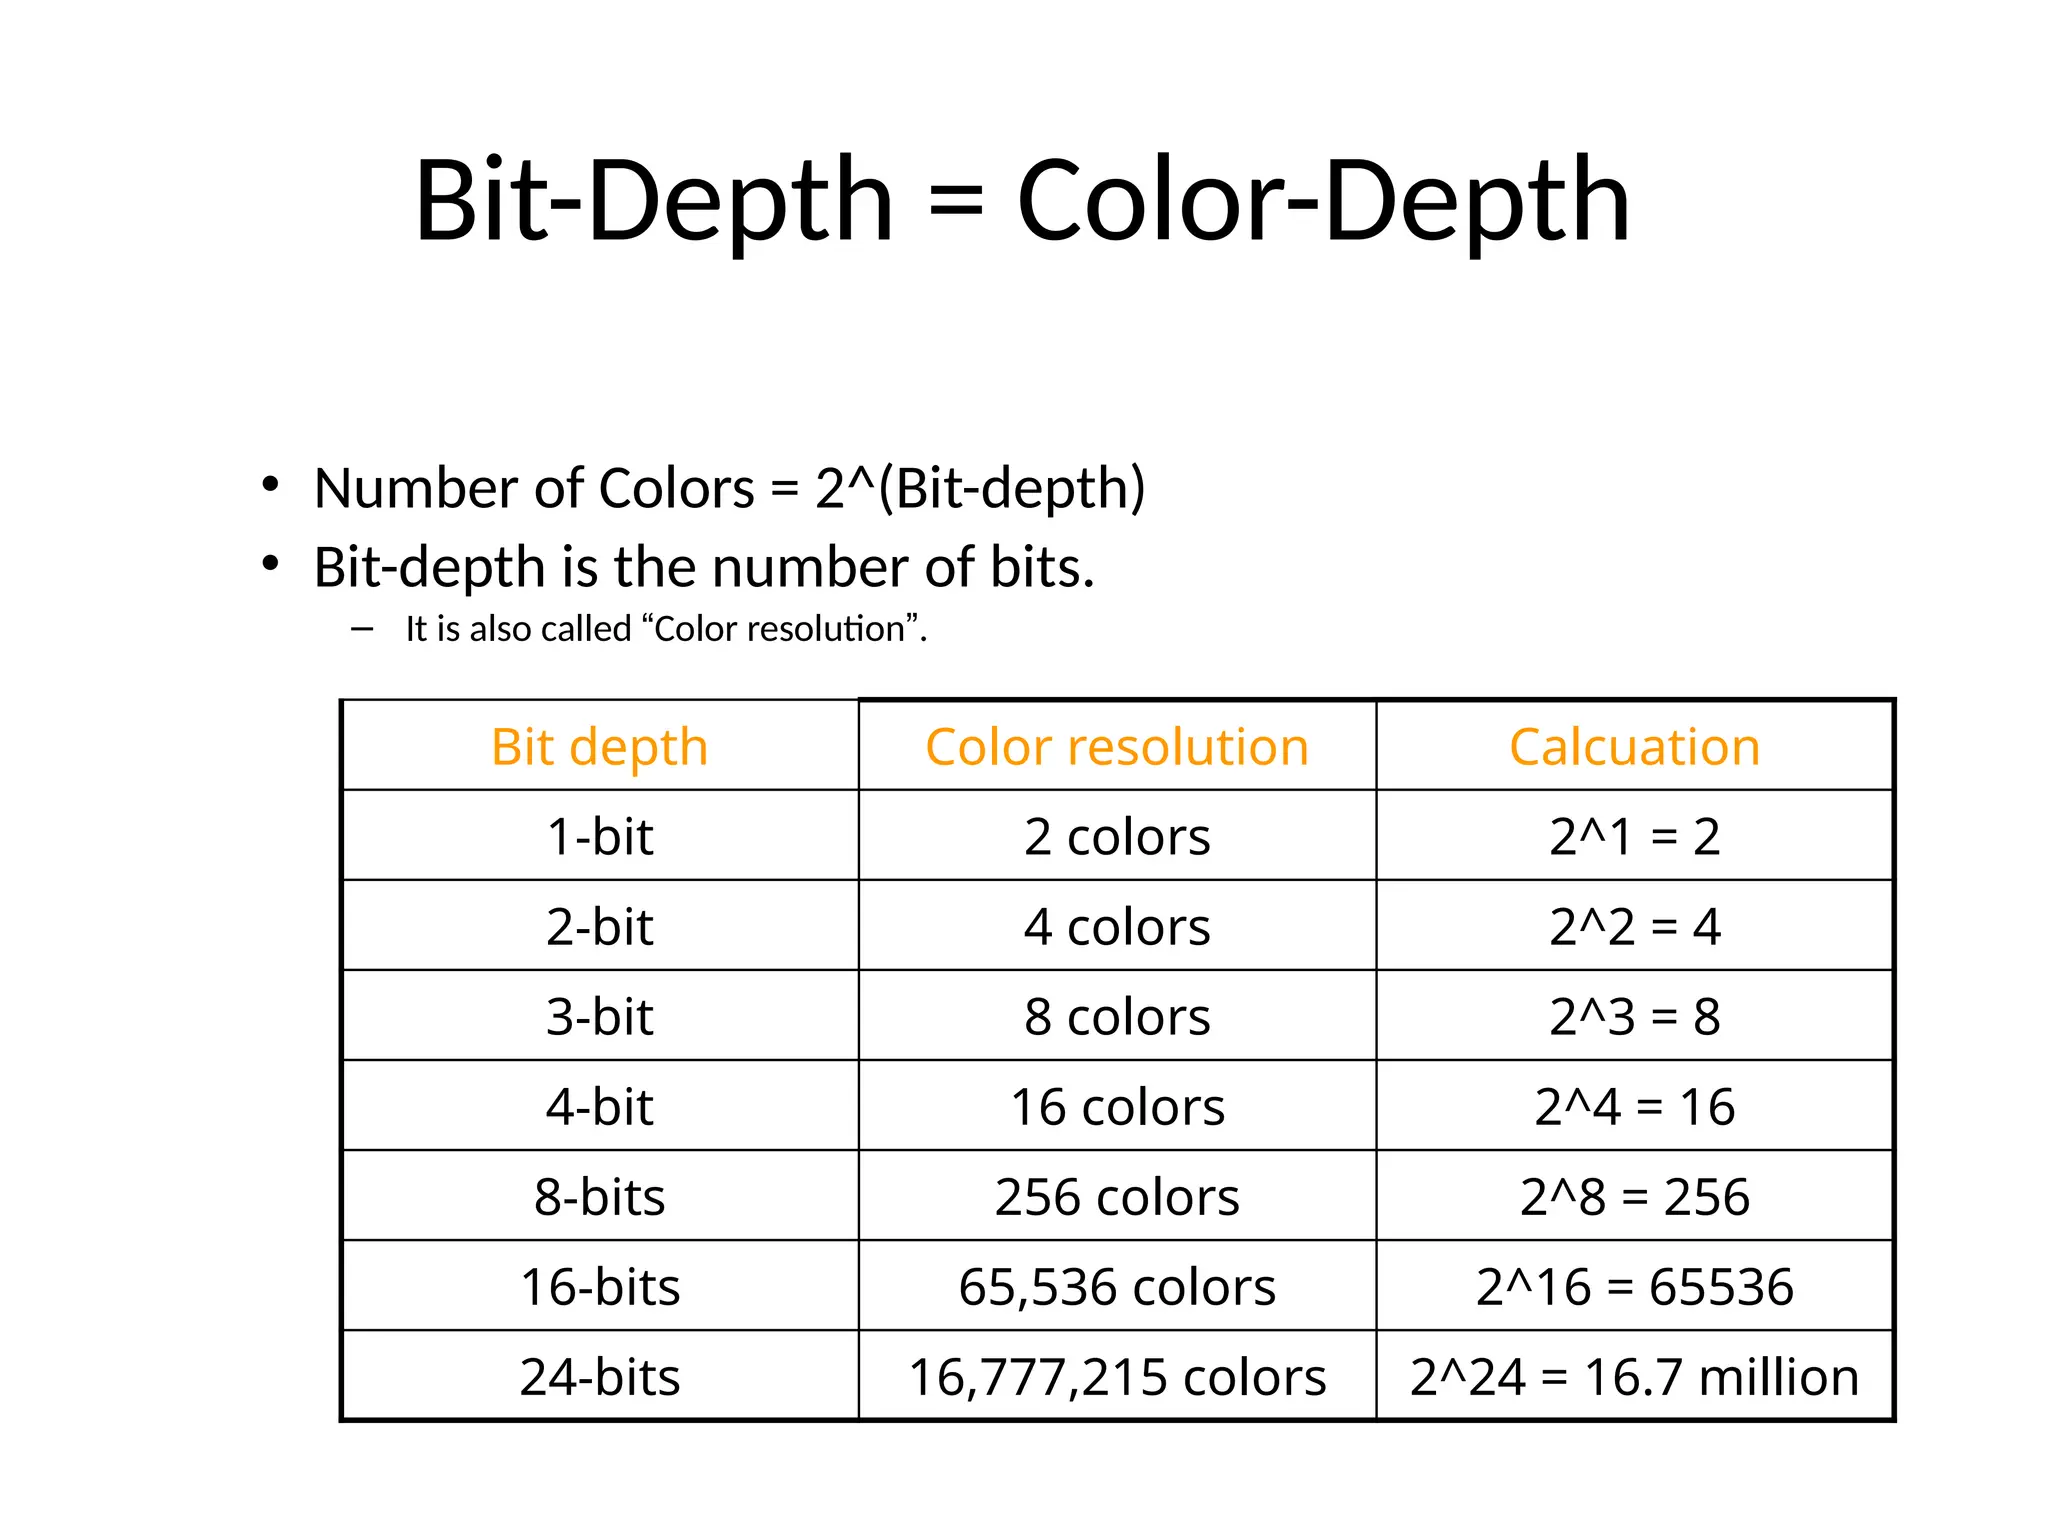
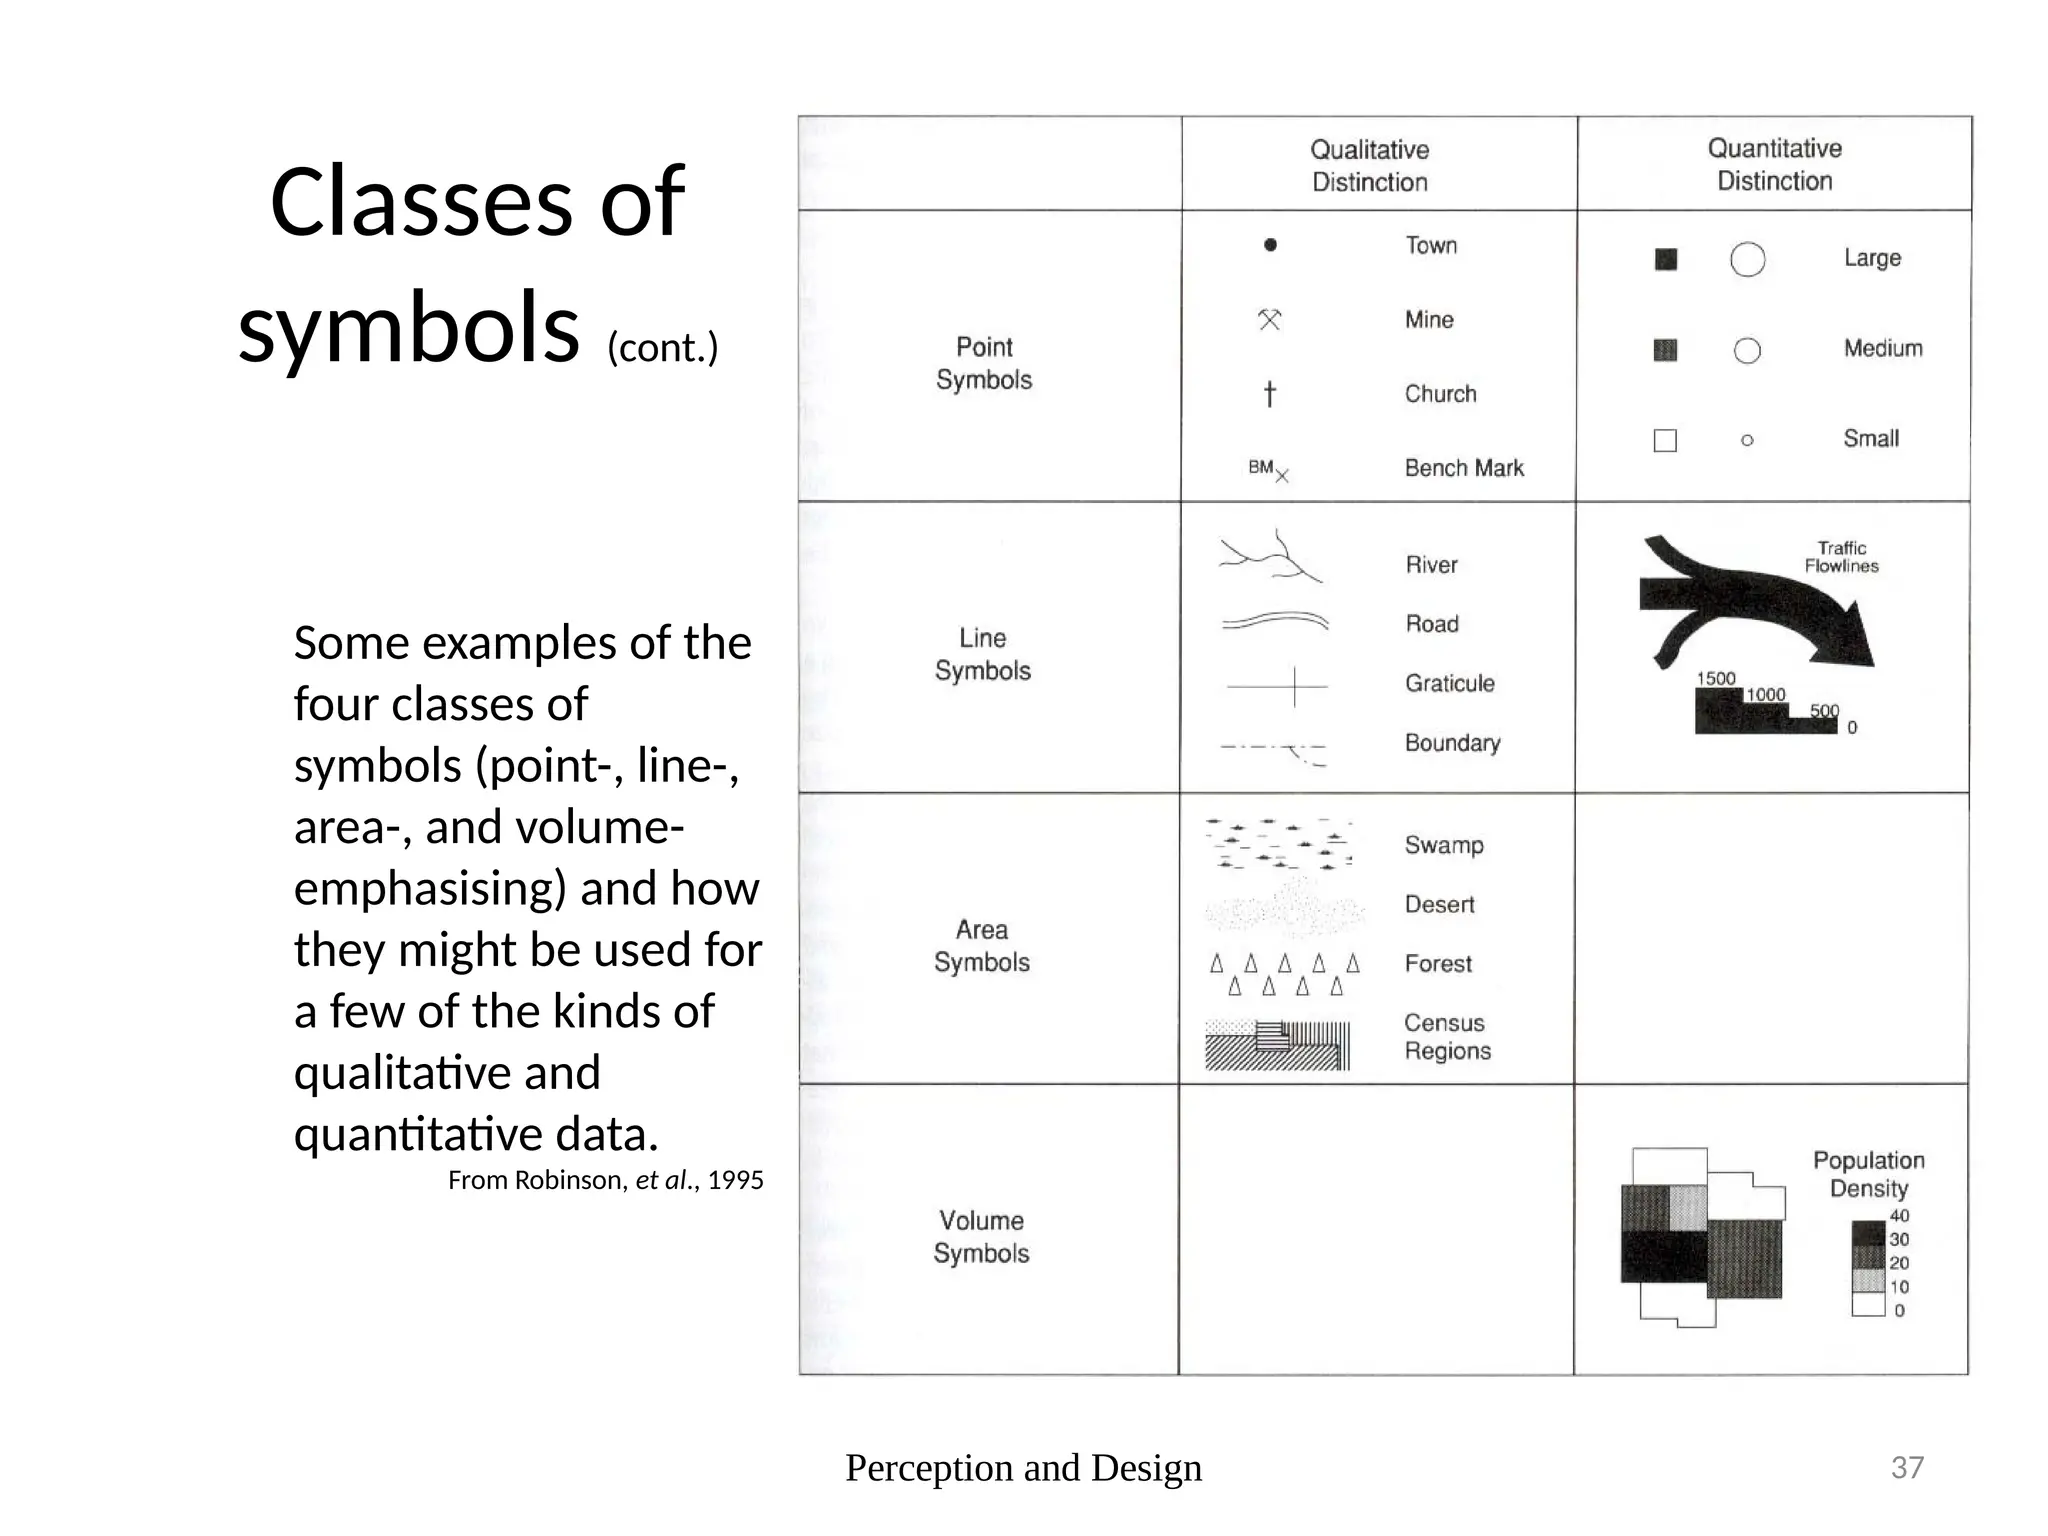
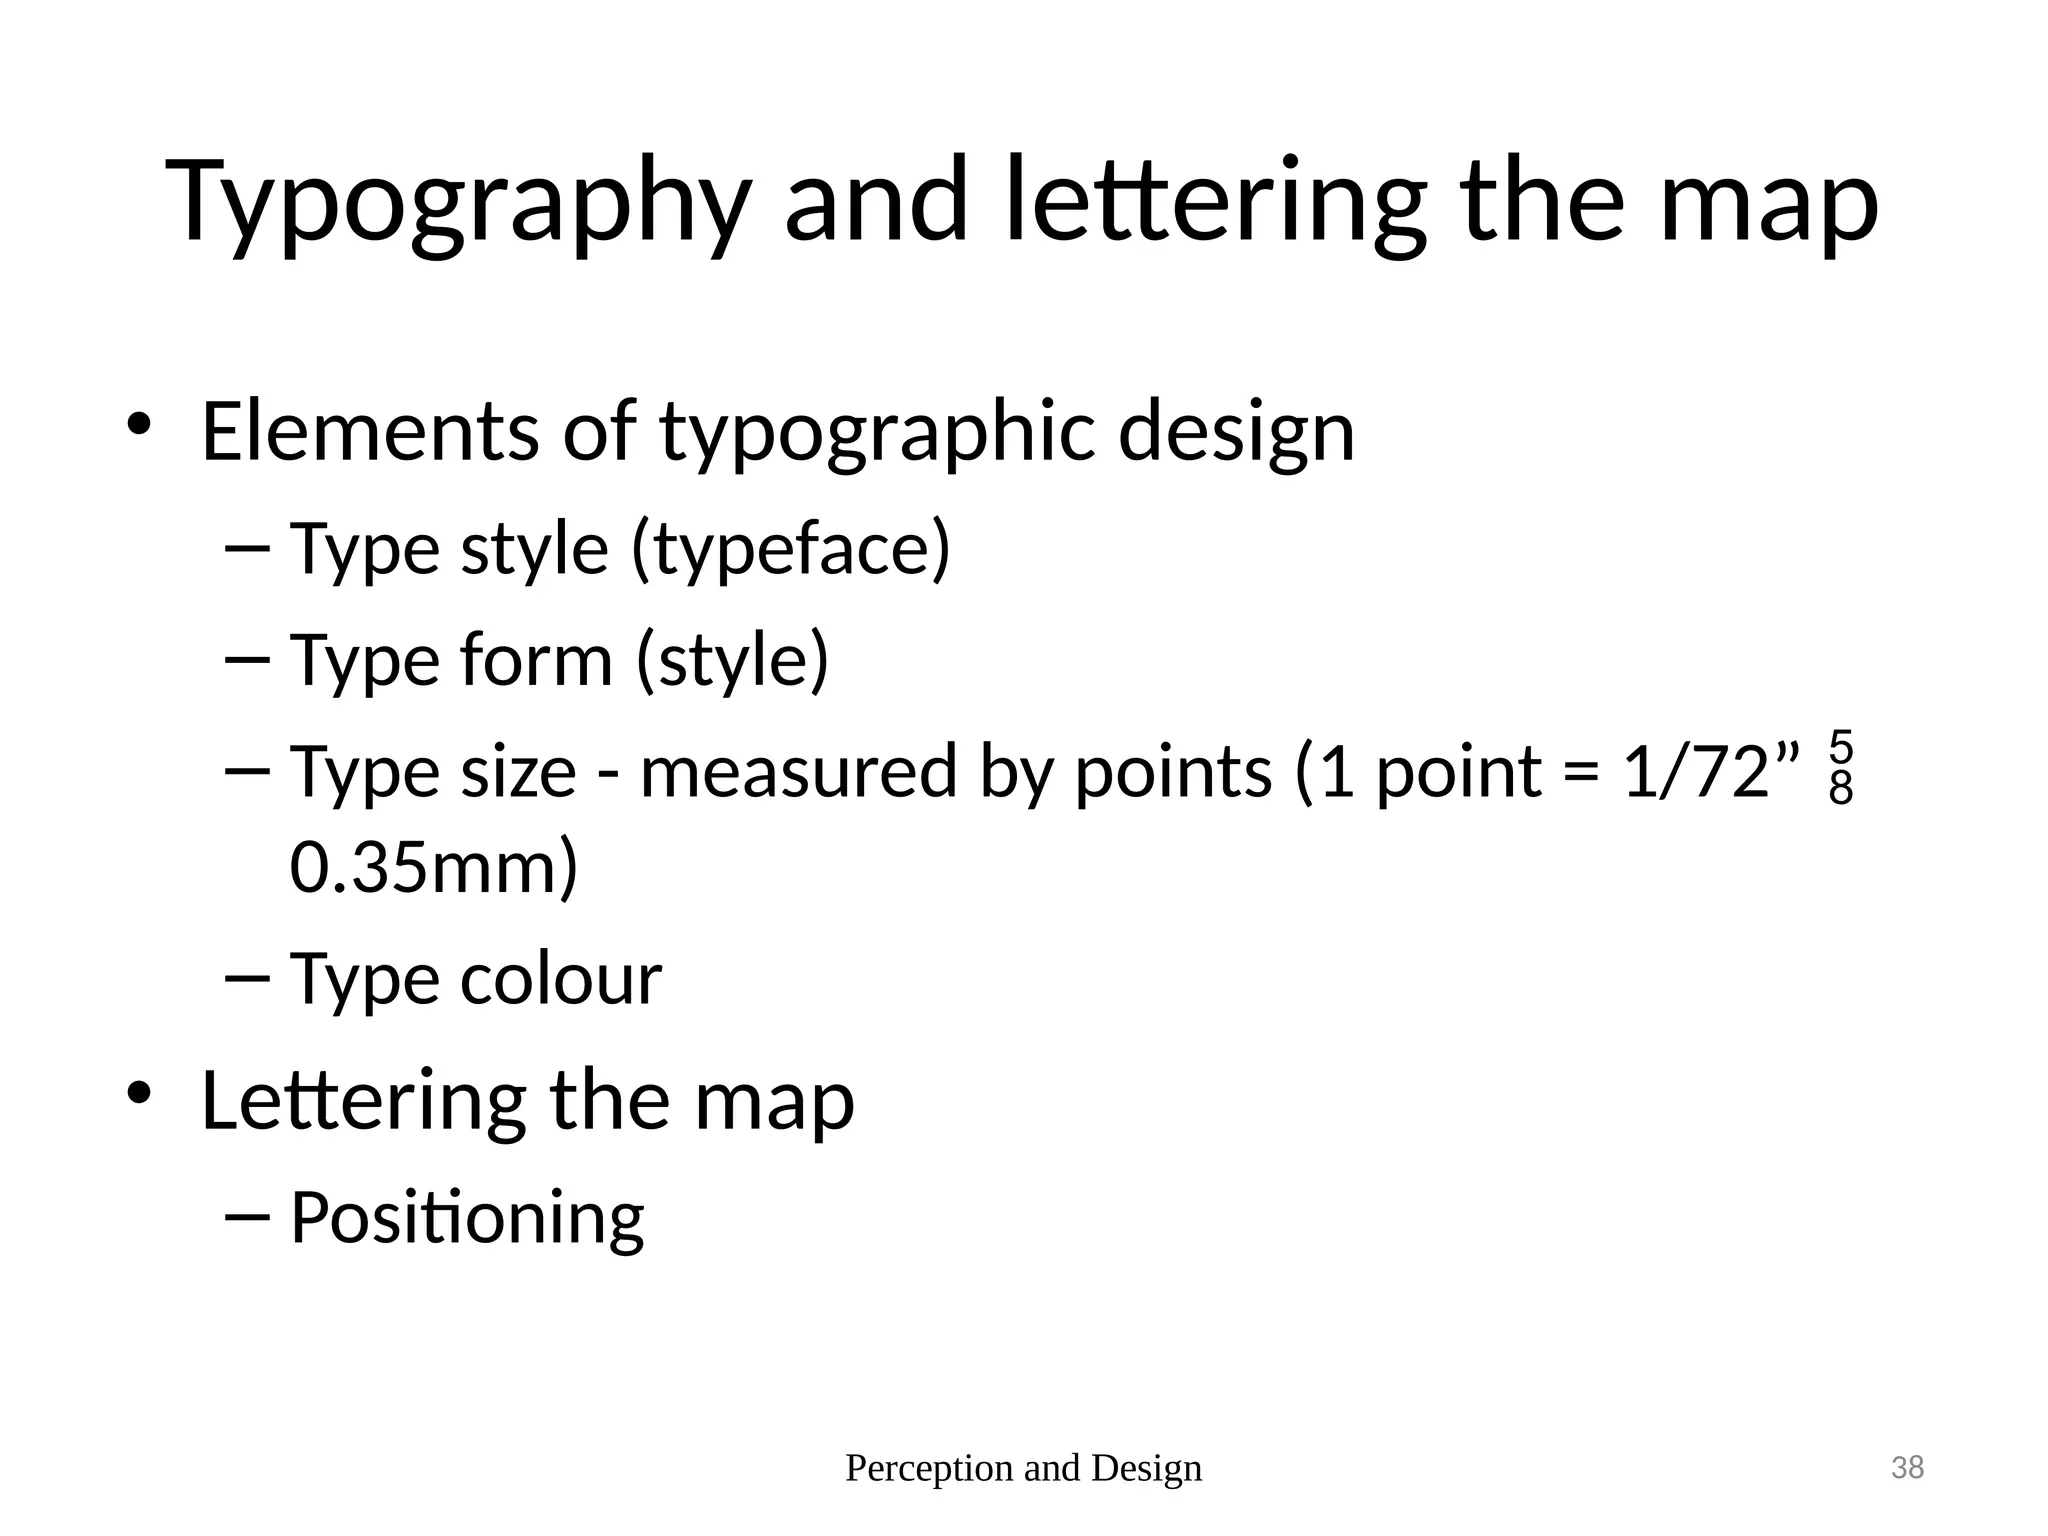
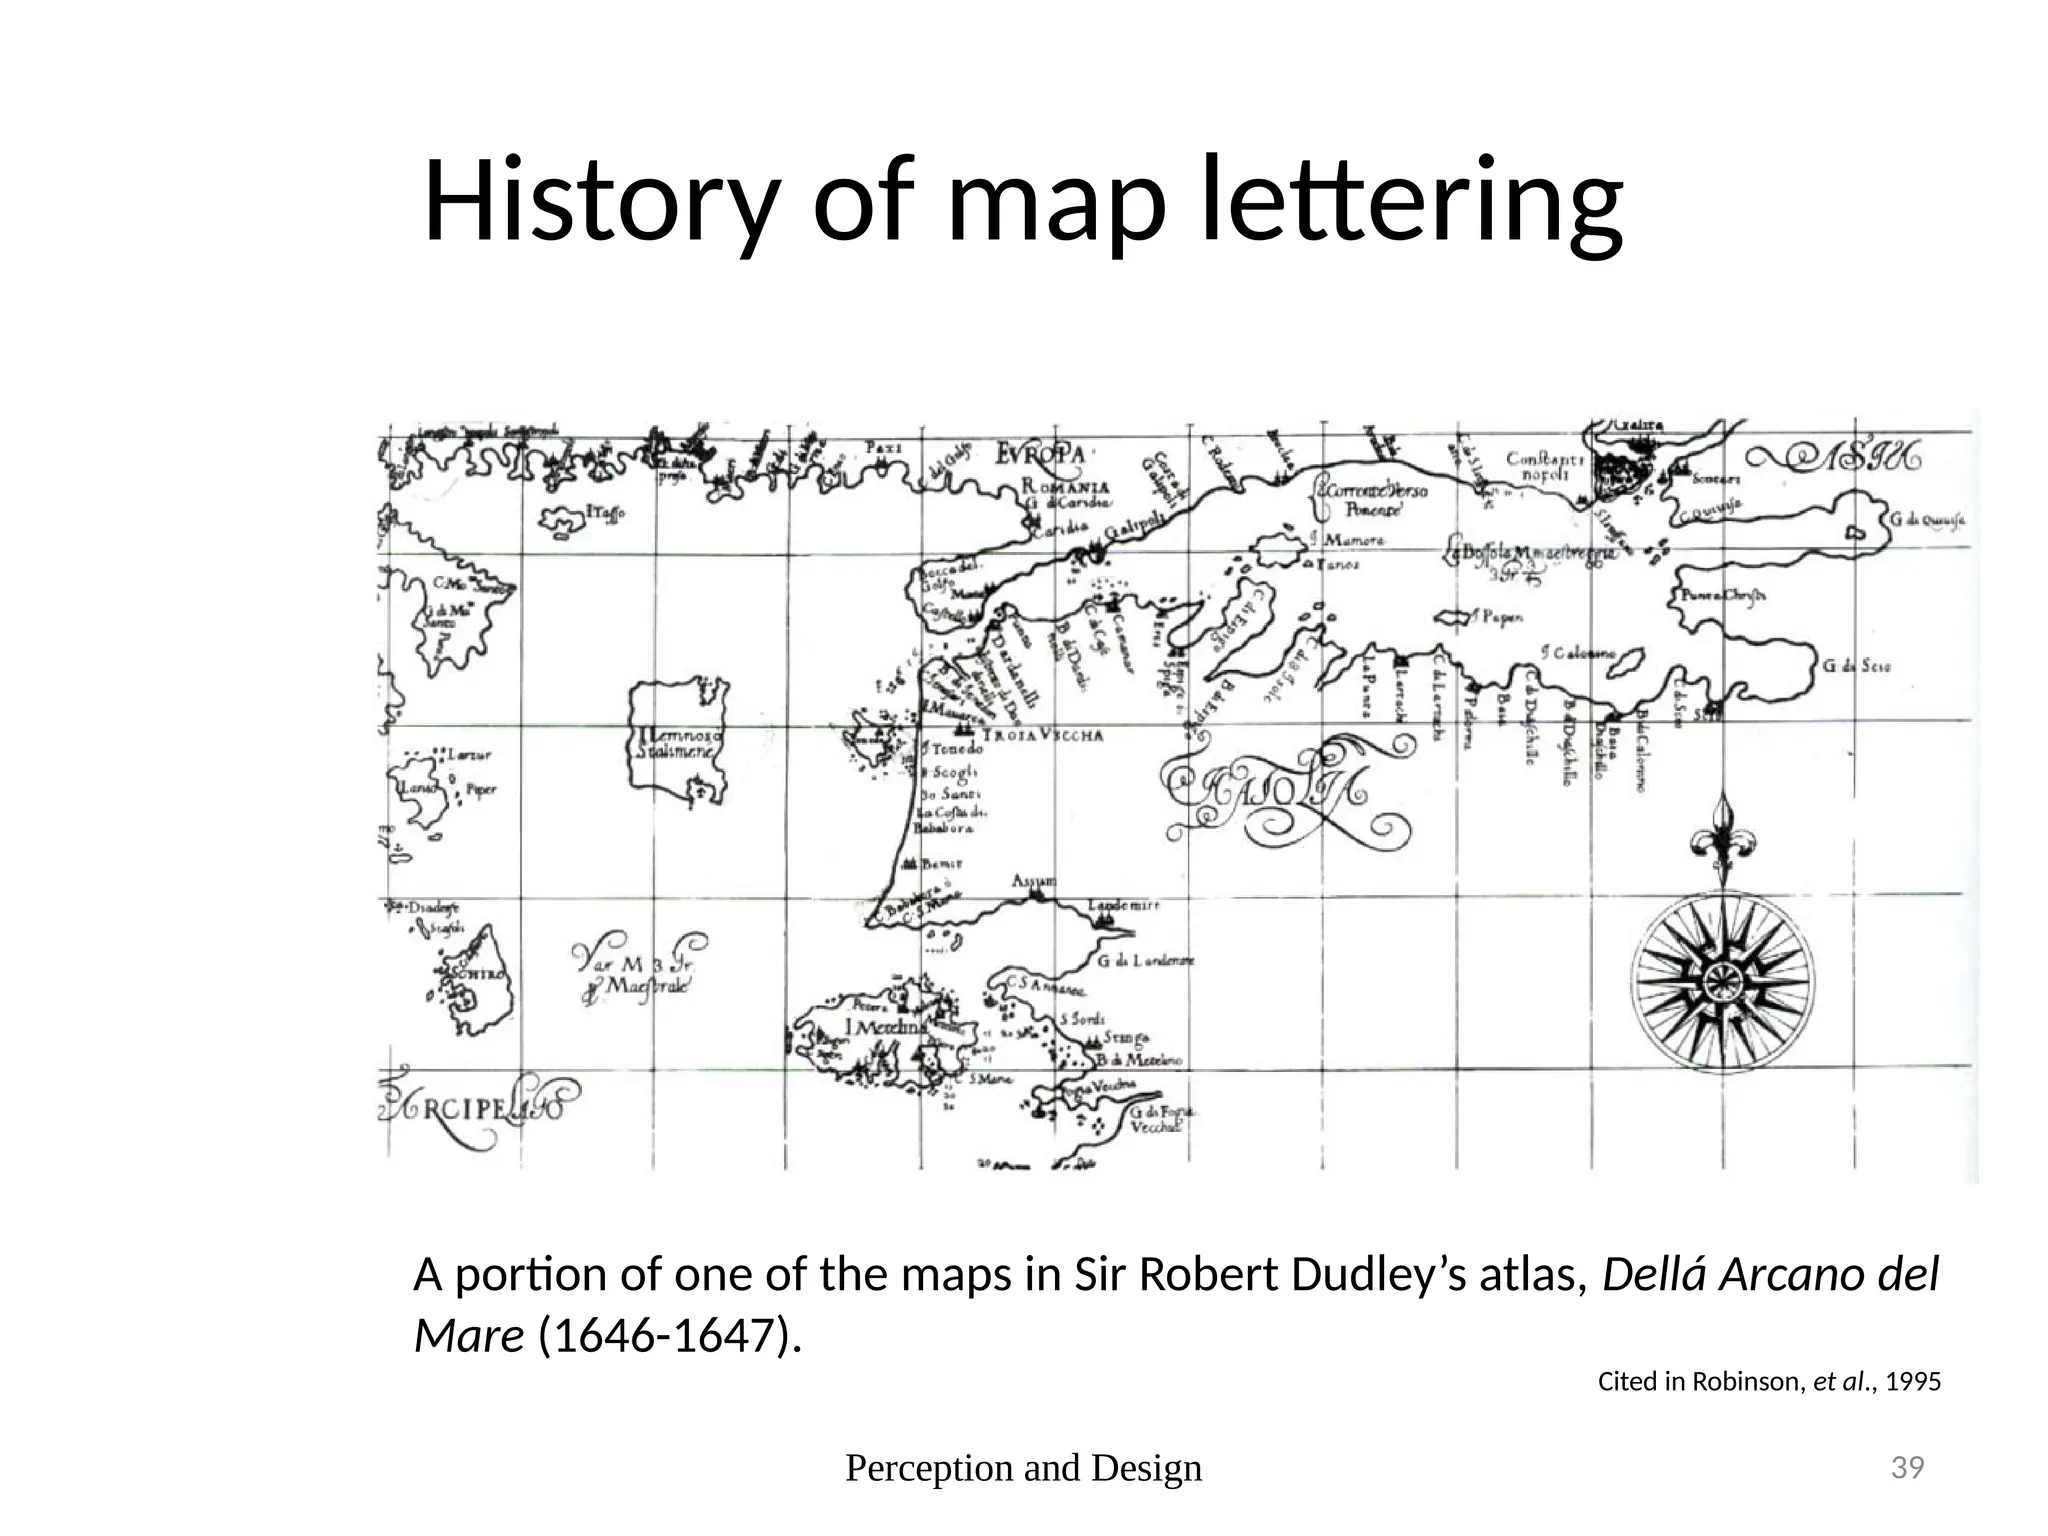
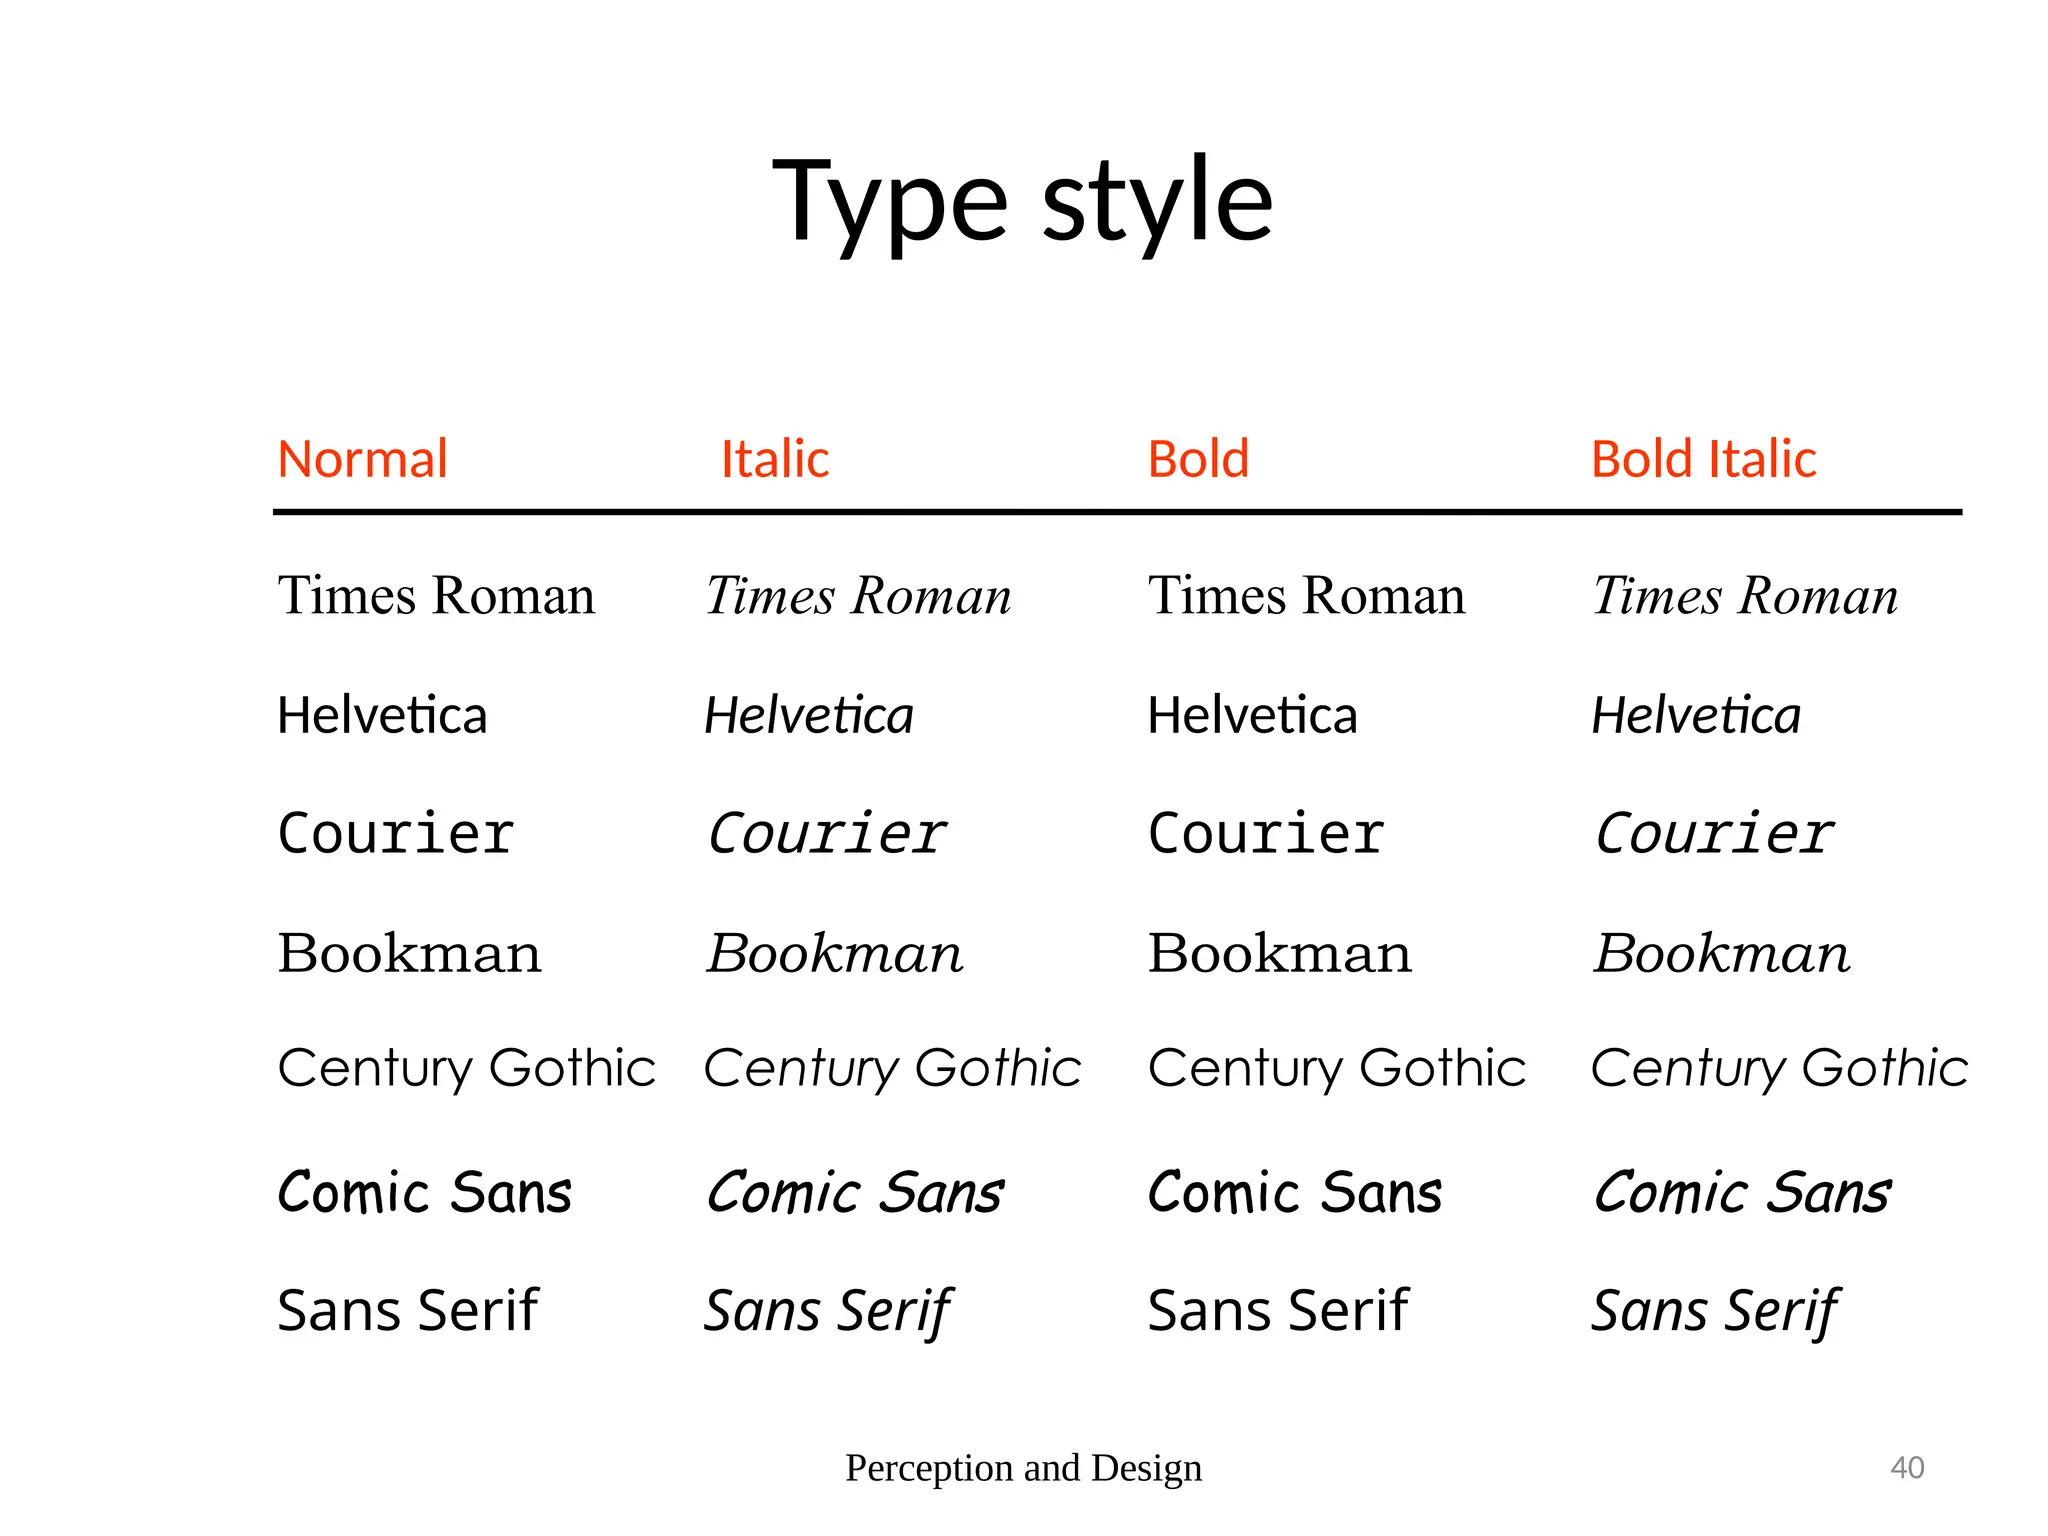
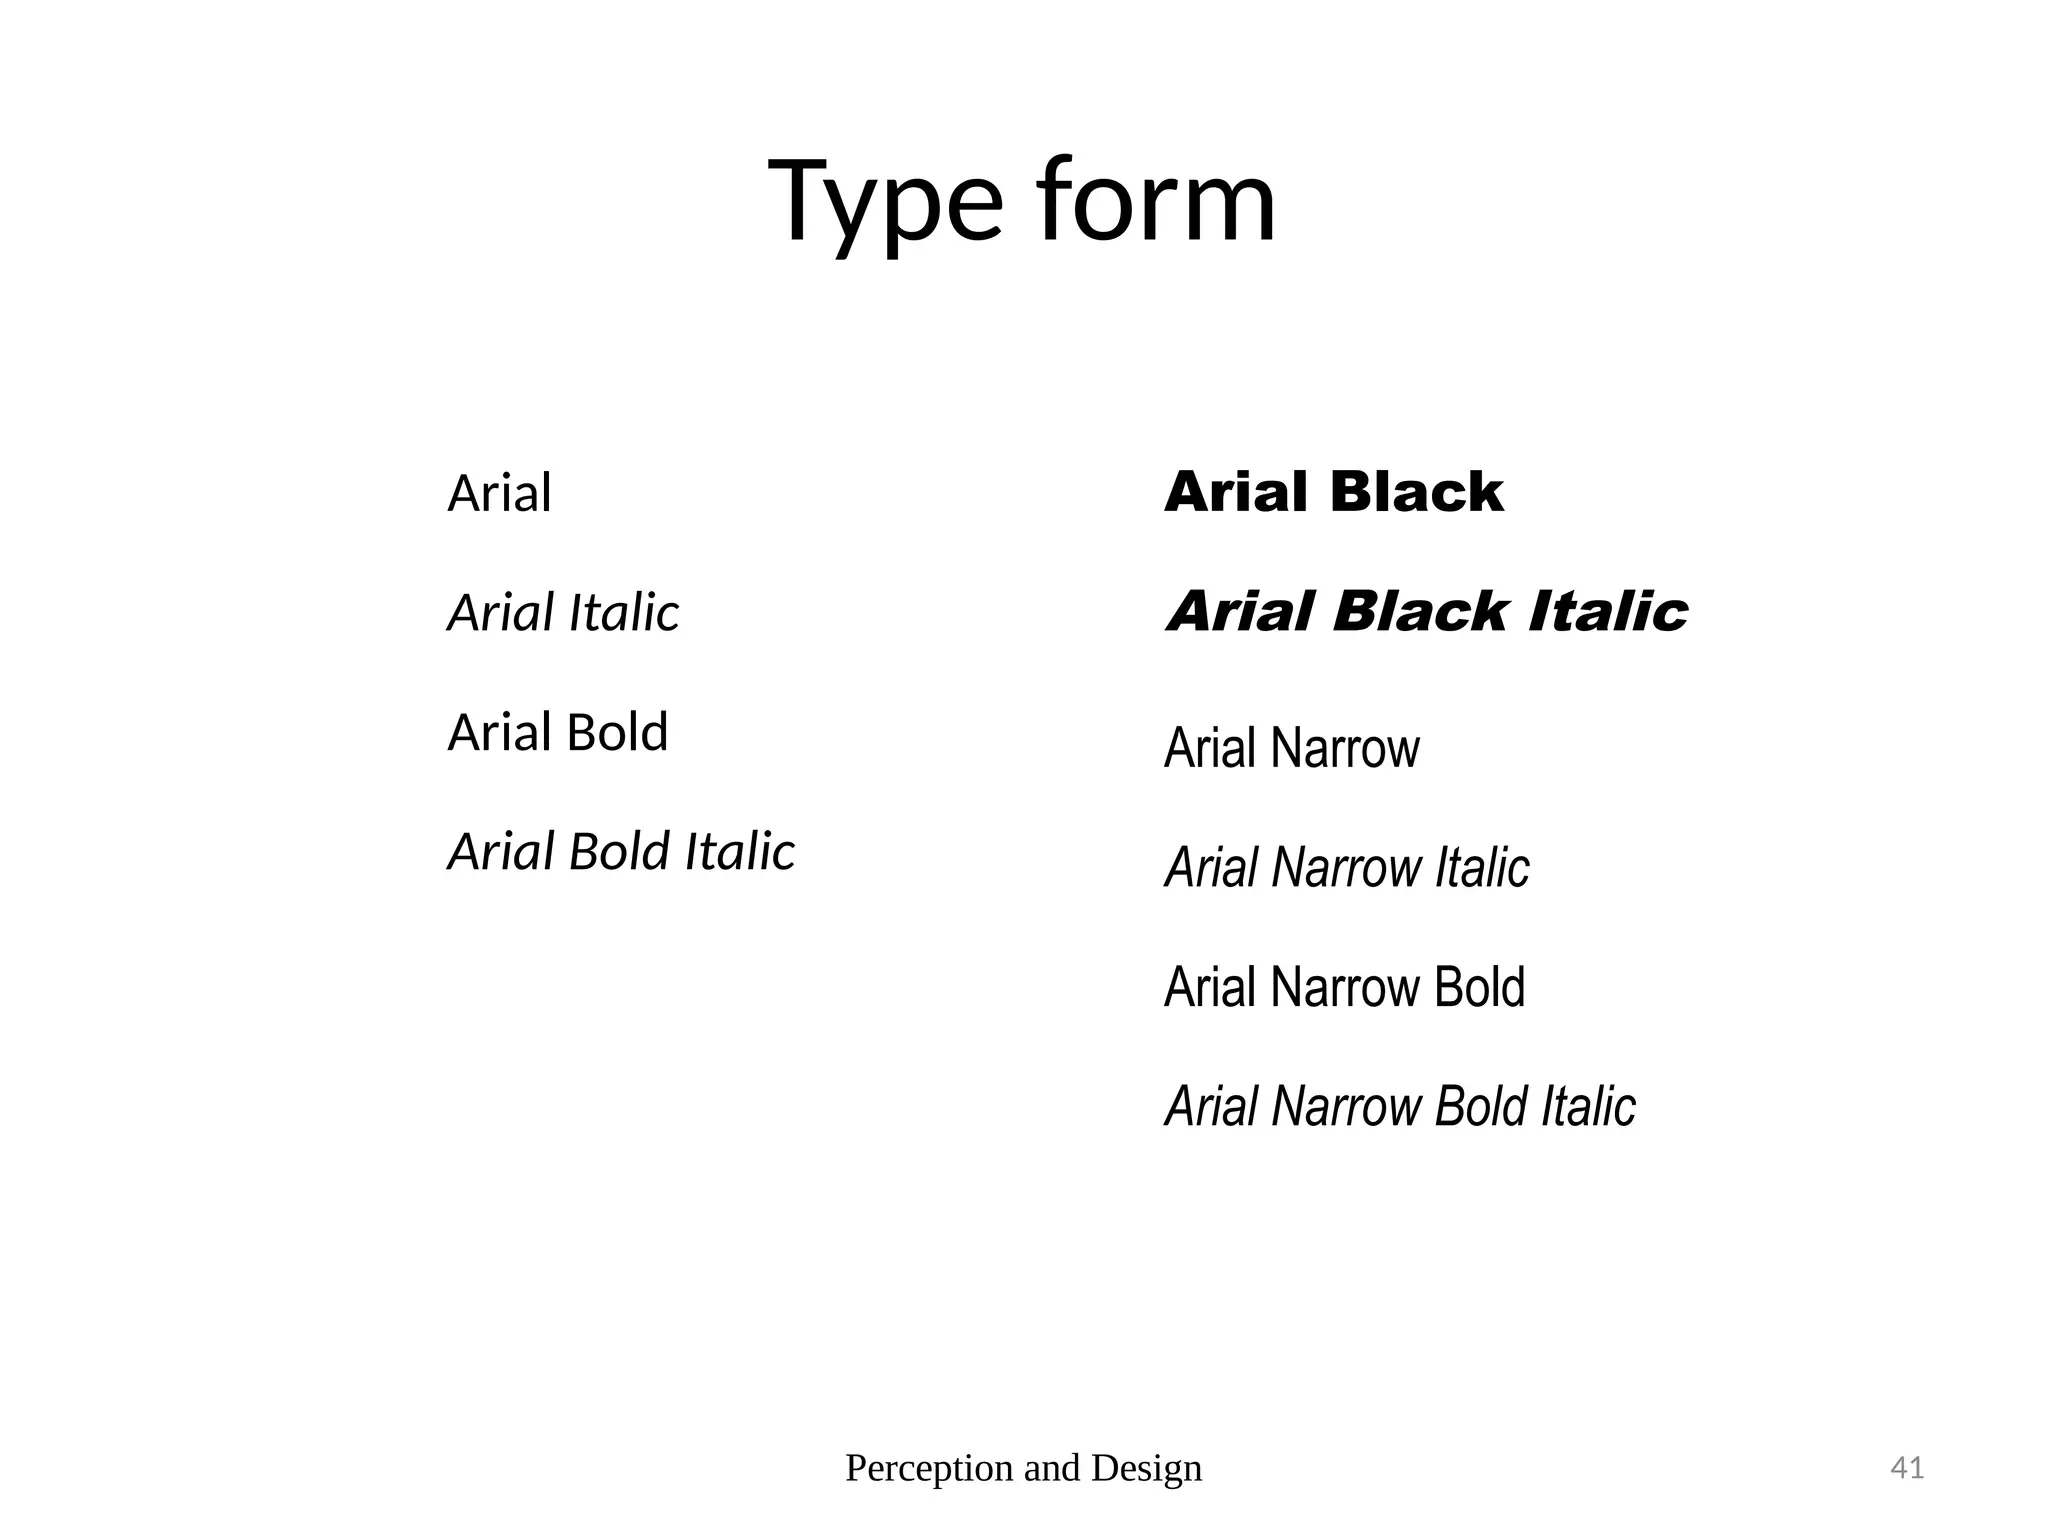
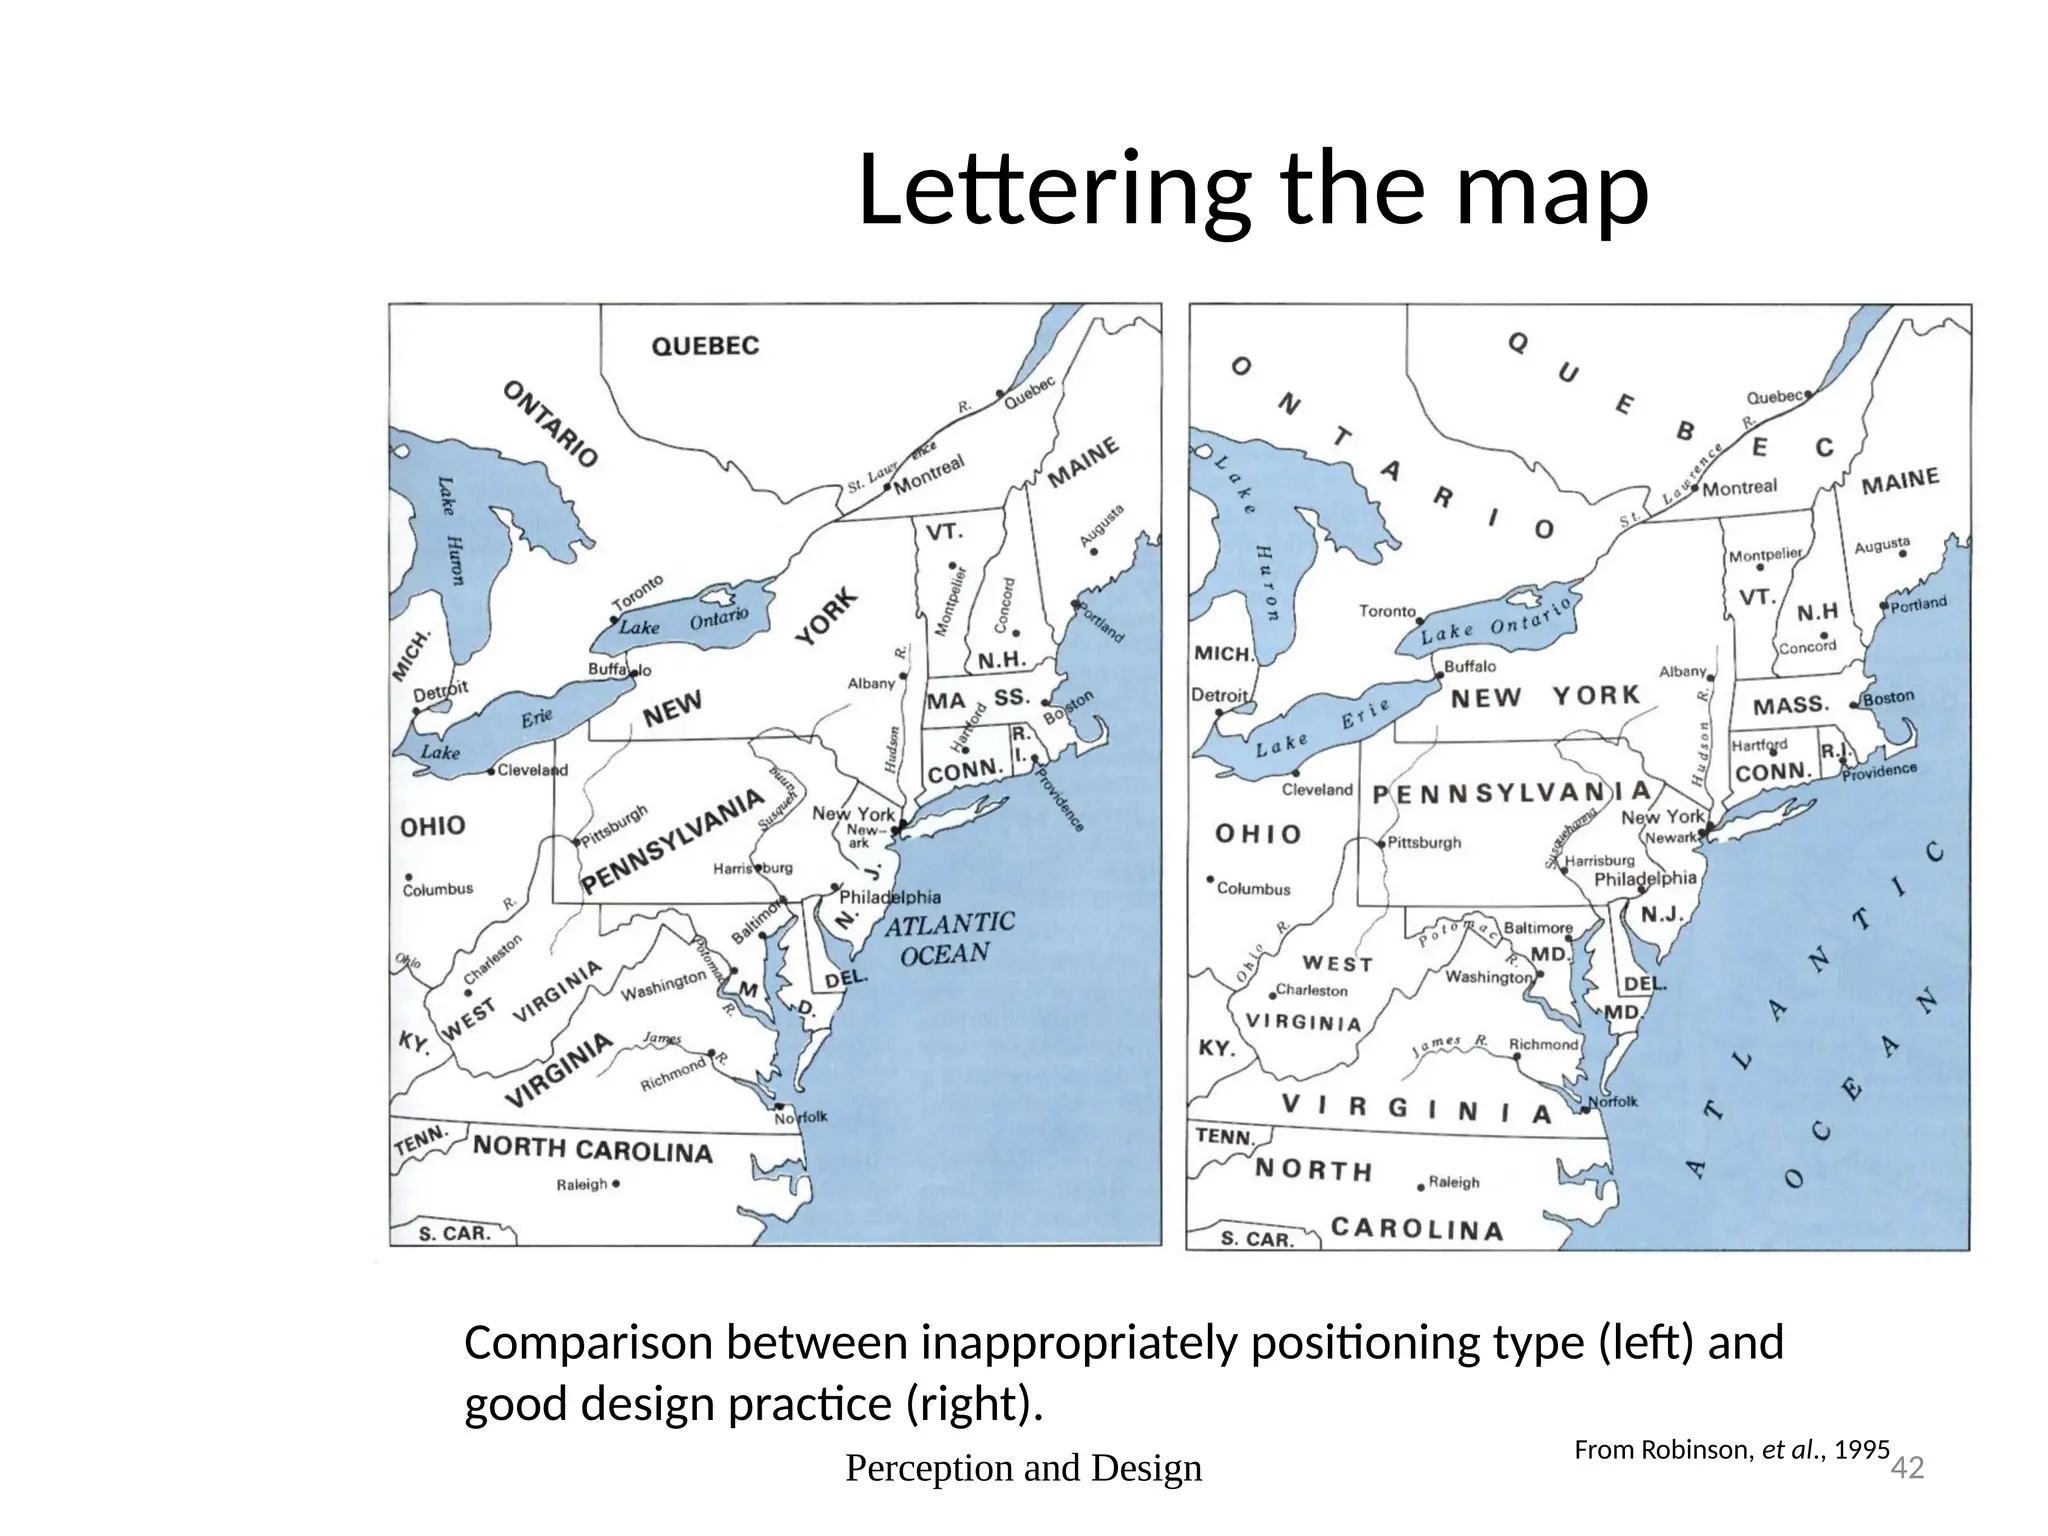
Colour
Colour
• It is defined as "an attribute of things that
results from the light they reflect, transmit, or
emit in so far as this light causes a visual
sensation that depends on its wavelengths“.
Electromagnetic spectrum
Primary Colours
• These colours are the three colours that can
not be created by mixing other colours. The
colours are red, blue and yellow.
Secondary Colours
• These colours consist of two primary colours
mixed together. The three colours secondary
colours are purple
red + blue = purple
red + yellow = orange
yellow + blue = green
Tertiary Colours
• These colours are made by mixing a primary colours with
an adjacent secondary colours.
yellow + orange = yellow-orange
red + orange = red-orange
red + purple (violet) = red-purple (red-violet)
blue + purple (violet) = blue-purple (blue-violet)
blue + green = blue-green
yellow + green = yellow-green
MODELS FOR SPECIFYING COLOR
Colour Models
• A COLOR MODEL is a specification of a color
coordinate system and the subset of visible
colors in this coordinate system.
The additive colour system
The
RGB
colour
model
The RGB colour model
The subtractive colour system
BGR G + R = Y
-B
BGR B + R = M
-G
BGR G
-B -R
Perception and Design 16
The Relation
between RGB
and CMY
The CMY colour model
C = 1 - R
M = 1 - G
Y = 1 - B
255,255,255
White
TERMINOLOGY AND PRINCIPLES IN
THE PRACTICAL USE OF COLOR
Color Wheel
Color wheels are graphical
devices that allow us to see
relationships between colors.
The colors in a color wheel can
be arranged in just about any
order, but they normally
follow a general progression
of hues as taken from the
visible portion of the
electromagnetic spectrum.
Terminologies
• Warm and Cool
• Complementary and Harmonious Colors
• Tints, Shades, and Tones
• Qualitative Color Conventions
• Quantitative Color Conventions
Qualitative Color Conventions
A color convention is a method of using a
color that is commonly used and which is
typically successful when symbolizing certain
types of map features in particular situations.
Quantitative Color Conventions
• Sequential color scheme
• A monochromatic sequential
scheme
• part-spectral sequential color
scheme
• Rainbow color scheme
• diverging color scheme
• Theme-Oriented Color Schemes
Theme-Oriented Color Schemes
• Pink and light blue to represent girls and boys
• Red and blue to represent the Republican and
Democratic parties
• Cyan and blues to represent water-oriented themes
• Gray tones to represent historical data
• Greens to represent “green sector” jobs
• Dark reds to represent red wine growing regions
• traffic light color scheme
Bitmap
• Number of Colors = 2^(Bit-depth)
• Bit-depth is the number of bits.
– It is also called “Color resolution”.
Bit-Depth = Color-Depth
Bit depth Color resolution Calcuation
1-bit 2 colors 2^1 = 2
2-bit 4 colors 2^2 = 4
3-bit 8 colors 2^3 = 8
4-bit 16 colors 2^4 = 16
8-bits 256 colors 2^8 = 256
16-bits 65,536 colors 2^16 = 65536
24-bits 16,777,215 colors 2^24 = 16.7 million
Perception and Design 29
Patterns
• Commonly used as a qualitative area symbol
for depicting area features.
• Also used to add graphic distinctiveness to
uniformly coloured areas, especially on maps
with a large number of classes.
Perception and Design 30
Categories of patterns
• Coarse line patterns
• Dot patterns
• Pictographic patterns
• Reversed patterns
31
Categories of patterns
Use of patterns
A simple monochrome map contrasting the use of parallel line and
dot patterns. Line patterns are perceptually unstable, and all but
the finest textures should be used with caution.
Perception and Design 33
Visual variables
• Primary visual variables
– Shape
– Size
– Orientation
– Hue (colour)
– Value (colour)
– chroma (colour)
• Secondary visual variables
– Arrangement (pattern)
– Texture (pattern)
– Orientation (pattern)
Perception and Design 34
Primary visual variables
The primary visual
variables with
some examples of
their simple
application to the
classes of symbols.
From Robinson, et al., 1995
Perception and Design 35
Secondary visual variables
The secondary visual variables with some examples of their simple
application to the basic graphic elements.
From Robinson, et al., 1995
Perception and Design 36
Classes of symbols
• Point-emphasising symbols
• Line-emphasising symbols
• Area-emphasising symbols
• Volume-emphasising symbols
Perception and Design 37
Classes of
symbols (cont.)
Some examples of the
four classes of
symbols (point-, line-,
area-, and volume-
emphasising) and how
they might be used for
a few of the kinds of
qualitative and
quantitative data.
From Robinson, et al., 1995
Perception and Design 38
Typography and lettering the map
• Elements of typographic design
– Type style (typeface)
– Type form (style)
– Type size - measured by points (1 point = 1/72” 
0.35mm)
– Type colour
• Lettering the map
– Positioning
Perception and Design 39
History of map lettering
A portion of one of the maps in Sir Robert Dudley’s atlas, Dellá Arcano del
Mare (1646-1647).
Cited in Robinson, et al., 1995
Perception and Design 40
Type style
Times Roman
Helvetica
Courier
Bookman
Century Gothic
Comic Sans
Sans Serif
Normal Italic Bold Bold Italic
Times Roman
Helvetica
Courier
Bookman
Century Gothic
Comic Sans
Sans Serif
Times Roman
Helvetica
Courier
Bookman
Century Gothic
Comic Sans
Sans Serif
Times Roman
Helvetica
Courier
Bookman
Century Gothic
Comic Sans
Sans Serif
Perception and Design 41
Type form
Arial
Arial Italic Arial Black Italic
Arial Bold Italic
Arial Bold
Arial Narrow Bold
Arial Black
Arial Narrow
Arial Narrow Bold Italic
Arial Narrow Italic
Perception and Design 42
Lettering the map
Comparison between inappropriately positioning type (left) and
good design practice (right).
From Robinson, et al., 1995

mapping Interpretation and map design.pptx

  • 1.
  • 2.
    Colour • It isdefined as "an attribute of things that results from the light they reflect, transmit, or emit in so far as this light causes a visual sensation that depends on its wavelengths“.
  • 3.
  • 4.
    Primary Colours • Thesecolours are the three colours that can not be created by mixing other colours. The colours are red, blue and yellow.
  • 6.
    Secondary Colours • Thesecolours consist of two primary colours mixed together. The three colours secondary colours are purple red + blue = purple red + yellow = orange yellow + blue = green
  • 8.
    Tertiary Colours • Thesecolours are made by mixing a primary colours with an adjacent secondary colours. yellow + orange = yellow-orange red + orange = red-orange red + purple (violet) = red-purple (red-violet) blue + purple (violet) = blue-purple (blue-violet) blue + green = blue-green yellow + green = yellow-green
  • 10.
  • 11.
    Colour Models • ACOLOR MODEL is a specification of a color coordinate system and the subset of visible colors in this coordinate system.
  • 12.
  • 13.
  • 14.
  • 15.
    The subtractive coloursystem BGR G + R = Y -B BGR B + R = M -G BGR G -B -R
  • 16.
    Perception and Design16 The Relation between RGB and CMY The CMY colour model C = 1 - R M = 1 - G Y = 1 - B
  • 17.
  • 18.
    TERMINOLOGY AND PRINCIPLESIN THE PRACTICAL USE OF COLOR
  • 19.
    Color Wheel Color wheelsare graphical devices that allow us to see relationships between colors. The colors in a color wheel can be arranged in just about any order, but they normally follow a general progression of hues as taken from the visible portion of the electromagnetic spectrum.
  • 21.
    Terminologies • Warm andCool • Complementary and Harmonious Colors • Tints, Shades, and Tones • Qualitative Color Conventions • Quantitative Color Conventions
  • 23.
    Qualitative Color Conventions Acolor convention is a method of using a color that is commonly used and which is typically successful when symbolizing certain types of map features in particular situations.
  • 24.
    Quantitative Color Conventions •Sequential color scheme • A monochromatic sequential scheme • part-spectral sequential color scheme • Rainbow color scheme • diverging color scheme • Theme-Oriented Color Schemes
  • 26.
    Theme-Oriented Color Schemes •Pink and light blue to represent girls and boys • Red and blue to represent the Republican and Democratic parties • Cyan and blues to represent water-oriented themes • Gray tones to represent historical data • Greens to represent “green sector” jobs • Dark reds to represent red wine growing regions • traffic light color scheme
  • 27.
  • 28.
    • Number ofColors = 2^(Bit-depth) • Bit-depth is the number of bits. – It is also called “Color resolution”. Bit-Depth = Color-Depth Bit depth Color resolution Calcuation 1-bit 2 colors 2^1 = 2 2-bit 4 colors 2^2 = 4 3-bit 8 colors 2^3 = 8 4-bit 16 colors 2^4 = 16 8-bits 256 colors 2^8 = 256 16-bits 65,536 colors 2^16 = 65536 24-bits 16,777,215 colors 2^24 = 16.7 million
  • 29.
    Perception and Design29 Patterns • Commonly used as a qualitative area symbol for depicting area features. • Also used to add graphic distinctiveness to uniformly coloured areas, especially on maps with a large number of classes.
  • 30.
    Perception and Design30 Categories of patterns • Coarse line patterns • Dot patterns • Pictographic patterns • Reversed patterns
  • 31.
  • 32.
    Use of patterns Asimple monochrome map contrasting the use of parallel line and dot patterns. Line patterns are perceptually unstable, and all but the finest textures should be used with caution.
  • 33.
    Perception and Design33 Visual variables • Primary visual variables – Shape – Size – Orientation – Hue (colour) – Value (colour) – chroma (colour) • Secondary visual variables – Arrangement (pattern) – Texture (pattern) – Orientation (pattern)
  • 34.
    Perception and Design34 Primary visual variables The primary visual variables with some examples of their simple application to the classes of symbols. From Robinson, et al., 1995
  • 35.
    Perception and Design35 Secondary visual variables The secondary visual variables with some examples of their simple application to the basic graphic elements. From Robinson, et al., 1995
  • 36.
    Perception and Design36 Classes of symbols • Point-emphasising symbols • Line-emphasising symbols • Area-emphasising symbols • Volume-emphasising symbols
  • 37.
    Perception and Design37 Classes of symbols (cont.) Some examples of the four classes of symbols (point-, line-, area-, and volume- emphasising) and how they might be used for a few of the kinds of qualitative and quantitative data. From Robinson, et al., 1995
  • 38.
    Perception and Design38 Typography and lettering the map • Elements of typographic design – Type style (typeface) – Type form (style) – Type size - measured by points (1 point = 1/72”  0.35mm) – Type colour • Lettering the map – Positioning
  • 39.
    Perception and Design39 History of map lettering A portion of one of the maps in Sir Robert Dudley’s atlas, Dellá Arcano del Mare (1646-1647). Cited in Robinson, et al., 1995
  • 40.
    Perception and Design40 Type style Times Roman Helvetica Courier Bookman Century Gothic Comic Sans Sans Serif Normal Italic Bold Bold Italic Times Roman Helvetica Courier Bookman Century Gothic Comic Sans Sans Serif Times Roman Helvetica Courier Bookman Century Gothic Comic Sans Sans Serif Times Roman Helvetica Courier Bookman Century Gothic Comic Sans Sans Serif
  • 41.
    Perception and Design41 Type form Arial Arial Italic Arial Black Italic Arial Bold Italic Arial Bold Arial Narrow Bold Arial Black Arial Narrow Arial Narrow Bold Italic Arial Narrow Italic
  • 42.
    Perception and Design42 Lettering the map Comparison between inappropriately positioning type (left) and good design practice (right). From Robinson, et al., 1995