What is ComputerGraphics?
• Computer graphics is the display, storage
& manipulation of images and data for the
visual representation of a system.
• Computer graphics is an art of drawing
pictures, lines, charts, etc.
using computers with the help of
programming.
• Computer graphics is made up of number
of pixels.
3.
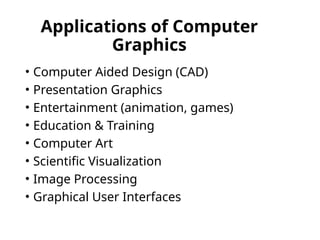
Applications of Computer
Graphics
•Computer Aided Design (CAD)
• Presentation Graphics
• Entertainment (animation, games)
• Education & Training
• Computer Art
• Scientific Visualization
• Image Processing
• Graphical User Interfaces
4.
Computer Aided Design(CAD)
•Used in design of buildings, automobiles,
aircraft, watercraft, spacecraft, computers,
textiles & many other products
• AutoCAD software was the first CAD
program.
5.
Computer Aided Design(CAD)
• Graphics design package provides standard
shapes
• Animations are also used in CAD
applications
• Realistic displays of architectural design.
6.
Presentation Graphics
• Helpfor making reports
• Summarize financial, statistical, mathematical,
scientific, economic data for research reports,
managerial reports
• Presentation Slides
- Bar charts, Line graphs, Pie charts etc.
Education and Training
•Computer generated models of physical,
financial and economic systems are used as
educational aids.
• Models of physical systems, physiological
systems, population trends, or equipment
such as color-coded diagram help trainees
understand the operation of the system
12.
Education and Training
Specializedsystems used for training applications
• Simulators for practice sessions or training of
ship captains
• Aircraft pilots
• Heavy equipment operators
• Air traffic-control personnel
13.
Computer Art
• Computerart typically refers to any form
of graphic art or digital imagery which is
produced with the aid of a computer
• Used in Fine Art & Commercial Art
• Includes artist’s paintbrush programs,
paint packages, CAD packages and
animation packages
• These packages provides facilities for
designing object shapes & specifying
object motions.
Computer Art
• Electronicpainting
• Picture painted electronically on
a graphics tablet.
• Morphing
• A graphics method in which one object is
transformed into another
Visualization
• Visualization isthe process of representing data
graphically and interacting with these
representations in order to gain insight into the
data.
• Scientific Visualization
• Producing graphical representations for
scientific, engineering, and medical data sets
• Scientists, engineers, medical personnel,
business analysis, and others often need to
analyse large amounts of information or to
study the behaviour of certain processes.
Image Processing
There aredifferent examples of image
processing in our daily life. It is used in
• Image enhancement.
• Law Enforcement
• Medical
• Moving object tracking…etc.
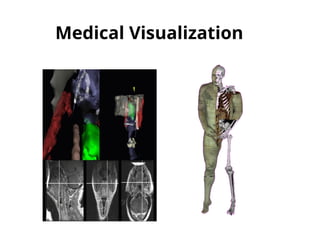
Medical
Different types ofimaging tools such as X-
ray, Ultrasound uses image processing to
diagnose disease.
25.
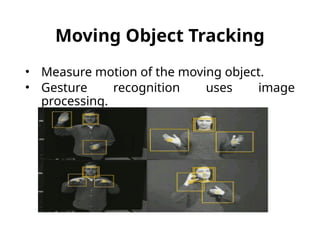
Moving Object Tracking
•Measure motion of the moving object.
• Gesture recognition uses image
processing.
26.
Graphical User Interface
Computergraphics is used to design: Menus,
icons, cursors, dialog boxes, scrollbars,
valuators, grids, 3d interface.
27.
Graphical User Interface
•Lay user can easily use the computer with
the help of GUI.
• User don’t have to remember commands.
• More interactive interface.
28.
Conclusion
• Applications ofcomputer graphics are
increasing day by day.
• Computer graphics affect everyone's life in
almost every aspect.
• Importance of computer graphics in our
lives cant be denied now we can’t imagine
our lives without computer graphics…
Outline:
Properties of Light
ColorModels
Standard primaries and the chromaticity
diagram
The RGB color model
The HSV color model
The HSL Color model
Color Models Applications
Dithering VS Half-toning
31.
Properties of Light
Eachfrequency value within the visible region of the electromagnetic spectrum
corresponds to a distinct spectral color.
FIGURE-1
32.
• When whitelight is incident on an opaque object , some
frequencies are reflected and some are absorbed.
• The combination of frequencies present in the reflected in
the reflected light determines the color of the object that
we see.(Dominant frequency or Hue)
Properties of Light
Characteristics of Color
1.Dominant Frequency (Hue)
The color we see (red, green,
purple).
2. Brightness
The total light energy, how bright is the color (How
bright are the lights illuminating the object?)
3. Purity (Saturation)
Purity describes how close a light appears to be to a
pure spectral color, such as pink is less saturated than
red.
Chromaticity refers to the two properties (purity & hue)
together.
35.
•A color modelis an abstract mathematical model
describing the way colors can be represented as tuples
of numbers, typically as three or four values or color
components. [Wikipedia]
•Any method for explaining the properties or behavior
of color within some particular context is called a Color
Model.[Hearn, Baker ,computer graphics with OpenGL]
Color Model
36.
Color Model
Primary Colors
Setsof colors that can be combined to make a useful range of
colors
Color Gamut
Set of all colors that we can produce from the primary colors.
Complementary Colors
Pairs of colors which, when combined in the right proportions,
produce white.
Example, in the RGB model: red & cyan , green & magenta ,
blue & yellow.
•No finite set of real primary colors can be combined to produce all possible
visible colors.
•However, given a set of three primary colors, we can characterize any fourth
color using color-mixing processes.
37.
Shades , Tints& Tones
• A shade is produced by “dimming ” a hue.[Adding black].
Dark Blue = pure blue + black
• A tint is produced by "lightening" a hue. [Adding white].
Pastel red = pure red + white
• Tone refers to the effects of reducing the "colorfulness" of a hue. [adding
gray] or [adding black & white].
Thus, shading takes a hue toward black, tinting takes a hue
towards white, and tones cover the range between.
Color Model
38.
Color Model
Additive color
Useslight to display color. Mixing begins with black and ends with white; as
more color is added, the result is lighter and tends to white. Used for computer
displays
Example: The RGB colors are light primaries and colors are created with light.
A subtractive color
Uses ink to display color. Mixing means that one begins with white and ends
with black; as one adds color, the result gets darker and tends to black. Used
for printed material
It is called 'subtractive' because its wavelength is less than sum of the
wavelengths of its constituting colors.
39.
Standard Primaries &the chromaticity
diagram
•This is an international standard for primary colors
established in 1931.
• It allows all other colors to be defined as weighted sum
of the three "primary" colors.
• There are no real three colors that can be combined to
give all possible colors. Therefore the Three standard
primaries are selected [imaginary numbers].
•They are defined mathematically with positive color-
matching functions that specify the amount of each
primary needed to describe any spectral color.
40.
40
Standard Primaries &the chromaticity
diagram
Color-matching functions
A color in the
vicinity of
500nm can be
matched only
but
subtracting an
amount of red
light from a
combination of
blue and green
lights.
41.
•The red, green,and blue (RGB) color space
is widely used throughout computer
graphics.
•Additive Color Model.
•Unit Cube defined on R, G & B axes.
•The Origin (0,0,0) represents black and the
diagonally opposite vertex (1,1,1) is White.
•Vertices of the cube on the axes represent
primary colors, and the remaining vertices
are the complementary color points for
each of the primary colors.
•Shades of gray are represented along the
RGB Model
42.
Each color pointwithin the unit cube can be represented
as w weighted vector sum of the primary colors, using
unit vectors R,G and B.
C(λ) =(R,G,B) = RR +GG+ BB
Where R,G, and B are assigned values in the range from 0
to 1.0.
For example , the magenta vertex is obtained by adding
the maximum red and blue values to produce : (1,0,1)
RGB Model
43.
HSV Model
Every coloris represented by three components Hue ( H ),
Saturation ( S ) and Value ( V )
44.
HSV Model
The Hue(H) of a color refers to which pure color it
resembles. All tints, tones and shades of red have the same
hue. (simply the color we see)
45.
HSV Model
The Saturation(S) of a color describes how white the color
is. Or the amount of white added to the color. A pure red is
fully saturated (S=1) means no white added
46.
HSV Model
The Value(V) of a color, also called its lightness, describes
how dark the color is. A value of 0 is black, with increasing
lightness moving away from black.
47.
HSL Model
• Double-coneRepresentation
Parameters are :
• Hue (H)
• Lightness (L)
• Saturation (S)
48.
HSL Model
• VerticalAxis is called Lightness(L).
• At L=0 we have black , and at L=1 we have white
• Grayscale values are along the L axis
• The pure colors lie at the axis where L=0.5 and S=1.0
49.
Color Model ApplicationArea Color Model Application Area
RGB
- Computer graphics
- Image processing
- Image Analysis
- Image Storage
CMY(K) Printing
HSV, HSL
- Human visual perception
- Computer graphics processing
- Computer Vision
- Image Analysis
- Design image
- Human vision
- Image editing software
- Video editor
YIQ
- TV broadcasting
- Video system
Color Models Applications
50.
• A techniqueused in newspaper printing
Only two intensities are possible, blob of ink and no blob
of ink. But, the size of the blob can be varied
Halftone
Half toning isthe reproduction of grayscale images using
dots but with varying size.
Typical Application- Laser printer.
If a monitor can't show a certain color, dithering
approximates the color by placing close together pixels in
colors that the computer can display.
Typical Application- Web graphic designers often limit
their images to 256 colors and use dithering to imply
other colors.
Halt-Toning Vs. Dithering
#43 Changing the saturation parameter corresponds to adding or subtracting white and changing the value parameter corresponds to adding or subtracting black.


![•A color model is an abstract mathematical model
describing the way colors can be represented as tuples
of numbers, typically as three or four values or color
components. [Wikipedia]
•Any method for explaining the properties or behavior
of color within some particular context is called a Color
Model.[Hearn, Baker ,computer graphics with OpenGL]
Color Model](https://image.slidesharecdn.com/cggtask-250829044609-c3ba4f2c/85/CGG_TASK-pptx-35-320.jpg)

![Shades , Tints & Tones
• A shade is produced by “dimming ” a hue.[Adding black].
Dark Blue = pure blue + black
• A tint is produced by "lightening" a hue. [Adding white].
Pastel red = pure red + white
• Tone refers to the effects of reducing the "colorfulness" of a hue. [adding
gray] or [adding black & white].
Thus, shading takes a hue toward black, tinting takes a hue
towards white, and tones cover the range between.
Color Model](https://image.slidesharecdn.com/cggtask-250829044609-c3ba4f2c/85/CGG_TASK-pptx-37-320.jpg)

![Standard Primaries & the chromaticity
diagram
•This is an international standard for primary colors
established in 1931.
• It allows all other colors to be defined as weighted sum
of the three "primary" colors.
• There are no real three colors that can be combined to
give all possible colors. Therefore the Three standard
primaries are selected [imaginary numbers].
•They are defined mathematically with positive color-
matching functions that specify the amount of each
primary needed to describe any spectral color.](https://image.slidesharecdn.com/cggtask-250829044609-c3ba4f2c/85/CGG_TASK-pptx-39-320.jpg)