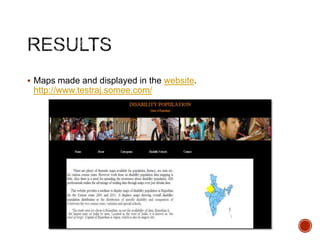
3. It is a well-known fact that thematic maps have been very useful in
location based data analysis. They provide information about a
particular location, spatial patterns and compare the patterns of two
or more maps of the location showing different themes. There are
plenty of thematic maps available for population, literacy, sex ratio
etc. for various census years. However work done on disability
population data mapping is little. Also there is a need for spreading
the awareness about disability population. GIS professionals
realise the advantage of reading data through maps over just
tabular data.
4. Reading/ analysing demographic or statistical data of a location
using tables, queries, and charts can be further enhanced by
making maps of that location for the given data.
In today’s times technology hugely helps in
storing, maintaining, reading and analysing data. Many
organisations that involve in map making have converted their
methods from traditional to use of advanced technology called
Geographic Information Systems (GIS).
Maps assist in location based services, however it has to reach
the common man and concerned people to make a difference and
web is a chosen medium to spread the word.
5. Map the disability population data of Rajasthan state (figure of
study area) in India for the Census Years 2001 and 2011 using
GIS Technology.
Maps showing the point location of special schools in the state for
the disabled are also prepared.
Build a website that displays these maps aiming to reach out to
NGOs and general public for data analysis. As a result, spreading
of awareness about the various disability phenomenon is
achieved.
6.
7. Two polygon shape files are required, one each for both the
Census years and one point shape file that displays the special
schools for disabled children present today
Two tables for the both the Census years having a row each for
all the districts as per the respective Census boundary is
required.
Each polygon feature in the shape file is attributed the respective
row the in the non spatial table.
The data developed is used for preparing thematic maps out of
the polygon shape file of Rajasthan state showing the districts.
Map is prepared by overlaying the point shape file of the disability
schools in Rajasthan on the district polygon shape file of year
2011.
Website is developed which displays the maps and details out the
concept of this project.
8. Maps made and displayed in the website.
http://www.testraj.somee.com/
9. This project has used desktop GIS technology to make maps. These
maps are then stored as bmp images and used in the web
application for display. It serves the purpose and comes within the
current scope of this project. In the web application, the thematic
maps display the spatial patterns of the disability phenomenon in
Rajasthan state at district level. The location maps indicate the
schools for the disabled in a district.
To improve and enhance the scope of this project, web GIS
technology can be used where maps are put on a GIS server and
are called in the web application. An advantage of processing map
data through server is that more than one layer as required by the
user can be viewed at any given point in time and also can be zoom
to a particular location of choice. For example, to locate a blind
school we can have two layers of the streets and high resolution
imagery behind the location map in the website and make it more
clear to the user. This project can be extended to other locations too
apart from Rajasthan based on data availability.
10. The earliest literature 'Rig-Veda' reveals that some kind of
population count was maintained in during 800-600 BC in India.
1872 has been popularly labelled as the first population census of
India.
The first synchronous census in India was held in 1881.
The Indian Census is one of the largest administrative exercises
undertaken in the world.
The gigantic task of census taking was completed in two phases.
House -listing Operations
Population Enumeration