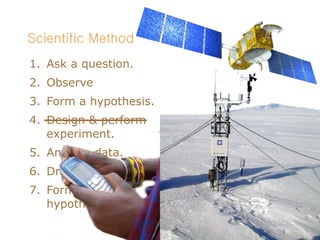
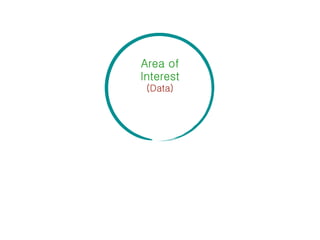
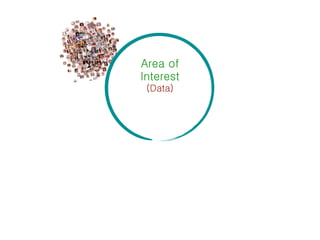
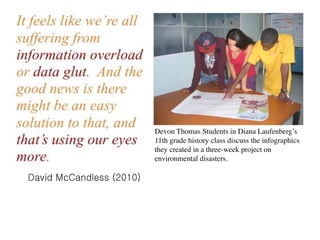
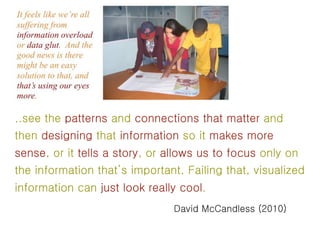
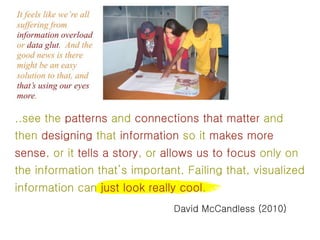
Making Numbers
Tell Their Story
Making Numbers
Tell Their Story
Making Numbers
Tell Their Story
Making Numbers
Tell Their Story
1. Ask a question.
2. Observe
3. Form a hypothesis.
4. Design & perform
   experiment.
5. Analyze data.
6. Draw conclusion.
7. Formulate final
   hypothesis
1. Ask a question.
2. Observe
3. Form a hypothesis.
4. Design & perform
   experiment.
5. Analyze data.
6. Draw conclusion.
7. Formulate final
   hypothesis
1. Ask a question.
2. Observe
3. Form a hypothesis.
4. Design & perform
   experiment.
5. Analyze data.
6. Draw conclusion.
7. Formulate final
   hypothesis
‣
‣
‣
‣
‣
Devon Thomas Students in Diana Laufenberg’s
11th grade history class discuss the infographics
they created in a three-week project on
environmental disasters.
‣
‣

‣

‣
    ‣
    ‣

    ‣


‣
‣
‣

‣

‣
    ‣
    ‣

    ‣


‣
‣
‣

‣

‣
    ‣
    ‣

    ‣


‣
‣
‣

‣

‣
    ‣
    ‣

    ‣


‣
‣
‣

‣

‣
    ‣
    ‣

    ‣


‣
‣
‣

‣

‣
    ‣
    ‣

    ‣


‣
‣
‣

‣

‣
    ‣
    ‣

    ‣


‣
‣
‣

‣

‣
    ‣
    ‣

    ‣


‣
‣
‣

‣

‣
    ‣
    ‣

    ‣


‣
Some Examples
             @
@
back
back
back
back
back
see the patterns and connections that matter and
then designing that information so it makes more
sense, or it tells a story, or allows us to focus only
on the information that’s important. Failing that,
visualized information can just look really cool.
                 David McCandless in the opening to his TED
                 talk, The Beauty of Data Visualization
Making Numbers Tell their Story

Making Numbers Tell their Story

Editor's Notes